faculty of business individual assignment group assignment cover sheet
Bạn đang xem bản rút gọn của tài liệu. Xem và tải ngay bản đầy đủ của tài liệu tại đây (5.26 MB, 31 trang )
<span class="text_page_counter">Trang 1</span><div class="page_container" data-page="1">
<b>FPT UNIVERSITY FACULTY OF BUSINESS INDIVIDUAL ASSIGNMENT </b>
<b>FALL 2020</b>
<b>GROUP ASSIGNMENT COVER SHEET Course Details </b>
Subject Code : <b>ACC101 </b>
Subject Title <b>: PRINCIPLES OF ACCOUNTING </b>
Lecturer’s Name : <b>MS. NGUYEN THI PHUONG DUNG Assignment Details </b>
Due Date : <b>19 NOVEMBER 2020 </b>
Students’ <b>name: </b>
1.Đỗ Như Kim Nguyên 2.Lê Trà My
3. Đỗ Hoàng Khải 4. Lê Trần Cẩm Hân 5. Hoàng Tú Tài 6. Phạm Thế Việt
</div><span class="text_page_counter">Trang 2</span><div class="page_container" data-page="2"><b>3. STRATEGIC PLANNING AND MARKET POSITION </b> B. FINANCIAL DATA ... 12
<b>1. Analysis of Income Statement ...12 </b>
</div><span class="text_page_counter">Trang 3</span><div class="page_container" data-page="3">b. Inventories ... 19
c. Share Capital... 19
d. Current Liabilities ... 19
e. Non- current liabilities ... 19
<b>3. Analysis of Statement of Cash flows ... 20 </b>
a. Operating cash flow ... 20
b. Investing cash flow ... 21
c. Financing cash flow ... 22
<b>4. Analysis of Ratios ... 23 </b>
a. Gross profit ratio ... 23
b. Debt Equity Ratio ... 24
APPENDIX C REVENUES & EXPENSES – ... 29
APPENDIX D CASH FLOW – ... 30
</div><span class="text_page_counter">Trang 5</span><div class="page_container" data-page="5"><b>A. NON-FINANCIAL DATA 1. CORPORATE INFORMATION a. Company Overview : </b>
Vietnam Dairy Products Joint Stock Company (Vinamilk) was established in 1976, quickly becoming a leading manufacturer of dairy products in Vietnam and one of the leading dairy companies in the world.
Vinamilk has invested in international facilities in the US, Poland and New Zealand to assert its position as an international enterprise with strong potential and resources.
Vinamilk has dominated the dairy market for 40 years with many quality dairy products: powdered milk, liquid milk, yogurt, condensed milk ... Vinamilk giant dairy group has appeared in more than 45 countries in any
country. By merging and exporting, we can see Vinamilk's products everywhere, Vinamilk has now become a familiar dairy brand among domestic and international consumers. Export sales account for 13% of the company's total revenue.
Up to now, Vinamilk has built 14 manufacturing factories, 2 logistics factories, 3 branches of sales offices, one dairy factory in Cambodia (Angkormilk) and one representative office in Thailand.
</div><span class="text_page_counter">Trang 7</span><div class="page_container" data-page="7">Vinamilk has competitive
advantages such as the leading position in the industry supported by well-established brands.
Diversified product portfolio, nationwide distribution and sales network Sustainable relationship with suppliers.
Production technology and equipment meet international standards
The main markets are classified as follows:
✓ ASEAN: Cambodia, Philippines, Vietnam
✓ Middle East: Iraq, Kuwait, UAE
✓ The rest: USA, Australia, Maldives,
Suriname.
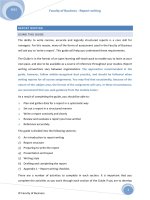
Vinamilk is currently facing
relatively high competition from
domestic and foreign brands such
<b>as: TH True Milk, </b>
<b>Nesle, Abbott, Mead Jonson, .. </b>
The future dairy market will continue to expand
and Competition level increases.
</div><span class="text_page_counter">Trang 8</span><div class="page_container" data-page="8">
<b>VINAMILK COMPANY </b>
<b>d.</b>
<b> Detail of Board Directors: </b>
<b>BOARD OF DIRECTORS </b>
</div><span class="text_page_counter">Trang 9</span><div class="page_container" data-page="9"><b>CHIEF EXECUTIVE OFFICER </b>
<b>BOARD OF MANAGEMENT </b>
</div><span class="text_page_counter">Trang 10</span><div class="page_container" data-page="10"><b>VINAMILK COMPANY </b>
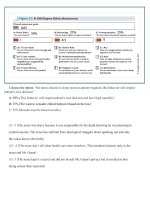
<b>2. ANALYSIS OF SHAREHOLDERS </b>
<b>Shareholders Structure and Important Shareholders </b>
<b>3. STRATEGIC PLANNING AND MARKET POSITION </b>
</div><span class="text_page_counter">Trang 12</span><div class="page_container" data-page="12"><b>VINAMILK COMPANY </b>
<b>B. FINANCIAL DATA 1. Analysis of Income Statement </b>
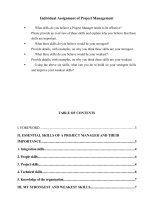
<b>a. Revenue/salses </b>
Vinamilk continues to maintain financial stability in 2019.Consolidated net revenue reached 56,318 billion VND in 2019, up 7.1% over the same period in 2018.Vinamilk continues to maintain financial stability in 2019. Consolidated net revenue reached VND 56,318 billion for the whole 2019, up 7.1% over the same period in 2018.Compared to growth of 2.7% in 2018, the 6.3% growth in 2019 mainly comes from:
➢ Volume growth led by some major product lines with double-digit growth. In addition, some high-end product lines also recorded impressive growth, showing Vinamilk's suitable direction in the product portfolio's high-end strategy.
➢ Vinamilk is one of the pioneers participating in the National School Milk Program. By the end of 2019, Vinamilk has won the bid in the form of public bidding in 21 provinces and cities across the country, to implement the School Milk Program
<b>Revenues/Sales</b>
<b>Billions (VND)</b></div><span class="text_page_counter">Trang 13</span><div class="page_container" data-page="13"><b>b. Gross Profit </b>
<small>24,234</small> <sup>24,611</sup>
<b>Net profit after tax</b>
</div><span class="text_page_counter">Trang 15</span><div class="page_container" data-page="15"><b>c. Operating expense: </b>
Nowadays, businesses expand production companies, shops and the number of labor resources. Besides, the cost of goods and services also increased significantly, affecting this result. However, in parallel with the increase in revenue, the focus on operating costs is a necessity. VNM still does well in exploiting profit based on this operating expense. The operating costs of the company tend to increase from 2017 to 2019. In 2019, it reached VND 44,656 billion, an increase of approximately 12% compared to 2017. This
2019 reached 25.6% of net revenue, stable compared to 25.5% in 2018. The total non-audit service costs incurred in 2019 only accounted for 32% of the
<b>Total operating expenses</b>
</div><span class="text_page_counter">Trang 16</span><div class="page_container" data-page="16"><b>VINAMILK COMPANY </b>
<b>d. Tax expense: </b>
Corporate income tax on consolidated profit or loss for the year includes current income tax and deferred income tax. Income tax is recognized in the consolidated statement of income unless there are any income taxes on the items that are recognized directly in equity, then the income tax is also recognized directly into equity. In 2018, tax costs decreased compared to 2017 but by 2019, it increased dramatically. The total tax expense in 2019 is more than VND 2,200 billion. Tax costs significantly impact the company's profits. Contributing to the total expenses the company spent to earn erratic after- tax profits in the past 3 years
<b>Total tax expenses</b>
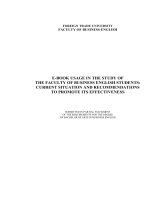
</div><span class="text_page_counter">Trang 17</span><div class="page_container" data-page="17"><b>e. Depreciation </b>
In 2017, it reached 8,778 billion but in 2019 reached 12,632 billion, increasing approximately 43%. The company has focused on using existing assets to increase production efficiency. The specific expression is the significant growth in revenue of VNM in 2019. The total cost of depreciation over time of the company increased significantly. Focus on fixed assets and investment properties
<b>Total Dep. Expenses</b>
</div><span class="text_page_counter">Trang 18</span><div class="page_container" data-page="18"><small>Total AssetsInventoriesShare CapitalCurrent LiabilitiesNon - Current Liabilities</small>
</div><span class="text_page_counter">Trang 19</span><div class="page_container" data-page="19"><b>b. Inventories </b>
The inventory of Vinamilk has changed significantly from 2017 to 2018. The number of inventories increased rapidly from 4,021,058,976,634 VND to 5,525,845,959,354 VND , possibly because the company was influenced by competitors so the company sold less products, leading to an increase in inventories, making the company's profit in 2018 is not high. However, in 2019, this number has fall slightly to
4,983,044,403,917 VND. The company has tried to overcome it by attracting more customers to buy its products, making inventories decrease, thereby improving profits.
<b>c. Share Capital </b>
From 2017 - 2018, equity increased from 14,514,534,290,000 VND to
17,416,877,930,000 VND and this number will be maintained until 2019. Vinamilk has attracted investors to invest in the company by how to sell stocks on an exchange. From actual data, it shows that Vinamilk is currently one of the leading companies in the stock market and has continuously maintained in recent years
<b>d. Current Liabilities </b>
From 2017 to 2019, short-term debt accounts for a large proportion and this number has not changed significantly over the years, short-term debts include trade payables, payables to employees and a short loan. In the future, it is possible that Vinamilk's future loans will expand production models. In general, the company uses equity capital instead of having large debt or long-term debt, so although the debt increase does not affect the financial ability of the company too much. In addition, on June 30, Vinamilk signed an agreement to buy and sell shares to transfer securities. However, this transaction is not completed yet and is reflected in the short-term payables related to the investment in Bao Viet Bank.
<b>e. Non- current liabilities </b>
Long-term debt from 2017 to 2018 decreased significantly, but 2019 started to rise slightly again. According to the report, the reason for the prolonged outstanding debt situation is the decrease in tax debt, which means that the company still bears a tax expense with its revenue and profit.
</div><span class="text_page_counter">Trang 20</span><div class="page_container" data-page="20"><b>Operating cash flow</b>
</div><span class="text_page_counter">Trang 21</span><div class="page_container" data-page="21"><b>b. Investing cash flow </b>
The cash flow from investing is one of the sections on the cash flow statement that reports how much money has been created or spent from different investing activities during a particular period. Cash flow from investing activities in the period 2017-2019 increased and decreased significantly. Especially in 2019, it will increase from 1,770 billion (2017) to 6,747 billion (2019). There is a huge difference, which means that Vinamilk has carried out many investment activities during this period and has outstanding financial capacity compared to the years. It helps to reflect the expectations of investors in large projects for profitable production expansion and high growth.
<b>Investing cash flow</b>
</div><span class="text_page_counter">Trang 22</span><div class="page_container" data-page="22"><b>Financing cash flow</b>
</div><span class="text_page_counter">Trang 23</span><div class="page_container" data-page="23"><b>4. Analysis of Ratios </b>
<b>a. Gross profit ratio</b>
Gross profit ratio of Vinamilk since 2017 has not fluctuated significantly. This reflects the relatively good business performance, pricing strategy and cost control levels. From 47.7% - 47.2%, it is a relatively stable profit level over the years that not all companies can do like Vinamilk. In addition, this shows a solid position and ability to attract various investment capital sources, and Vinamilk's ability to expand production processes.
<b>Gross Profit Ratio</b>
</div><span class="text_page_counter">Trang 24</span><div class="page_container" data-page="24"><b>VINAMILK COMPANY </b>
<b>b. Debt Equity Ratio </b>
The debt to equity ratio helps investors have an overview of the financial strength and financial structure of the business. Over the past 3 years from 2017 to 2019, we see that the debt to equity ratio has always been at <1. This means that Vinamilk's assets are being financed mainly by equity capital. Liabilities account for a small proportion of total assets or total capital, businesses will face less financial difficulties.
<b>c. Debt Ratio </b>
Debt ratio is the relationship between the total amount of debt to pay and the total income of the borrower. Over the past 3 years, Vinamilk has maintained a stable level from 0.31% (2017) to 0.33% (2019). This reflects the reasonable policy of using debt and the financial autonomy of Vinamilk is very good. Debt ratio at a stable level helps Vinamilk reduce risk if borrowing long-term loans.
<b>d. Current Ratio </b>
Current ratio of Vinamilk is similar to other ratios without much change. The ratio of payment is greater than 1 (> 1) over the years, showing that the higher current solvency means the volume of company assets is getting bigger. This objectively
<b>RATIO</b>
</div><span class="text_page_counter">Trang 25</span><div class="page_container" data-page="25">banks feel secure with their repayment ability when borrowing short-term loans to supplement working capital.
<b>e. Equity Ratio </b>
Equity ratio of 3 years has no big change. Equity remains an average of 67% to 70% of total assets. However, in 2019, the index decreased slightly to 67% but still did not affect the overall financial situation of the company, but it was also a good signal for promoting investment to earn more revenues from owners' capital. The above index shows that Vinamilk is still maintaining its available capital well
<b>f. Return on total asset ratio </b>
Return on total assets (ROA) reflects the relationship between profitability and total existing assets of the business. Vinamilk's revenue for the period 2017-2019 reached 1.37 - 1.59 and has a decreasing trend in recent years.
<b>g. Inventory turnover </b>
Inventory revenue from 2017-2019 tends to decrease steadily over the years. In 2017, the high inventory turnovers reflected the rapid sales of Vinamilk, significantly reducing inventories. But by 2019, inventory turnover tends to decrease, telling us that Vinamilk's sales speed is showing signs of slowing down. This significantly affects the company's operations. But 2019's inventory impact also comes from reserves to meet demand in time by the end of 2018. However, for a business, inventory turnover that is too little is not good and will not guarantee. be like the
<b>Inventory turnover</b>
</div><span class="text_page_counter">Trang 26</span><div class="page_container" data-page="26"><b>VINAMILK COMPANY </b>
market demand. The efforts in 2019 show that Vinamilk is trying to adjust inventories for production speed so that it reasonably meets the needs of customers.
</div><span class="text_page_counter">Trang 27</span><div class="page_container" data-page="27"><b>Short term investment 12,435,744,328,964 8,673,926,951,890 10,561,714,377,33 </b>
Short-term security investments 1,153,041,048 443,154,262,451 443,130,811,523 Allowance for decline in value of investments in
Investments held to maturity 12,435,431,874,703 8,231,378,417,697 10,119,259,273,833
<b>Short term Account Receivable 4,503,154,728,959 4,639,447,900,101 4,591,702,853,157 </b>
Trade receivables 3,474,498,518,959 3,380,017,354,930 3,613,981,838,047 Advanced payments to suppliers 576,013,061,394 876,158,254,325 622,978,664,875
Shortage of assets awaiting resolution 16,794,705,625 11,263,181,092 85,680,193
<b>Merchandise Inventory 4,983,044,403,917 5,525,845,959,354 4,021,058,976,634 </b>
Merchandise inventory 4,996,114,799,978 5,538,304,348,980 4,041,302,638,611 Allowances for inventories 13,070,396,061 12,458,389,626 20,243,661,977
<b>Other Short-term assets 134,427,276,260 197,925,815,821 169,622,668,237 </b>
Short term Prepaid expenses 68,634,341,838 54,821,120,257 51,933,181,113
Taxes receivable from the government budget 4,916,942,856 462,315,064 556,775,985
<b>Long-term assets 19,978,308,009,482 16,806,351,859,342 14,359,884,047,968 </b>
Receivables from long-term loans 545,312,000 3,143,509,548 5,373,558,222 Other long term receivable 20,624,656,995 17,641,321,463 18,427,382,918
<b>Fixed assets 14,893,540,216,703 13,365,353,599,098 10,609,309,098,847 </b>
Tangible fixed assets 13,743,909,618,601 13,047,771,431,436 <sub>10,290,516,618,864 </sub>
Accumulated Depreciation 12,483,526,535,648 9,904,589,018,876 8,626,919,181,620 Intangible fixed assets 1,149,630,598,102 317,582,167,662 318,792,479,983
Accumulated Depreciation 148,034,384,633 157,987,268,730 150,756,858,578
</div><span class="text_page_counter">Trang 28</span><div class="page_container" data-page="28"><b>VINAMILK COMPANY </b>
<b>Real estate investment 62,018,116,736 90,248,200,759 95,273,270,528 </b>
<b>Long term asset in progress 943,845,551,903 868,245,878,253 1,928,569,256,697 </b>
Long term for work in progress 249,633,893,396 214,398,200,249 181,678,288,317 Construction in progress 694,211,658,507 653,847,678,004 1,746,890,968,380
<b>Long term financial assets 986,676,290,429 1,068,660,695,119 555,497,854,952 </b>
Investment in joint ventures and associates 688,112,587,059 497,498,739,617 481,282,722,569 Equity investments in other entities 104,537,010,212 72,083,527,154 82,336,523,394 Provision for long-term financial investment 5,973,306,842 921,571,652 8,121,391,011 Investments held to maturity 200,000,000,000 500,000,000,000
<b>Other Long term asset 3,071,057,864,716 1,325,400,244,471 1,117,459,677,120 </b>
Long-term prepaid expenses 678,630,479,869 750,599,476,304 612,134,810,005
Other Short term Payble 1,956,364,398,828 2,540,327,951,932 2,783,824,177,984
Welfare and reward fund 633,936,556,611 507,013,437,050 692,489,769,561
<b>Long term Liabilities 525,766,348,310 455,147,352,790 598,698,196,544 </b>
Deferred tax liabilities 374,926,875,377 204,757,714,031 203,618,107,064
</div><span class="text_page_counter">Trang 29</span><div class="page_container" data-page="29">Owners' equity included: 29,731,255,204,364 26,271,369,291,927 23,873,057,813,861
<b>Net operating profit 12,797,090,115,372 11,876,513,440,752 12,226,418,187,645 </b>
<b>Results of other activities 1,380,476,815 175,182,825,371 2,527,196,491 </b>
<b>Profit before tax 12,795,709,638,557 12,051,696,266,123 12,228,945,384,136 </b>
<b>Income tax expense - current 2,238,365,796,113 1,874,905,225,483 1,967,066,705,229 </b>
<b>Income tax expense/benefit - deferred 3,011,961,553 28,838,670,599 16,295,874,259 </b>
Net profit after tax 10,554,331,880,891 10,205,629,711,239 10,278,174,553,166 Equity holders of the Company 10,581,175,671,989 10,227,281,151,464 10,295,665,148,846
</div>