Luận văn thạc sĩ Quy hoạch và quản lý tài nguyên nước: Impacts of the Vung Tau - Go cong sea dyke on hydrodynamic flow regime
Bạn đang xem bản rút gọn của tài liệu. Xem và tải ngay bản đầy đủ của tài liệu tại đây (3 MB, 76 trang )
<span class="text_page_counter">Trang 1</span><div class="page_container" data-page="1">
MINISTRY OF EDUCATION AND TRAINING MINISTRY OF AGRICULTURE AND RURAL DEVELOPMENT
IMPACTS OF THE VUNG TAU — GO CONG SEA DYKEON HYDRODYNAMIC FLOW REGIME
BUI DUC TOAN
MSc Thesis on Integrated Water Resources Management
August 2015
</div><span class="text_page_counter">Trang 2</span><div class="page_container" data-page="2">IMPACTS OF THE VUNG TAU - GO CONG SEA DYKE ONHYDRODYNAMIC FLOW REGIME
<small>Major: Integrated Water Resources Management</small>
<small>OF MASTER DEGREE,</small>
<small>Supervisor (9):</small>
<small>Assoc. Prof, Dr. Nguyen Cao Don</small>
<small>This research is done for the partial fulfilment of requirement forlaster of Science Degree at Thuy Loi University</small>
<small>(This Master Programme is supported by NICHE ~ VNM 106 Project)</small>
<small>Ha Noi, August, 2015</small>
</div><span class="text_page_counter">Trang 3</span><div class="page_container" data-page="3">The low-lying terrain downstream of Saigon - Dong Nai River is mostaffected by natural disasters such as, flooding, saltwater intrusion causingdifficulties in process of socio-economic development, The project ofbuilding Vung Tau - Go Cong sea dyke with a length of 32km was proposedto solve these problems, in particularly creating a reservoir for storing waterand preventing saltwater intrusion, expanding urban space, industrial parks,
<small>tourism, services</small> shelter from the storm boats, reserving fresh water in thefuture, However, hydrodynamic regime in this area would be altered by theconstruction of Vung Tau - Go Cong, causing sedimentation in estuaries,changing salt marsh ecosystems. The comparison between hydrodynamicregime with two scenatios before and after construction sea dyke will bementioned in this thesis,
In this study, MIKE 21 model was used to simulate hydrodynamicregime in study area, The computed domain is described as follow: Latitude:
1080000 ~ 1160000; Longtitude: 67000-70000. The grid which used incomputation was unstructured mesh because it met the requirement ofaccuracy and detail computation. Exported data from MIKE 11 model wasused as input data for discharge boundary of model. The observed water leveldata of Vung Tau station and global tide prediction data were used for modellibration and validation, Duration time of model calibration and validation.for the research site from 17/October/2000 to 20/10/2000 and21/Oetober/2000 to 24/10/2000 respectively. The calibrated parameter wasbed resistance.
The application of model is considered in two scenarios: without seadike and with sea dike. Both scenari how semidiumal tide regime in GoCong- Vung Tau area, Moreover those confirm that current is mainly
</div><span class="text_page_counter">Trang 4</span><div class="page_container" data-page="4"><small>L area- Res</small>
sea dike creates two distinct areas: The fi voir including maindike, branch dike and Soai Rap estuary; The second area - Ganh Rai Baycontaining Long Tau, Thi Vai estuaries and branch dike, There is asignificant change in hydrodynamic regime between two scenarios at insidereservoir, for example considerable differences in phase, fluctuationamplitude of water level/current. Except for inside the reservoir, there is asmall change in phase, fluctuation amplitude of water level/current at outside
</div><span class="text_page_counter">Trang 5</span><div class="page_container" data-page="5">Thereby certify that the work presented in this thesis entitled, “Impacts of theDung Tau ~ Go Cong sea dyke on hydrodynamic flow regime ” in partialfulfillment of the requirement for the award of the Master of Science inIntegrated Water Resource Management, is done by myselft under thesupervision of Assoc. Prof. PhD. Nguyen Cao Don, The matter embodied inthis thesis has not been submitted by me for the award of any other degree ordiploma,
<small>Ha Noi, date August 2015</small>
Bui Due Toan
</div><span class="text_page_counter">Trang 6</span><div class="page_container" data-page="6">First and foremost I would like to thank the supervisor Assoc. Prof. PhD
<small>Nguyen Cao Don for his great contribution in this thesis, for supporting me</small>
and guiding me stay on the right trend, I want to show deep thanks to Assoc.Prof. Dr. Nguyen Thu Hien and Dr. Hoang Nguyet Minh who are main co-ordinators, making value contributions to success in Master course and Iwould like to thank the CoMEM Mariette who help me improve Englishwriting skill, [ would like to thank my wife, my family and my colleagues for
<small>their continuous encourages.</small>
1 would like to express deep thanks to KC.09.16/11-15 state projectnamely “Research, identification scientific arguments and proposal of PhuQuốc — Con Dao marine spatial planning for sustainable development”(Assoc. Prof. Dr. Pham Quy Nhan is the Project Manager) that I am joining tobecause of its funding
Finally I would like to thank NICHE VNM-106 project (funded by
<small>NUFFIC) for finance supporting and facilities for studying process.</small>
Ha Noi, date August 2015
<small>Bui Duc Toan</small>
</div><span class="text_page_counter">Trang 7</span><div class="page_container" data-page="7"><small>TABLE OF CONTENT</small>
<small>CHAPTER 1: INTRODUCTION1.1 Background.</small>
<small>1.2 Problem statements</small>
<small>1.3 Objectives and Research questions.1.4 Methods:</small>
<small>15 Structure of the thesis</small>
<small>CHAPTER 2: LITERATURE REVIEW</small>
2.1 The studies on Mekong Delta of foreign authors <small>182.2 The related researches on the lower downstream of Sai Gon-Dong Nai riverbasin</small>
<small>2.3 Overview of hvdrodynamic models2.3.1 Possible models</small>
<small>2.3.2 Selection criteria...2.4 Overview of MIKE 21</small>
<small>2627CHAPTER 3: ANALYSIS IMPACTS OF THE VUNG TAU - GO CONG SEADYKE ON HYDRODYNAMIC REGIME,</small>
<small>3.1 Governing equation.3.2 Model setting</small>
<small>3.2.1 Study area3.2.2 Bathymetty.</small>
<small>2929363637</small>
</div><span class="text_page_counter">Trang 8</span><div class="page_container" data-page="8">3.2.4 Water level boundaries
<small>3.2.5 River boundaries.</small>
<small>5.3 Model calibration and validation</small>
<small>3.3.1 Mode calibration3.3.2 Model validation3.4 Application</small>
<small>3.5 Results and discussions</small>
<small>6668</small>
</div><span class="text_page_counter">Trang 9</span><div class="page_container" data-page="9"><small>LIST OF FIGURES</small>
Figure 1-1. Vung Tau- Go Cong Sea dike project (Souree: Google Earth 2010)...10
<small>Figure 1-2. Sai Gon - Dong Nai river basin 12Figure 1-3, Map showing the Vung Tau Go Cong sea dike project (Source: Son (2012) .15</small>
<small>Figure 2-1. Overview of the station net realized during the cruise in April 2007....20Figure 2-2. Southeastern region (Source: Trinh (2007) 2</small>
Figure 2-3, Research area in Go Cong, Kien Giang province (Source: Hung (201 1)...22
Figure 3-2. Study area and bathymetry of computational domain. _
<small>Figure 3-3, Locations of river boundaries and sea boundaries 39</small>
Figure 3-4, Hydrographs at river boundaries. 40
<small>Figure 3-5. Model calibration: Comparison between simulated and measured water</small>
mÙ3, 17/10/2000 01:00-20/10/2000 01:00) ...43
<small>level at Vung Tau gauge station (ME</small>
Figure 3-6, Surface elevation in model calibration, 17/10/2000 01:00-20/10/2000
<small>01:00 (let hand-flood tide; right hand-ebb tide) 4s</small>
Figure 3-7, Current speed in model calibration, 17/10/2000 01:00-20/10/2000 01:00
<small>(left hand-flood tides right hand-ebb tide), 44Figure 3-8, Model validation: Comparison between simulated and measured waterlevel at Vung Tau gauge station ( 21/10/2000 01:00-24/10/2000 01:00), 46Figure 3-9, Surface elevation in model validation (left hand-flood tide; right hand-</small>
ebb tide. « ¬1. so sow AT
<small>Figure 3-10. Current speed in model validation (lft hand-lood tide; right hand-ebb tide)aFigure 3-11. Computational domain in the second scenario, with sea dike 48</small>
</div><span class="text_page_counter">Trang 10</span><div class="page_container" data-page="10"><small>Figure 3-13Figure 3-14</small>
<small>Figure 3-15</small>
<small>Figure 3-16Figure 3-17Figure 3-18Figure 3-19</small>
<small>Figure 3-20Figure 3.21</small>
Figure 3-22
<small>Figure 3.23,Figure 3-24,</small>
<small>Figure 3-25Figure 3-26,</small>
Surface elevation at ebb tide, 10/20/2000 04:00, first scenario
<small>Surface elevation at ebb tide, 10/20/2000 04:00, second scenario</small>
Surface elevation at flood tide, 10/21/2000 17:00, first scenario
<small>‘Surface elevation at flood tide, 10/21/2000 17:00, second scenario.Comparison water level elevation between two scenarios at PI-P4.</small>
Comparison water level elevation between two scenarios at P5-P8.
<small>Comparison water elevation between inside and outside reservoir ,</small>
Comparison water elevation between inside and outside reservoir,
<small>Current speed at ebb tide, 10/24/2000 02:00, first scenario,</small>
Current speed at ebb tide, 10/24/2000 02:00, second scenario
<small>Current speed at flood tide, 10/21/2000 17:00, first scenario.Current speed at flood tide, 10/21/2000 17:00, second scenario</small>
‘Comparison current between two scenarios at PI-P4.
<small>‘Comparison current between two scenarios at PS -P8</small>
<small>6061</small>
</div><span class="text_page_counter">Trang 11</span><div class="page_container" data-page="11"><small>Table 1-1Table 3-1‘Table 3-2.</small>
Table 3-3
<small>Table 3-4.Table 3-5Table 3-6,‘Table 3-7.</small>
<small>LIST OF TABLES</small>
<small>Distribution of annual monsoon</small>
Locations of river boundaries and Vung Tau gauge station.
<small>Results in Nash - Suteliffe coefficient.</small>
Parameters after model calibration.
<small>Design parameters of sea dike and sluice in the second scenario</small>
Locations of points to export results.
<small>Comparsion estreme watel level between two scenarios at P1-PS.‘Comparison extreme current speed between two scenarios at PI-P§</small>
<small>56“</small>
</div><span class="text_page_counter">Trang 12</span><div class="page_container" data-page="12"><small>1.1 Background</small>
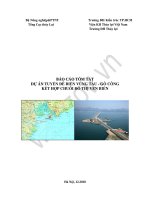
‘The downstream of the Dong Nai river and the Vam Co river covering,
10000 km” plays an important role in the society and the economy of Viet
Nam (Figure 1-1). This area includes Ho Chỉ Minh City, Dong Thap Muoi(belonging to Mekong Delta River), Vung Tau - Go Cong area and TienGiang, Long An province with dense populations and concentration ofbusiness as well as intensely agricultural productions
<small>Figure I-1. Vung Tau- Go Cong Sea dike project (Sour+ Google Earth 2010)</small>
The relative low elevation of this area in combination with the increasing,extraction of drinking water and the flooding problem from the effect of sealevel rise as well as salt intrusion are now of the primary concern of theseareas. The low-lying land area is located near the mouth of the large branchesof the Dong Nai and Vam Co River system (Figure 1-2) and therefore it is
</div><span class="text_page_counter">Trang 13</span><div class="page_container" data-page="13">strongly affected by the variation of the flow in the river and, an even moredominant factor, the tidal current, Large reservoirs have been built upstreamretaining the flood flow, leading to a decrease in the amount of average floodflow. Conversely the effect of the tidal current is increasingly higher,resulting in salt intrusion and a lack of fresh water. Human intervention in thisarea also diverts the direction of the flow and tidal current into the river,increasing water level at high tide and reducing water level at low tidecausing an increase in the tidal range in the river mouths. The higher the tidalranges, the more tidal energy, the less time tides need to transport from thesea to the river basin, The overall impact is that more areas are suffering fromtidal flooding, Moreover, the effect of the sea level rise will add to theseimpacts and make it more severe.
In short, in the present situation, the study area is located in acomplicated system of many estuaries which consist of intensive rivers andchannel networks therefore it is strongly affected by tide from the sea.Moreover this is a low land area therefore it is difficult for draining, Humanintervention including groundwater withdrawal and channel accretion havealso contributed to land subsidence and, even lowers the elevation of the areaIn other words, tidal influences and salt intrusion problems due to sea waterpenetrates are two main concems of this area.
</div><span class="text_page_counter">Trang 14</span><div class="page_container" data-page="14">Natural conditions
Wind regi
The study area is affected by two main direction of wind: Southwest‘monsoon and Northeast monsoon (Table 1-1)
Table 1-1. Distribution of annual monsoon
Dry season | ‘Transition ‘Wet season Dry season
<small>1| H |H| IV (V|VI VH|VH|IX|X XI XI</small>
NE monsoon | Transition ‘SW monsoon NE monsoon
</div><span class="text_page_counter">Trang 15</span><div class="page_container" data-page="15">The southwest monsoon often starts in May and lasts to the end ofSeptember. At offshore region, the main direction of wind is west with themaximum velocity of 10-12m/s. In coastal area, due to continent the maindirection of wind is Southwest and the average wind velocity and maximumwind velocity are 4-6 m/s and 8-10 n/s respectively.
The northeast monsoon often starts in September and lasts to the end ofMarch. At offshore region, the main wind direction is Northeast and averagewind velocity is 9-11 m/s, the maximum wind velocity is above 20 m/s. In thecoastal area, the main direction is Northeast and East, the average velocity
<small>and maximum velocity are 8-10 m/s and 12-14 mís respectively.</small>
Oceanic regime and sedimentation.
The study area is strongly affected by tide from the East sea, themonsoon as well as flow regime in the Mekong and Sai Gon ~ Dong Nairivers. The total flow includes tidal flow, ocean current, river flow and coastaldrift
The tidal regime is semi-diumal tidal, tidal range is 3.5-3.6m, The
<small>velocity of flood tide is 0.8-0.9 mls, up to 1.2 m’s and velocity of ebb tide is</small>
15-18 mis,
Respective to inconstant distribution of annual volume water, flowregime in Mekong and Sai Gon - Dong Nai rivers fluctuates following
seasons. For example, at Tan Chau station the discharge is up to 20.000 m‘/s
in wet season, meanwhile the discharge is 3.000 m’/s in dry season,
In wet season, the sediment content is higher than that in dry season. Thesedimentation in which rivers supply to sea is mostly in wet season,
Topography:
</div><span class="text_page_counter">Trang 16</span><div class="page_container" data-page="16"><small>40.8), the higt</small>
0.5) (Hung, 2011).
st elevation of (+1.3 - +1.4), the lowes elevation of (+0.4 —
Social ~ economic features
The economic advantages of the location:
- Near to East Sea, the southem key economic region (fishingexploitation, marine eco-tour, shipping industry).
<small>- Rich land resources with many types of land in which there is high</small>
<small>- Due to the availability of many hydraulic structures, surface water</small>
resources are not saline,
The disadvantages of the location
~ Low amount of rainfall, high evaporation.= No fresh ground water.
<small>~ Salt intrusion during the whole year.</small>
- The old dike is strongly eroded making it unsafe in wet season.
1.2 Problem statements
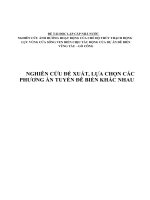
With the aim of solving the tidal flooding and salt intrusion (which arethe most important problems of the study area), the Ministry of Agricultureand Rural Development (MARD) has proposed to construct a 32 km longsystem dike connecting Go Cong and Vung Tau (Figure 1-3). The main goalsof the dike procject are:
= To prevent inundation and saltwater intrusion for the whole are in shortterm and long term;
- To improve the capacity for drainage water;
</div><span class="text_page_counter">Trang 17</span><div class="page_container" data-page="17">- To create fresh water reserves in the future for the region to preventany fluctuation in upstream and protec against the natural disaster from the
= To shorten the transport distance between provinces in the West toVung Tau, The system dike will connect Vung Tau with the Southwest,creating a driving force to form new urban areas;
- To develop tourism and make socio-economic development for the
<small>entire region;</small>
<small>- To offer places to storm shelter for ships.</small>
<small>Figure 1-3. Map showing the Vung Tau~ Go Cong sea dike project Source: Son (2012))</small>
However, the sea dike could also bring in many disdadvantagesregarding to the environment and navigation, Some consequences could bementioned:
- The Dong Tranh bay and Ganh Rai bay will become reservoirs torestore waste from uper stream;
- The change in tidal regime and salinity will destroy the ecologicalmangrove which is available from Soai Rap estuary to Long Tau estuary;
</div><span class="text_page_counter">Trang 18</span><div class="page_container" data-page="18">Long Tau and Thi Vai estuaries. Therefore deep water ports at these estuarieswould be influenced.
One of issues is the change in hydrodynamic flow regime in the area incase of having the project. The thesis, therefore will focus on how the dikeimpacts to the hydrodynamic flow in research site.
<small>1.3 Objectives and Research questions</small>
Objectives of the study are f0:
- Analyze the impacts of the Vung Tau - Go Cong sea dyke on
<small>hydrodynamic flow regime.</small>
- Assess the influence of hydrodynamic flow regime changes on thecoastal erosion in the study area,
‘The methods are applied in this research could be mentioned:
<small>= To analyze marine, meteorological, hydrological data in Go Cong</small>
Vung Tau area,
</div><span class="text_page_counter">Trang 19</span><div class="page_container" data-page="19">- To apply a mathematical model to simulate hydrodynamic flow in Go
<small>Cong — Vung Tau area.</small>
- To compare differences in the hydrodynamic flow regimes before andafter having sea dyke,
1.5 Structure of the thesis
“The thesis consists of three chapters.
‘The first chapter introduces background information, including:Locations; information of Meteorology, hydrology, topography; currentsituation; Problem statement; Objectives and research questions.
The second chapter reviews some researches, projects regarding toestuaries in Mekong delta and study area, Besides, over view abouthydrodynamic models are also presented.
‘The third chapter concluded: Governing equation; Model setting (usingMIKE 21 model) for study area: Setting up calculation grid and scenarios;setting up parameters of model; Model calibration/validation; Application;Result and discussions,
</div><span class="text_page_counter">Trang 20</span><div class="page_container" data-page="20"><small>2.1 The studies on Mekong Delta of foreign authors.</small>
In the continental shelf of Vietnam in general, coastal area from BinhThuan to Ca Mau in particular, some intemational surveys were conducted inwhich NAGA (1959-1961) with Stranger vessel belong to Scripps Institutionof Oceanography, California, NAGA programs finished 5 surveys. from11/1959 to 2/1961, from latitude 40N + 160N with 6 sections perpendicular toshoreline and out to offshore 250 nautical miles, depth = 400m (3895m). Thesurvey provided a large amount of raw data on the hydrodynamiccharacteristics, geology, biology, ecological-environment, contributing tofurther elucidate natural conditions in study area . The results of the surveywere published, the most significant of which was the work of | Wyrtki(1961). However, due to a large scale of survey and huge gap betweenstations, the results can only reflect the large- stable oceanographicprocesses,. According to Wyrtki (1961) pointed out that the entire East Seawas dominated by the monsoon regime, free laminar flow often had two‘opposite directions in seasons while major ocean currents did not flowed into.
In recent years, many studies have focused on the areas affected byfreshwater (Regions Of Fresh Water Influence-ROFI). A comprehensivesummary report on ROFI dynamics was presented in the article by Simpson(1996) that in most of ROFI there was a mixture between stratification effand stirring effect of wind, wave and tide, It is clear that this mixture isdifficult to determine than the thermal mixture, because the buoyancy of freshwater is not united in space but depending on separate inlet sources, Due tosuch complexity, Simpson said that the understanding of the system ROFIwas one of the biggest challenges that the oceanographers have faced today.
</div><span class="text_page_counter">Trang 21</span><div class="page_container" data-page="21">When river water flows into estuaries, itis affected by the Coriolis force,most of them dir is to Kelvin wave (in the northem hemisphere). ButSimpson proposed that this flow can be diverted by the prevailing wind.Another feature of the ROFI is under low friction conditions, buoyance drivenflow may express condition of baroclinic instabilities resulting in meanderingflow. However, in shallow water or areas with strong tidal current, bottomfriction often eliminates this uncertainty. Another important feature of theROFI is a distinct variation in vertical stratification which depends on tidalcycle. In this condition, the tidal deformation plays a crucial role. It could beproved that this feature may be caused by the difference between oblateellipse of tidal surface and tidal bottom layer (Carbajal et al., 2004). Simpsonalso mentioned the tropical ROFI in Mekong estuaries. According to Simpson,the sea shelf around Southeast Asia has to be interested because of the variationin fresh water flowing into sea by the monsoon cycle.
Hein et al. (2007) was initially studied the dispersion of water in Mekong,based on data field measurements in April/2007. Mekong River can be seenas a typical example for a region of freshwater Influence (ROFI). The shallowregion of the ROFI is defined by a great horizontal density gradient,characters the frontal zone in the ROFI. This zone also shows the region ofstrongest vertical mixing. The observations of a continuous station over 25hours pre ent the situation slightly off the shallow region of the ROFI. Theresults point out that the stirring effect of tides, ie. a complex variation ofvertical stratification during a tidal cycle. To conduct these measurementsaccurately it is important to invest in three-dimensional hydrodynamicsimulations, Modeling of hydrodynamics in a ROFI is obviously linked with agood concept of the frontal processes between two water masses and theirmixing. Some simple simulations of frontal behavior show the basic necessity
</div><span class="text_page_counter">Trang 22</span><div class="page_container" data-page="22">to improve the advection scheme of hydrodynamic models. The majorproblem is the numeric diffusion created by the algorithm of the advectionscheme. A basic one- dimensional model shows that an advection schemeusing a limiter function is able to simulate the interaction between theMekong discharge and the coastal water in a manner, that the diffusion andmoreover the mixing process in the model is controlled by physical processes.Altogether, the fundamental results of the ship experiments and the advectionscheme studies allow an implementation of a hydrodynamic model, whichapproaches the governing physical processes of the ROFI and theirvariability.
Figure 2-1. Overview of the station net realized during the eruisen Apri 2007
2.2 The related researches on the lower downstream of Sai Gon-Dong Nairb:
So far, researches related to flow regime in the lower downstream of SaiGon ~ Dong Nai river basin is limited. Some of the searches such as: Trinh(2007), Hung (2011), Linh et al. (2013) and Kim (2014) can be summerizedas follows:
</div><span class="text_page_counter">Trang 23</span><div class="page_container" data-page="23">‘Trinh (2007) conducted master thesis "Study on hydrodynamic regimeand environment in southeastern region". The author has clarifiedhydrodynamic regime in Southeast, i.e: Difference in water level betweenmonths (July and November) about 40cm and trend in rising sea level with0.5em / year speed period from 1979 to 2003; Complicated attribute of tideand magnitude of tide is quite high along the coast of Vietnam; Current speeddepended on season and direction its depended mainly on position; Waveregime rested on season, i.e: In winter (prevailing northeast monsoon) fromNovember to April, observed wave direction was northeast, the average waveheight of 1.25m and reached at maximum of 4m; Meanwhile in summer(prevailing southwest monsoon) from June to September, observed wavedirection was southwest, the average wave height was low and maximized to
<small>Figure 2-2. Southeastern region (Source: Trinh (2007)</small>
Hung (2011) conducted the research "study flow regime, sedimentdistribution in coastal area from Soai Rap estuary to Cua Tieu estuary,proposal solutions to prevent erosion at Go Cong dike in Tien Giang province
</div><span class="text_page_counter">Trang 24</span><div class="page_container" data-page="24">". One of the main tasks in this project is to find out the causes of coastalerosion by using computational model. The simulation results have identifiedthat natural factors were the main causes of coastal erosion in study area,including: (1) river flow and tide inlet at Soai Rap estuary; (2) waves duringnortheast monsoon, The drawback of this research is limited sediment inputdata at upper boundary, therefore results express more trend than quantity.Besides, the mathematical model used in the study did not consider the role ofmangroves in limiting coastal erosion
<small>Figure 2-3. Research area in Go Cong, Kien Giang province Source: Hung (2010)</small>
Linh et al. (2013) did a research on "Research on the impacts of GoCong Vung Tau sea dike on water quality at Saigon-Dong Nai estuary", Theauthor has presented research results of water quality changes in Saigon -Dong Nai estuary with the application of 3D numerical models, thehydrodynamic and water quality EFDC. The disadvantage of this article wasthat did not collect suffi it data about waste discharge sources in basin,
</div><span class="text_page_counter">Trang 25</span><div class="page_container" data-page="25">therefore water quality in reality could be worse than simulated modelresults.. On the other hand the model has just simulated water quality in floodseason, dry season when this region has run the risk of being polluted, has notbeen concerned,
Kim (2014) has done a research on “Study about the integrated solutions,for controlling inundation and salt intrusion in the lower of Dong Nai - SaiGon basin and adjacent to areas”. The main contents of the project include: 1)Calculation in features of designed meteorology-hydrology (flood, rainfalland tide) to identify boundary conditions of hydraulic system; 2) Assessmentand revision to effectiveness of solutions for controlling inundation accordingto approved planning for preventing inundation in HCM city; 3) Evaluationthe ability of controling flood in whole river basin in the context of climatechange/tising sea level in the long term (30 years, 50 years and 100 years); 4)Prediction for changes in hydrodynamic regime and water quality inreservoirs and main river system. In order to answer the question should orshould not we build the systems of Go Cong ~ Vung sea dike, Ministry ofScience and Technology proposed a group of six projects conceming to theimpacts of super sea dyke on hydrodynamic regime, navigation, ecologicalmangrove, environment and socio-economic developments in Go Cong —Vung Tau area. The project which is conducted by Professor.Dr. NguyenQuang Kim is a key esearch to provide database data for five other proj
2.3 Overview of hydrodynamic models
To understand deeply what issues relating to a system, researchers coulddo a field trip and measure. This is called monitoring. Monitoring is notalways feasible due to it is expensive. Moreover the researchers cannot notcontrol the direction or the magnitude of the boundary conditions for the
</div><span class="text_page_counter">Trang 26</span><div class="page_container" data-page="26">There are two methods of modeling: 1) Physical and 2) Numerical.
Physical modeling is a scaled model which is built in the laboratory torepresent the prototype. When the physical model is built, the modelerimposes the boundary conditions and records the model response, e.g. waveheight. Some advantages of physical modeling are: Good visualization;Freedom from instability issues; However, there are still some drawbacks ofphysical modeling including: High setup and operating cost; Physical space
Numerical modeling is numerical simulation of the governingphenomena based on the solution of mathematical equations that approximatethe physical conservation laws. Computational Fluid Dynamics, CFD in brief,has been started in the 1940s and has been improved each year. A typicalCED application contains three major steps: pre-processing, processing andpos processing. Pre-processing covers procedures that modelers take to set upa model, such as grid generation and making boundary conditions. Processingincludes the act of running the simulation, Post processing involvesvisualization of results plus calculating other parameters of interest. Keep inmind that numerical models solve the gorverning partial differental equationsas algebral equations with values at dicrete points; therefore the results are notcontinous. Some advantages of numerical modeling could be mentioned:
<small>Low</small> up and operation costs; convenience in changing the geometry;
<small>Ability to make simultaneous runs. In cor</small> strast, disadvantages of numericalmodeling could be: Poor visualization capability for non-professinal audience;Computational limitations, for example truncation errors in the mathematicalformulation.
</div><span class="text_page_counter">Trang 27</span><div class="page_container" data-page="27">Numerical model can be one, two or three dimensional depending onwhich variations in dependent varialbe ‘more important. For instance, thecase of modeling flow in a river, the water level along the canal is moreimportant than across the channel. Obviously the gauge height might not beconstant across a cross-section especially on a bend, but the I-D informationis enough to solve many problems. Two dimensional model to slove thegorverning equations in both x and y directions. For instance, in the case ofmodeling a lake, a 1-D model cannot show the spatial variability in the flowwhile a 2-D model work for many interested parameters. Three dimensionalmodels have the capability to solve equations in x,y and z direction. Forexample, if vertical salinity distribution through the water column in a lake isof concern then a 3-D model will be used (Sina, 2014).
2.3.1 Possible models
After reviewing several available models, three models were selected forfurther consideration. The Delft3D was developed by the Deltares Academy;MIKE 3 and MIKE 21 were developed by DHI Water and Environments. Oneof these models will be chosen in this thesis
a. Delfi3D
Delft 3D is able to model hydraulics, sediment transport, water quality,waves and morphology. It uses a structured curvilinear orthogonal grid.Delf3D supports wetting and drying simulation making it powerful model forflooding simulations. Delft 3D has powerful pre-processing and post-
<small>processing tools</small>
This model could apply for:
~ River flow simulations
</div><span class="text_page_counter">Trang 28</span><div class="page_container" data-page="28">- Fresh- water river discharge in bays
Salt intrusion
<small>- Transport of dissolved material and pollutants,</small>
<small>~ Wave ~ driven currents (WL/Delft, 2009)</small>
b, MIKE 3
MIKE 3 is a computer program that simulates cohesive sediments, flows,water quality and ecology in lakes, rivers, bays, coatal areas and sea in threedimentions. MIKE 3 was developed by Danish Hydraulic Institue (DHD)Water & Environment (Denmark). MIKE 3 is a fully 3D model and solves the
<small>momentum equation and continuity equations in the three Cartesian directions</small>
(DHL, 2007).
<small>& MIKE 21</small>
The model was developed by Danish Hydraulic Institue (DHI) Water &Environment (Denmark) in which rectangular mesh transforming to flexiblemesh based on fi le volume method. An unstructured grid provides anoptimal degree of flexibility in the presentation of complex geometries andenables smooth representation of boundaries. Small elements are used in areaswhere more detail is desired, optimizing information for a given amount ofcomputational time. Moreover MIKE 21 model could simulate the mutualinteraction between waves and currents using a dynamic coupling between theHydrodynamic Module and the Spectral Wave Module (DHI, 2007)
</div><span class="text_page_counter">Trang 29</span><div class="page_container" data-page="29">2) Be freely or inexpensively available to non-commercial researchers
A selected model would preferably:
1) Have unstructured grid to be able of capturing complex geometry2) Be able to run in parallel
3) Be easy to work with
4) Be easy to show the results
5) Have pre-processing and post processing capabilites included
‘The advantages of Dell3D and MIKE 3 models are the acuracy ofresults, however they require complex input data, Meanwhile, MIKE 21requires simple input data, it is user-frienly and fexible to show resultsMoreover it also satisfies the requirements of this thesis. Therefore MIKE 21will be chosen to study in this research,
2.4 Overview of MIKE 21
MIKE 21 is one of the most effective tools for coastal modelling in theWorld. This model could apply for: Design data for coastal and offshorestructures; Desalination and recirculation analysis; Environmental impactassessment of marine infrastructure, etc...Some simulation engines are usedin MIKE 21, including: Single grid; Multiple grids and flexible mesh, MIKE21 integrates many modules that could be mentioned:
HD- Hydrodynamics: Simulating water level variations and flows inresponse to a variety of forcing functions.
SW- Spectral waves: Simulating the growth, decay and transformation
<small>of wind generated waves and swell</small>
</div><span class="text_page_counter">Trang 30</span><div class="page_container" data-page="30">AD-Advetion dispersion: Simulating the transport, dispersion and decayof dissolved or suspended substances.
In order to simulate this research, two kinds of MIKE module could bechosen: MIKE 21 HD and MIKE 21 HD FM (FM, in brief of Flexible Mesh).MIKE 21 HD module uses rectangular grid meanwhile MIKE 21 HD FM usestriangular grid. Because esturies are not usually rectangles, it is so difficult topresent the boundaries of the estuary with a rectangular grid. The advantageof a triangular grid is that it is more flexible in the presentation of the mesh,because the mesh can be locally refined. In this research, the boundary ofrivers is complex, with advantage of a triangular grid, as a result MIKE 21HD FM module will be used (DHI, 2007).
</div><span class="text_page_counter">Trang 31</span><div class="page_container" data-page="31">CHAPTER 3: ANALYSIS IMPACTS OF THE VUNG TAU - GO CO!
<small>SEA DYKE ON HYDRODYNAMIC REGIME</small>
In previous chapter, a wide range of numerical models which are appicablefor the problem have been reviewed. Finally, MIKE 21 HD FM has beenselected. This chapter will present the appication of chosen model to investigatethe impacts of the Vung Tau ~ Go Cong sea dyke on the hydrodynamic regimewith two scenarios of pre- and poste- project. The contents of this chapterconsist of the gorverning equation; the model setting such as computationaldomain, unstructured mesh generation, boudary condions, parameter setting;model calibration/validation; appication; result and discussions for the twoscenarios with and without project.
ST 4 8 42 tap y4 2 ur y+ ms a
by py ôn cấy ax OT) py ND
</div><span class="text_page_counter">Trang 32</span><div class="page_container" data-page="32"><small>+ Time(s)</small>
x,y Cartesian co-ordinated in horizontal plane (m)
Magnitude of discharge due to point source
+ Water level above reference plane (m)
hh Total water depth, f= d+ 9 (m)
d Depthbelow plane of reference (m)
u,v Averaged depth velocity regarding to x, y direction (m/s)
T,,.T,„.T,, The lateral stresses, estimated using an eddy viscosity
Su Sey Sy Syy Radian stresses
tus ¥; Velocity due to point source (m/s)
<small>The discretization in solution domain is performed using a finite volume</small>
method. The spatial domain is discretized by subdivision of the continuum intonon-overlapping cells/elements. In the two-dimensional case the elements can bearbitrarily shaped polygons, however, here only triangles and quadrilateralelements are considered. In the three-dimensional case a layered mesh is used:
</div><span class="text_page_counter">Trang 33</span><div class="page_container" data-page="33">in the horizontal domain an unstructured mesh is used while in the verticaldomain a structured discretization is used. The elements can be prisms or bricks(hexahedrals) whose horizontal faces are triangles and quadrilateral elements,respectively. The elements are perfectly vertical and all layers have identicaltopology.
The integral form of the system of shallow water equations can in generalform be written
lu 0
<small>x30 45] E? =lgaoŸfi’ +5 20h -a°)| RY = hac</small>
đu ay.
Oy ax
|ua:
</div><span class="text_page_counter">Trang 34</span><div class="page_container" data-page="34">Pili F
<small>tebis’ +08 a)</small>
</div><span class="text_page_counter">Trang 35</span><div class="page_container" data-page="35"><small>¬-—+3 #0Ẻ<4 | Fy</small>
gn
Od, iy OP. sh py OD gL Su, Pw
ox So ax sac PO ay?
ad hap, gh pp, 1, , ,,o = fit -— Pe SX fv Pd, — (¢
My ep, Oy ha... Ox” By
Intergrating over the ` cell and using Gauss’s theorem to rewrite the flux
</div><span class="text_page_counter">Trang 36</span><div class="page_container" data-page="36">a 1à
<small>4S FnAF.</small>
<small>Here U, and S;, respectively are average values of and S over the ith cell</small>
and stored at the cell centre, NS is the number of sides of the cell, mị is the unit
‘outward normal vector at the / cell and AT; the length/area of the /* interface,
Both a first order and a second order scheme can be applied for the spatialdiscretization.
For the 2D case an approximate Riemann solver is used to calculate theconvective fluxes at the interface of the cells. Using the Roe's scheme thedependent variables to the left and to the right of an interface have to beestimated, Second ~ order spatial accurary is achiedved by empoying a lineargradient-reconstruction technique, To avoid numerical oscillations a second‘order TVD slope limiter is used.
For the 3D case an approximate Riemann solver is used to calculate theconvective fluxes at the vertical interface of the cells (x’y'-plane). Using theRoe’s scheme the depedent variables to the left and to the right of an interfacehave to be estimated. Second-order spatial accurancy is achieved by employinga linear gradient- reconstruction technique. To avoid numerical oscillatios asecond order TVD slope limiter is used. The convective fluxes at the horizontalinterfaces (vertical line) are derived using first order upwinding for the loworder scheme. For the higher order scheme the fluxes are approximated by themean value of the fluxes calculated based on the cell values above and below theinterface for higher order scheme.
<small>Time integration</small>
Consider the general form of the equations
TT 90) 69)
</div><span class="text_page_counter">Trang 37</span><div class="page_container" data-page="37">For 2D simulations, there are two methods of time integration for both theshallow water equations and the transport equations: A low order method and ahigher order method. The low order method is a first order expicit Euler method
= GU)+G,(BU-G,U+G;U)+G, (U) G-12)
Where the ft and v subscripts refer to horizontal and vertical terms,respectively and the superscripts refer to invicid and viscous terms, respectively.‘As for 2D simulations, there is a lower order and a higher order time integrationmethod.
The low order method used for the 3D shallow water equations can written
Uy AMGW,HGW)=U ANG O,) @-13)
The horizontal terms are integrated using a first order explicit Euler methodand the vertical terms using a second order implicit trapezoidal rule. The higherorder method can be written
</div><span class="text_page_counter">Trang 38</span><div class="page_container" data-page="38"><small>1 1</small>
<small>cu; $86.26 UYU SMG,</small>foun *gA4G/(U2,2)56/(,))<U, + FM U,)
<small>j (-14)2= SAH(G.0,,)16/(0,))<U, FBG C2)</small>
The horizontal terms are integrated using a second order Runge Kuttamethod and the vertical terms using a second order implicit trapeziodal rule,
The low order method used for the 3D transpor equation can written as
MG! WU .)#G (U,))=U, + MGV, )* O16) (3-15)
<small>The horizontal terms and the vertical convective terms are integrated using</small>
a first order explicit Euler method and the vertical viscous terms are integratedusing a second order implicit trapezoidal rule. The higher order method can be
The horizontal terms and the vertical convective terms are integrated usinga second order Runge Kutta method and the vertical terms are integrated using asecond order implicit trapezoidal rule for the vertical terms
(DHI, 2007).
3.2 Model setting3.2.1 Study area
Based on the Vung Tau- Go Cong map and collected data of bathymetry\an area of interest was chosen, The computed domain is described as follow:
<small>Latitude: 1080000 — 1160000; Longtitude: 67000-70000. Figure 3.2 shows</small>
the area of study picked to generate the grid calculation.
</div>