analysis of the measurement and testing process capability for inspection measurement and test equipment at bosch vietnam co ltd
Bạn đang xem bản rút gọn của tài liệu. Xem và tải ngay bản đầy đủ của tài liệu tại đây (9.41 MB, 80 trang )
<span class="text_page_counter">Trang 1</span><div class="page_container" data-page="1">
MINISTRY OF EDUCATION AND TRAINING
<b>HO CHI MINH CITY UNIVERSITY OF TECHNOLOGY AND EDUCATION FACULTY FOR HIGH QUALITY TRAINING </b>
<b> CAPSTONE PROJECT INDUSTRIAL MANAGEMENT</b>
<b>ANALYSIS OF THE MEASUREMENT AND TESTING PROCESS CAPABILITY FOR INSPECTION, MEASUREMENT, AND TEST EQUIPMENT AT BOSCH VIETNAM CO., LTD. </b>
<small>S K L 0 1 2 0 5 1 </small>
<b>Ho Chi Minh City, November 2023</b>
<b>LECTURER: MA. HUYNH ANH TUANSTUDENT: PHAM ANH LINH</b>
</div><span class="text_page_counter">Trang 2</span><div class="page_container" data-page="2">Student: Pham Anh Linh Student ID: 20124110
Major: Industrial management Advisor: MA. Huynh Anh Tuan
<i><b>Ho Chi Minh city, November 2023</b></i>
<b> HO CHI MINH CITY UNIVERSITY OF TECHNOLOGY AND EDUCATION </b>
</div><span class="text_page_counter">Trang 3</span><div class="page_container" data-page="3"><b> HO CHI MINH CITY UNIVERSITY OF TECHNOLOGY AND EDUCATION FACULTY OF ECONOMICS </b>
------
<b> THESIS </b>
<b>ANALYSIS OF THE MEASUREMENT AND TESTING PROCESS CAPABILITY FOR INSPECTION, MEASUREMENT, AND TEST EQUIPMENT AT BOSCH VIETNAM CO., LTD </b>
Student: Pham Anh Linh Student ID: 20124110
Major: Industrial management Advisor: MA. Huynh Anh Tuan
<i><b>Ho Chi Minh city, November 2023</b></i>
</div><span class="text_page_counter">Trang 4</span><div class="page_container" data-page="4"><b>HO CHI MINH CITY UNIVERSITY OF TECHNOLOGY AND EDUCATION FACULTY OF ECONOMICS </b>
</div><span class="text_page_counter">Trang 5</span><div class="page_container" data-page="5"><b>HO CHI MINH CITY UNIVERSITY OF TECHNOLOGY AND EDUCATION FACULTY OF ECONOMICS </b>
</div><span class="text_page_counter">Trang 6</span><div class="page_container" data-page="6"><b>HO CHI MINH CITY OF UNIVERSITY OF TECHNOLOGY AND EDUCATION FACULTY OF ECONOMICS </b>
<b>ACKNOWLEDGEMENT </b>
The author extends gratitude to the educators at the Faculty of Economics, Ho Chi Minh City University of Technology and Education for imparting invaluable knowledge during the years of academic engagement. The knowledge gained during the educational journey not only forms the foundation for the author's research but also equips them with valuable insights as they embark on a new professional journey.
Furthermore, the author wishes to express deep and heartfelt thanks to Dr. Huynh Anh Tuan, whose support, and wholehearted guidance were instrumental in successfully completing the Thesis.
In addition, the author acknowledges the Bosch Vietnam Co., Ltd. for their permission and facilitation of the author's practical experience within the company. Special appreciation is extended to the QMM6 department for their support and the conducive environment they created during the internship, which greatly contributed to the completion of the graduation thesis.
Recognizing the inherent limitations encountered during the thesis process, the author deeply values the constructive feedback received from the teachers, which played a pivotal role in refining the essay.
Sincere appreciation from the author.
<b><small>HCMC, 7/November/2023 Student name Pham Anh Linh </small></b>
</div><span class="text_page_counter">Trang 7</span><div class="page_container" data-page="7"><b>LIST OF ABBREVIATION Abbreviation EXPLANATION </b>
index
</div><span class="text_page_counter">Trang 8</span><div class="page_container" data-page="8"><b>LIST OF TABLE </b>
Table 2.1: GR&R Critera ... 19
Table 3.1: Types of MSA ... 26
Table 3.2: Results after evaluating MSA for Loop line ... 29
Table 3.3: Results after evaluating MSA for Element line ... 30
Table 3.4: Element defect mode at inspection machine ... 32
Table 3.5: Assess PM for MSA at the inspection machine ... 33
Table 3.6: MSA result ... 34
Table 3.7: Record NOK issues ... 35
Table 3.8: Case of PM release Inspection machine fail ... 37
Table 3.9: The ratio of factors influencing PM management... 40
Table 4 1: Team forming for digital web app project ... 47
Table 4.2: Timeline for digital web app project ... 48
Table 4.3: Saving time of digital web app project ... 54
Table 4.4: Team forming for Re-do MSA for all type of belt at Assembly line ... 55
Table 4.5: Data of MSA at Eddy Current track A ... 58
Table 4.6: Data of MSA at Eddy Current track B ... 58
Table 4.7: Data of MSA at AOI track A ... 59
Table 4.8: Data of MSA at AOI track B ... 59
Table 4.9: Data of MSA at Head filter track A ... 60
Table 4.10: Data of MSA at Head filter track B ... 60
Table 4.11: MSA results at assembly line 14 ... 61
</div><span class="text_page_counter">Trang 9</span><div class="page_container" data-page="9"><b>LIST OF FIGURE </b>
Figure 1.1: Some Bosch customers ... 4
Figure 1.2: Logo of Bosch Vietnam Co., Ltd ... 5
Figure 1.3: Bosch Long Thanh Factory ... 6
Figure 1.4: Plant organization ... 7
Figure 1.5: Company’s products ... 10
Figure 1.6: Pushbelt manufacturing process ... 10
Figure 1.7: Factors affecting the management of PM for the evaluation of MSA ... 40
Figure 2.1: Measurement system variations ... 16
Figure 2.2: Illustration of the definition of Stability ... 16
Figure 2.3: Illustration of the definition of Bias ... 17
Figure 2.4: Illustration of the definition of Linearity ... 17
Figure 2.5: Illustration of the definition of Repeatability ... 17
Figure 2.6: Illustration of the definition of Reproducibility ... 18
Figure 2.7: Example GR&R analysis ... 19
Figure 2.8: 5xWhys ... 21
Figure 2.9: Fishbone ... 22
Figure 2.10: Formula to calculate kappa ... 23
Figure 3.1: Calibration sticker ... 24
Figure 3.2: Types of MSA ... 25
Figure 3.3: The reassessment process for MSA ... 28
Figure 3.4: MSA results at Loop line in 2022 ... 30
Figure 3.5: MSA results at Element line in 2022 ... 31
Figure 3.6: MSA report accoding PM method ... 36
Figure 3.7: Warning: Abnormal PM element ... 38
Figure 3.8: Standard PM element storage box ... 38
Figure 3.9: Pareto chart of factors affecting the management of PM for the evaluation of MSA ... 41
Figure 3.10: Process of PM management system ... 42
Figure 4.1: Overall about PM system management ... 45
Figure 4.2: Tracking the project steps for the PM&DC web app... 49
</div><span class="text_page_counter">Trang 10</span><div class="page_container" data-page="10">Figure 4.3: PM & DC web app interface ... 51 Figure 4.4: PM & DC web app interface (Master data management) ... 51
</div><span class="text_page_counter">Trang 11</span><div class="page_container" data-page="11"><b>TABLE OF CONTENT ... viii </b>
<b>INTRODUCTION TO THE REPORT ... 1 </b>
<b>CHAPTER 1: OVERVIEW OF BOSCH VIET NAM CO. LTD ... 3 </b>
1.1. About Bosch Corporation ... 3
1.1.1. History and development of Bosch... 3
1.1.2. Overview of Bosch Vietnam Company Limited ... 4
1.1.3. Bosch's Product Range ... 4
1.2. Introduction of Bosch Vietnam Co., Ltd... 5
2.2.3. Types of MSA - Gauge R&R ... 18
2.2.4. when should MSA be applied ... 19
</div><span class="text_page_counter">Trang 12</span><div class="page_container" data-page="12">2.3. Some other concepts ... 20
3.1. Status of the measurement system at Bosch ... 24
3.1.1. Overall about measurement system ... 24
3.1.2. The role of conducting MSA for MTE at HcP ... 27
3.2. Status of MSA application at Bosch ... 27
3.2.1. At the Loop line ... 29
3.2.2. At the Element line ... 30
3.2.3. At the Assembly line ... 31
3.3. Assess the status of the measurement and testing process capability ... 42
3.4.1. Achievements ... 42
3.4.2. Limitations ... 43
<b>CHAPTER 4: PROPOSED SOLUTIONS FOR CAPACITY ASSESSMENT OF MEASUREMENT AND TESTING PROCESSES FOR INSPECTION, MEASUREMENT AND TESTING EQUIPMENT ... 45 </b>
4.1. Building the digital web app: PM and DC check ... 45
4.1.1. Motivation for the solution ... 45
4.1.2. Solution purposes ... 46
4.1.3. Contents of the solution ... 46
4.1.4. Benefits of the solution ... 52
4.2. Re-do MSA for all type of belt at Assembly line ... 55
</div><span class="text_page_counter">Trang 13</span><div class="page_container" data-page="13"><b>CONCLUSION ... 62 REFERENCES ... 63 APPENDIX... 1 </b>
</div><span class="text_page_counter">Trang 14</span><div class="page_container" data-page="14"><b>INTRODUCTION TO THE REPORT 1. Rationale </b>
Enhancing product quality is the most economically viable path and one of the crucial strategies to ensure the sustainable development of a business, especially in challenging economic times like today. The key to improving a company's competitiveness lies in finding ways to reduce costs to maintain the lowest possible product price while continuously striving for quality improvement to ensure that its goods and services achieve the highest quality. For large global corporations, to ensure increased production output, profit growth, waste reduction, and product quality assurance, manufacturers must focus on investing in quality assurance from the raw materials stage to the finished product. Additionally, ensuring the quality of Measurement and Testing Equipment (MTE) is essential for the automotive manufacturing sector, such as Bosch.
Through the learning process at the university as well as internships at Bosch's factories, the author understands the influence of MTE on production quality at production lines. Failure to control the long-term measurement and testing capacity of MTE can affect product quality and erode trust with customers.
Recognizing the importance of controlling the measurement and testing capacity of MTE and wanting to gain a better understanding of the significance of quality, the author decided to choose the topic: ANALYSIS OF THE MEASUREMENT AND TESTING PROCESS CAPABILITY FOR INSPECTION, MEASUREMENT, AND TEST EQUIPMENT AT BOSCH VIETNAM CO., LTD
<b>2. Objective </b>
Analyzing the current state of the MSA evaluation for MTE at Bosch Vietnam, and proposing solutions for implementing digitization in the management of SP elements and re-doing MSA inspection using Type 7 in Booklet 10 - internal documentation
<b>3. Scope and object </b>
<b>Object: The measurement and testing equipment inspection and measurement process </b>
<b>capability at QMM6 is achieved through the measurement system </b>
</div><span class="text_page_counter">Trang 15</span><div class="page_container" data-page="15">Information was collected from managers and engineers involved in MTE at QMM6
<b>Secondary data: </b>
- Data reported from departments in 2022, 2023 − Methods of synthesis and analysis. - Collect, synthesize, and analyze data from departments. Interview engineers involved in the project. Use analysis tools: Pareto, 5 Why...
<b>5. Structure of report </b>
The structure of the report consists of 4 chapters. Chapter 1: Overview of Bosch Viet Nam CO. LTD Chapter 2: Literature review
Chapter 3: Current status of the MTE measurement and testing capacity assessment process at Bosch
Chapter 4: Proposed solutions for capacity assessment of measurement and testing processes for inspection, measurement and testing equipment.
</div><span class="text_page_counter">Trang 16</span><div class="page_container" data-page="16"><b>CHAPTER 1: OVERVIEW OF BOSCH VIET NAM CO. LTD 1.1. About Bosch Corporation </b>
<i><b>1.1.1. History and development of Bosch </b></i>
The Bosch Group is one of the leading technology groups in the world with its headquarters in Gerling, Germany. The group was founded in November 1886 by Robert Bosch with the foundation of the “Precision Machanics and Electrical Engineering Workshop”.
In its early years, the Bosch Group achieved significant successes. Starting from as early as 1897, Bosch began manufacturing and developing electronic devices, clock ignition systems, and other industrial products. Robert Bosch consistently focused on quality and innovation, which propelled the company ahead of its competitive rivals.
By 1898, Bosch had conquered the international market by establishing its first business office on Store Street, London. The company continued to expand its operations to various countries worldwide. Bosch not only opens new production lines but also invests in research and technology development. This has resulted in the group maintaining a leading position in the industrial and technological sectors.
The 1950s and 1960s marked a period of strong growth for Bosch. During this time, the group has become one of the leading manufacturers of automotive technology and electronic systems, contributing significantly to the development of the global automotive and electronics industries.
From 1960 to 1980, Bosch underwent significant transformations as it developed into a diversified corporation. Lambda sensors, which detect the amount of oxygen present at the exhaust gas output of catalytic converters, were first produced by Bosch, which also held the top spot in the automotive electronics industry.
In 1978, Bosch introduced the Anti-Lock Braking System (ABS), a technology that became a standard and allowed drivers to maintain control over their vehicles during emergency braking. In 1987, Bosch further introduced the Traction Control System (TCS), which prevented wheel spin on slippery surfaces during acceleration. With the Electronic Stability Program (ESP) system, Bosch reached a technological milestone in 1995. ESP prevents wheel skidding and has sold millions of ESP brake systems since its introduction.
</div><span class="text_page_counter">Trang 17</span><div class="page_container" data-page="17"><i><b>1.1.2. Overview of Bosch Vietnam Company Limited </b></i>
Ho Chi Minh City became the home of Bosch's first representative office. With two branch offices in Hanoi and Da Nang as well as a powertrain factory in the province of Dong Nai that manufactures continuously variable transmission belts (CVTs) for automobiles, Bosch has increased its presence in Vietnam since 2007. Furthermore, Bosch maintains an R&D center in Ho Chi Minh City for enterprise solutions and technology, as well as one for automotive technology. In June 2022, the Center for Research and Development of Technology and Enterprise Solutions increased the scope of its activities in Hanoi.
Bosch reported consolidated revenue in Vietnam for the fiscal year 2021 of about 192 million euros. Bosch had more than 5,000 associates working for them as of December 31, 2021, and its business operations in Vietnam are diverse.
Currently, operations are carried out in this nation by the four Bosch business areas:
<b>Mobility Solutions, Industrial Technology, Consumer Goods, Energy Technology, and Construction. </b>
Figure 1.1: Some Bosch customers
<i>Source: Company website </i>
<i><b>1.1.3. Bosch's Product Range </b></i>
The company's operations are divided into four business sectors: - Mobility Solutions
- Industrial Technology
</div><span class="text_page_counter">Trang 18</span><div class="page_container" data-page="18">- Consumer Goods
- Energy and Building Technology
<b>1.2. Introduction of Bosch Vietnam Co., Ltd. </b>
- Company Name: Bosch Vietnam Co., Ltd.
- International Name: Bosch Viet Nam Company Limited - Tax Identification Number: 3603119522
- Address: Street No. 8, Long Thanh Industrial Zone, Tam An Commune, Long Thanh District, Dong Nai Province.
- Legal Representative: MAGANURU GURUMALLAIAH MALLIKARJUNA GURU
- License Issuance Date: 11/10/2001 - Commencement Date: 17/08/2001 - Phone: (061) 6280340
Figure 1.2: Logo of Bosch Vietnam Co., Ltd
<i>Source: Company website </i>
• Factory Area: 16,000 square meters
</div><span class="text_page_counter">Trang 19</span><div class="page_container" data-page="19">Bosch established its first representative office in Ho Chi Minh City. Since 2007, Bosch has expanded its operations in Vietnam with two branch offices in Hanoi and Da Nang, along with a manufacturing plant in Dong Nai Province that produces continuously variable transmissions (CVTs) for automobiles. Additionally, Bosch operates a Technology and Business Solutions Research and Development Center, as well as an Automotive Technology Research and Development Center in Ho Chi Minh City. The Technology and Business Solutions Research and Development Center expanded its operations to Hanoi in June 2022.
In the fiscal year 2021, Bosch recorded a total revenue of approximately 192 million euros in Vietnam. As of December 31, 2021, Bosch employed over 5,000 associates and had diverse business activities in Vietnam. Currently, all four business sectors of Bosch, including Mobility Solutions, Industrial Technology, Consumer Goods, and Energy and Building Technology, are operational in the country.
Bosch not only brings technological innovation but also establishes infrastructure and research centers in Vietnam, aiming to develop the automotive industry and provide top-quality technological solutions.
<i>Source: Company website </i>
</div><span class="text_page_counter">Trang 20</span><div class="page_container" data-page="20"><b>1.3. Organizational Structure </b>
<i><b>1.3.1. Factory Structure </b></i>
<i>Figure 1.4: Plant organization </i>
<i>Source: Human Resources Department </i>
Bosch organizes its company management based on a tightly-knit organizational structure, including management roles and departments, to ensure effective coordination and management. This organizational structure is divided into two main blocks: the office block and the production block, all under the management and coordination of the Plant Manager.
The Plant Manager plays a crucial role in overseeing the company's entire operations. The Commercial Director also holds a significant role in managing the company's business activities.
The departments and divisions within the company include:
- HcP/CTG (Control Operations Department): Manages the company's budget and finances.
- HcP/ICO (Organization and Information Coordination Department): Handles information security issues, supports software installations on the company's systems.
</div><span class="text_page_counter">Trang 21</span><div class="page_container" data-page="21">- HcP/LOG (Logistics Management Department): Manages inventory, incoming and outgoing raw materials, and the quantity of products delivered to customers.
- HcP/TGA (Technical Training Center): Provides technical training programs to supply young, dynamic, and innovative internal workforce.
- HcP/HRL (Human Resources Department): Responsible for training, recruitment, compensation, and benefits for employees.
- HcP/FCM (Facility Management Department): Manages equipment and facilities to ensure they are well-maintained to serve the employees' needs.
- HcP/HSE (Health, Safety, and Environment Department): Responsible for plant safety, organizes safety training for employees before entering the production lines.
- PS/QMM (Quality and Methods Department): Ensures product quality through training in methods such as SPC, FMEA, and maintains customer satisfaction through internal checks and IATF certification.
- PS CT/ETC (Communication Technology Center): Partners in developing testing techniques, supports existing products in communication technology for Bosch Vietnam Global South and Bosch. Responsible for planning and executing testing plans and analyzing results. Tests include: factors, product loop support, document control, risk assessment, technical changes, and 8D on existing products.
- HcP/MSE1 (Manufacturing Department): Responsible for producing components.
- HcP/PRS (Security Department): Manages the overall security of the plant, provides registration procedures and documentation when external partners enter the plant for filming, photography, and assists in card issuance along with other related documents.
</div><span class="text_page_counter">Trang 22</span><div class="page_container" data-page="22">Bosch's organizational structure builds a clear management framework and divides clear responsibilities among departments and divisions to ensure the smooth and efficient operation of the entire company.
<i><b>1.3.2. Structure and functions of quality management departments </b></i>
Currently, the HcP plant has divided the Quality Management department into 4 main sections:
The Quality and Methods Department (PS/QMM-HcP) consists of 5 groups with different functions in controlling and managing quality standards throughout the plant and the IATF 16949:2016 system. The groups are named with job titles and have specific roles as follows:
PS/QMM1-HcP: Responsible for quality control with customers like Punch, Jatco, Hyundai, etc. This group maintains continuous communication with customers to record any notifications or complaints about products. They handle complaints from Bosch customers and other parties related to the products and services provided by the company. PS/QMM3-HcP: Responsible for ensuring quality processes. They monitor performance and resolve issues in the production and distribution process, coordinating with the production department to address process-related problems causing defective products at various work stages.
PS/QMM6-HcP: Conducts measurements and analysis of chemical experiments related to products. Measures metal and welding processes. Inspects belts, performs calibrations, and measurements as per guidelines used for belt production.
PS/QMM7-HcP: Manage quality management system processes, guide internal inspection procedures, and check the IATF 16949:2016 quality system. They support quality management methods (FMEA, SPC, problem-solving, etc.).
PQA-HcP: Responsible for inspecting the quality of purchased items from suppliers. Ensures that suppliers adhere to Bosch's quality standards in providing materials used for belt production at the factory.
</div><span class="text_page_counter">Trang 23</span><div class="page_container" data-page="23"><b>1.4. Product </b>
The company's main product is the Pushbelt. The Pushbelt is a crucial component that constitutes the continuously variable transmission (CVT) automatic gearbox. Without the Pushbelt, or if the Pushbelt is damaged, the vehicle won't be able to run. The Pushbelt allows for the continuous transfer of power from the engine to the wheels. Through this mechanism, the engine maintains operation at an optimal state, thereby reducing fuel consumption, enabling rapid acceleration, and minimizing noise.
The Pushbelt is made up of hundreds of individual steel components (referred to as Elements) that are specially designed to interconnect and form a chain, which is then attached along two sets of high-strength steel alloy rings (referred to as Loops). This unique structure makes the Pushbelt extremely flexible and durable.
Figure 1.5: Company’s products
<i>Source: Company website </i>
Figure 1.6: Pushbelt manufacturing process
<i>Source: Author </i>
</div><span class="text_page_counter">Trang 24</span><div class="page_container" data-page="24">To create a Pushbelt, two components are needed: Elements and Loopset.
Element Structure: Elements come in two main types: Normal Elements and Filling Elements. These types differ in size. Typically, Normal Elements are assembled onto the Loop first, and any remaining gaps are filled with Filling Elements.
Loop Structure: Loops are manufactured in various sizes and are then assembled together to form a Loopset. The number of Loops in each type of Loopset depends on the type of Pushbelt product being produced by the plant.
Currently, the Loop production line has three different types:
<i>Conventional Line: This is the regular Loop production line that utilizes technology </i>
prior to 2010. It involves more manual labor, lower precision, and a higher rate of defective products.
<i>GU Line: This is a high-quality Loop production line that was installed after 2014. It </i>
incorporates advanced machinery and automated error control systems via computers. It requires fewer manual laborers compared to the Conventional Line. However, due to the new machinery, engineers lacked experience in handling and controlling errors initially. Currently, the plant is operating GU Lines numbered 10 and 11.
<i>GU Light: Line number 9 is a combination of the GU and Conventional lines. </i>
<b>1.5. Development direction </b>
The ultimate strategic goal of the Bosch Group is to create groundbreaking solutions for a connected life, applying technology to transform and enhance society. In all the products and services that Bosch provides, their mission is consistently conveyed through a powerful slogan: "Invented for Life."
For Bosch, sustainability is not just about ensuring the long-term success of the company, but also involves safeguarding natural resources for future generations. The group continually strives to make renewable energy more popular, safer, cleaner, and more efficient, while also developing environmentally friendly products.
Bosch is committed to delivering innovative solutions, aiming for a sustainable and proactive future, alongside society and the world, in the endeavor to create a better living environment. The company reshapes life through innovation and creativity,
</div><span class="text_page_counter">Trang 25</span><div class="page_container" data-page="25">driving progress and prosperity for everyone, while also providing comprehensive benefits for both people and our planet.
</div><span class="text_page_counter">Trang 26</span><div class="page_container" data-page="26"><b>CHAPTER 2: LITERATURE REVIEW 2.1. Measurement </b>
According to AIAG (2010), measurement is formally defined as the process of attributing numerical values to tangible objects to depict their interrelationships concerning specific characteristics or attributes. This definition highlights the fundamental role of measurement in quantifying and understanding the attributes of physical properties, which are essential in fields such as science, engineering, quality control, and analysis. Furthermore, measurement is also defined as "the assignment of numbers (or values) to material things to represent the relations among them with respect to particular properties" (Eisenhart, 1963, p.21 ).
Rabinovich (2006) points out that measurement is the process of determining the value of a physical quantity using specialized technical tools known as measuring instruments. These measuring instruments are essential for quantifying the characteristics of objects, emphasizing their critical role in the measurement process. The result of a measurement is a numerical value with a unit that specifically matches the measured property, representing the true outcome of the measurement.
The provided definitions emphasize three important aspects of measurement:
• A measurement result must always be a specific numerical value expressed in approved units of measurement. Essentially, the goal of measurement is to convey an object's characteristics through numbers.
• Measurement instruments are always necessary for all measurements; they are essential.
• Measurement always follows a systematic approach to ensure reliable results. To sum up, Measurement is the process of assigning numerical values, typically in specific units, to describe and understand the attributes or properties of physical objects. It involves the use of specialized measuring instruments and follows a systematic approach to ensure reliable results. In essence, measurement quantifies the characteristics of objects by representing them with numbers and units.
</div><span class="text_page_counter">Trang 27</span><div class="page_container" data-page="27"><b>2.2. Measurement system </b>
Senvar and Firat (2010) showed that measurement system is a comprehensive assembly encompassing measuring instruments, operators or appraisers, varying conditions or time points for instrument use, the measurement environment, standards, procedures, methods for setup and measurement, locating and orienting tooling and fixtures, intermediate calculation software, and underlying assumptions used to quantify units of measure or the entire measurement process. The primary objective of a measurement system is to differentiate one component from another.
Potter (1996) emphasizes that measurement systems should never be used “as is” when they arrive from the supplier, nor should the vendor’s published values for accuracy be accepted without verification as the accuracy that will be experienced in a production environment.
Otherwise, according to Gupta (2004) measurement system encompasses instruments, standards, methods, fixtures, software, personnel, environmental factors, and underlying assumptions used to quantify a unit of measure or assess the characteristics of a measured feature. It represents the entire process for obtaining measurements.
To wrap it up, Measurement systems are complex assemblies involving various components such as instruments, operators, environmental factors, standards, and software. Their primary purpose is to distinguish one component from another. It’s important not to use these systems exactly as they are or to take the accuracy values supplied by suppliers at face value without checking them. Measurement systems, which represent the entire process of obtaining measurements, essentially include everything required to quantify units of measure or assess measured features.
<b>2.2. Measurement system analysis </b>
<i><b>2.2.1. Definition </b></i>
Van Wieringen and De Mast (2008) state that Measurement Systems Analysis (MSA) is the process of thoroughly assessing a measurement process, frequently through experiments, to pinpoint and quantify sources of bias and variation. Measurement and data collection procedures can introduce errors and variability, just as manufacturing processes
</div><span class="text_page_counter">Trang 28</span><div class="page_container" data-page="28">can change and affect the quality of the product. Measurement systems are evaluated by MSA to make sure they are appropriate for the purposes intended.
Gage Repeatability and Reproducibility (Gage R&R) (Iyer, 2010; Gupta, 2004) is the term used to describe MSA. It is an essential method for assessing the accuracy and consistency of any system that measures parts or specimens. Any measurement technique can use this assessment to pinpoint and attribute the sources of variability. The degree of detail required for the measurement itself must not be met by the precision of the measuring apparatus.
According to Al-Qudah (2017), MSA is a useful technique for addressing doubts about the dependability of measurement systems through system qualification. It entails computing errors related to stability, accuracy, and precision. By doing this, MSA offers a way to recognize and lessen the impact of these errors in the measurement systems on overall variability.
According to Ramu (2016), MSA was mostly used in measurement laboratories before the early 1990s, and it was largely unknown in industrial settings. However, the automotive industry saw a major change with the introduction of the QS-9000 standard, which is now ISO/TS 16949. This significant event increased awareness of the value of MSA and expanded its application beyond the automotive industry to a variety of other industries. It emphasized how important MSA is to maintaining measurement accuracy and high-quality data.
Measurement systems analysis (MSA), commonly referred to as gauge repeatability and reproducibility (Gage R&R), is a crucial procedure that assesses the accuracy and
<i><b>consistency of measurement systems that are used to evaluate parts or specimens. </b></i>
<i><b>2.2.2. MSA terms </b></i>
The statistical study of measurement data variation resulting from bias, linearity, repeatability, accuracy, precision, stability, and repeatability is known as measurement systems analysis (MSA) (Ramu, 2016).
</div><span class="text_page_counter">Trang 29</span><div class="page_container" data-page="29">Figure 2.1: Measurement system variations
<i>Source: Yadav (2016) </i>
<b>Calibration: </b>
<b>Accuracy: proximity between a reference value and a measurement average. </b>
<b>Precision: It refers to the degree of agreement or consistency between multiple </b>
measurements taken under consistent conditions from the same system.
<b>Stability: It refers to the extent to which a system's stability can consistently maintain </b>
the same average value over prolonged durations, with minimal variation, and using the same gauge and appraiser to repeatedly assess the same component.
Figure 2.2: Illustration of the definition of Stability
<i>Source: AIAG (2010) </i>
<b>Bias: The difference between the absolute value and the actual value compared to the </b>
standard base value at different measuring points of the measuring range. In practice, accuracy and bias are often used interchangeably. Understanding bias during the Measure
</div><span class="text_page_counter">Trang 30</span><div class="page_container" data-page="30">phase helps process owners understand why equipment is inaccurate and may need to be corrected. Calibrate and adjust the deviation closer to the real value.
Figure 2.3: Illustration of the definition of Bias
<i>Source: AIAG (2010) </i>
<b>Linearity: It represents the evaluation of bias consistency throughout the measuring </b>
device's entire range. It involves examining the accuracy of measurements at different points within the equipment's measuring range.
Figure 2.4: Illustration of the definition of Linearity
<i>Source: Yadav (2016) </i>
<b>Repeatability: It refers to the variation observed in measurements when a single </b>
measuring instrument is used several times by an appraiser to assess identical characteristics of the same part. Examining repeatability in the Measure phase helps process owners determine if the equipment is suitable.
Figure 2.5: Illustration of the definition of Repeatability
<i>Source: AIAG (2010) </i>
</div><span class="text_page_counter">Trang 31</span><div class="page_container" data-page="31"><b>Reproducibility: It is the difference in the average value of measurements made by </b>
different appraisers, using the same equipment, while measuring identical characteristics of the same part. Considering reproducibility during the measure phase helps process owners understand the variability caused by human inconsistency in replicating measurements consistently from test-to-test other experience.
Figure 2.6: Illustration of the definition of Reproducibility
<i>Source: AIAG (2010) </i>
Accuracy, precision, stability, repeatability, reproducibility, linearity, and bias are essential factors for comprehending measurements and conducting various types of Measurement System Analysis (MSA).
<i><b>2.2.3. Types of MSA - Gauge R&R </b></i>
As stated of Iyer (2010), GRR, which stands for "repeatability and reproducibility," serves three key purposes:
(a) It helps us figure out how much of the overall variation in measurements is caused by the measuring tool itself.
(b) It allows us to break down and understand the various sources of variability in our system.
(c) It helps us determine if the measuring tool is suitable for its intended use.
The two "R's" in GRR show us whether the measuring tool consistently gives the same reading when we measure the same thing multiple times in ideal conditions (repeatability) and how much the measurements vary when different operators or time periods are involved (reproducibility).
For measurement systems intended for process analysis, the following general guidelines apply to assess the acceptability of the measurement system:
</div><span class="text_page_counter">Trang 32</span><div class="page_container" data-page="32">Table 2.1: GR&R Critera
<i>Source: AIAG (2010) </i>
Figure 2.7: Example GR&R analysis
<i>Source: AIAG (2010) </i>
<i><b>2.2.4. when should MSA be applied </b></i>
As stated by Gasper and Savage (2016), MSA is applied when: - Introduce new measurement system or equipment:
</div><span class="text_page_counter">Trang 33</span><div class="page_container" data-page="33">- When measurement systems/equipment are utilized for Statistical Process Control (SPC)
- For measurement systems/equipment used at critical decision points.
- Ensure consistency in measurement methods between you and your customers. - Promote consistency in measurement methods between you and your suppliers. - Maintain consistent measurement methods across different organizational locations. - Evaluate the measurement system before and after repair.
- Prevents deterioration of measurement accuracy. - Provide comprehensive training for new testers.
- Compare and evaluate two distinct testing methods. Assess the effects of changing environmental conditions.
<b>2.3. Some other concepts </b>
<i><b>2.3.1. Flowchart </b></i>
Edition (1990), a flowchart is a visual, graphic representation of a process or a series of connected activities from beginning to end. It allows for the step-by-step progression of events in a process for a product or service. By using standardized symbols, flowcharts make it easy to understand the process clearly.
To create a flowchart, follow these six steps:
Step 1: Start by defining the process and writing its title at the top of your workspace. Step 2: Determine the process's boundaries, including where it begins and ends, and decide on the level of detail to include.
Step 3: Brainstorm and list the activities involved, using cards or sticky notes. Step 4: Organize the activities in the correct sequence.
Step 5: Once all activities are in place and the sequence is agreed upon, connect them with arrows to indicate the process flow.
Step 6: Review the flowchart with others involved in the process, such as workers, supervisors, suppliers, and customers, to ensure accuracy and consensus.
</div><span class="text_page_counter">Trang 34</span><div class="page_container" data-page="34"><i><b>2.3.2. 5 times why </b></i>
According to Serrat (2017), the 5 Whys analysis technique is employed as a solving approach by repeatedly asking the question "Why?" in relation to the issue until the underlying root cause is identified. The act of posing this question encourages deep and systematic examination of the problem at hand.
problem-In order to maintain a systematic approach, three key factors need to be ensured: firstly, the problem presented must be described accurately and comprehensively; secondly, honesty should be maintained when responding to each "Why" question; and thirdly, the problem identified must be fully resolved after each stage of identification. It's worth noting that this technique was conceived and developed by Sakichi Toyoda (1867-1930) and has been effectively employed in the production processes of the Toyota Corporation.
Figure 2.8: 5xWhys
<i>Source: Taproot.com </i>
<i><b>2.3.3. Fishbone diagram </b></i>
<b>What is a fishbone diagram? </b>
Fishbone diagrams, also referred to as Ishikawa diagrams or cause-and-effect diagrams (Coccia, 2018, et al.), serve as a tool for pinpointing the underlying causes of a problem. Kaoru Ishikawa, a Japanese statistical quality control specialist, is credited with coining the term "Ishikawa chart" and popularizing its use in the 1960s. For example, fishbone diagrams are used to determine the causes of poor product quality. The primary factors contributing to this issue often stem from discrepancies in management aspects, technical processes, workforce, machinery, materials, and the working environment
</div><span class="text_page_counter">Trang 35</span><div class="page_container" data-page="35">Figure 2.9: Fishbone
<i>Source: Loredana (2017) </i>
<b>When to use a fishbone chart: </b>
Employ it when seeking to identify the root cause of a problem.
Use it when it's necessary to analyze potential causes for an ongoing issue.
<b>How to construct a fishbone chart: </b>
According to Ilie & Ciocoiu (2010), creating a comprehensive fishbone diagram involves seven key steps:
-
Define the problem.-
Describe the problem.-
Identify the primary and potential causes of the problem.-
Prioritize established criteria.-
Develop the fishbone chart.-
Analyze the chart.-
Have the chart approved by management and document it.<i><b>2.3.4. Pareto chart </b></i>
The Pareto chart is a valuable tool attributed to the economist Vilfredo Pareto, who observed that 80% of Italy's wealth was held by only 20% of the population (Berger, 2006
</div><span class="text_page_counter">Trang 36</span><div class="page_container" data-page="36">et al.). Studies have also indicated that 80% of a company's profits originate from 20% of its products, and 80% of customer complaints arise from 20% of its customers.
As explained by Berger and Hart (2020), the Pareto chart is alternatively known as the Pareto principle or the 80/20 principle, with the numbers reflecting this rule. The 80/20 Principle aids in recognizing and concentrating on roughly 20% of the factors responsible for approximately 80% of potential issues. This, in turn, facilitates the identification and prioritization of the critical issues, allowing for improvements and measures to reduce errors.
<i><b>2.3.5. Kappa </b></i>
According to Schnell (2020), the Kappa Statistic, also referred to as Cohen's Kappa, is a statistical metric used to assess inter-rater reliability, particularly for categorical variables. In essence, it is closely associated with and often used interchangeably with the concept of inter-rater reliability.
The test decisions are analyzed on pair-wise agreements of the individual ratings. The parameter [κ] (“Fleiss´ Kappa”) is used as a quantitative measure:
Figure 2.10: Formula to calculate kappa
<i>Source: Schnell </i>
</div><span class="text_page_counter">Trang 37</span><div class="page_container" data-page="37"><b>CHAPTER 3: CURRENT STATUS OF THE MTE MEASUREMENT AND TESTING CAPACITY ASSESSMENT PROCESS AT BOSCH </b>
<b>3.1. Status of the measurement system at Bosch </b>
<i><b>3.1.1. Overall about measurement system </b></i>
With many various types of MTE to support production, QMM6 currently has two main team responsible for ensuring the quality of MTE: Calibration team and Stability Check team.
<b>Stability Check team: </b>
-
Ensure that the measurement parameters of MTE do not deviate from standards based on regular testing activities for MTE with varying frequencies (every 3 days, 5 days, 1 week, etc., depending on the type of MTE). </div><span class="text_page_counter">Trang 38</span><div class="page_container" data-page="38">-
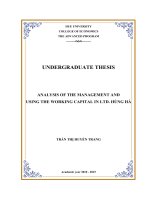
Carry out maintenance activities for MTE if there are malfunctions or if they are not functioning properly, based on information received from the production departments.For equipment that is newly released or relocated,... the Calibration team will conduct MSA (Measurement System Analysis) to ensure the stability and accuracy of the equipment, based on measurement characteristics. Bosch has established an MSA procedure with the following system:
Figure 3.2: Types of MSA
<i>Source: assets.bosch.com </i>
For MTE that can be quantified and measured using numerical values, the Measurement System Analysis (MSA) is conducted using procedures 1, 2, 3, 4, and 5. However, for MTE assessed based on the results as either "pass" or "fail", MSA will be conducted using procedures 6 and 7. Details of each procedure are described in the table below:
</div><span class="text_page_counter">Trang 39</span><div class="page_container" data-page="39">Table 3.1: Types of MSA
<small>Procedure 1: Systematic measurement error and repeatability </small>
<small>- Characteristic with tolerance (natural or defined lower and upper tolerance limit) </small>
<small>- Resolution of measurement equipment ≤ 5% of tolerance - Long-term stable master part (calibrated serial part or normal representative for characteristic) </small>
<b><small>Cg ≥ 1.33 and Cgk ≥ 1.33: measurement process is capable </small></b>
<small>Procedure 2: Repeatability & reproducibility with operator influence </small>
<small>- Process influenced by operator (handling, clamping, reading… - Procedure 1 has to be used </small>
<b><small>• %GRR ≤ 10%: measurement process is capable. </small></b>
<b><small>• 10% < %GRR ≤ 30%: measurement process is conditionally capable. • %GRR > 30%: measurement process is not capable. </small></b>
<small>Procedure 3: Repeatability & reproducibility without operator influence </small>
<small>- Process not influenced by operator (automatic handling, clamping, reading…) </small>
<small>- Procedure 1 has to be used </small>
<b><small>• %GRR ≤ 10%: measurement process is capable. </small></b>
<b><small>• 10% < %GRR ≤ 30%: measurement process is conditionally capable. </small></b>
<b><small>%GRR > 30%: measurement process is not capable. </small></b>
<small>Procedure 4: Linearity - Usually checked by equipment supplier and not required Maximal systematic deviation from reference ≤ 5%T: capable </small>
<small>Procedure 5: Stability (Long-term behavior of a measurement system) </small>
<small>- Cgk and %GRR capable, active maintenance plan for equipment X̅S-chart with values in upper and lower control limits </small>
<small>Procedure 6: Test decisions for discretized continuous characteristic </small>
<small>- Measurement of continuous reference values for all 50 parts • </small> <b><small>%GRR ≤ 10%: measurement process is capable. </small></b>
<b><small>• 10% < %GRR ≤ 30%: measurement process is conditionally capable. </small></b>
<b><small>%GRR > 30%: measurement process is not capable. </small></b>
<small>Procedure 7: Test decisions for discrete and discretized characteristics </small>
<small>- Reference standard </small>
<small>- Defined test process (test procedure, workplace setup and trained employees) </small>
<small>- Reference lot available </small>
<b><small>k ≥ 0.9: test process is capable. </small></b>
<b><small>0.9 > k ≥ 0.7: test process is conditionally capable. k < 0.7: test process is not capable. </small></b>
<i>Source: assets.bosch.com </i>
</div><span class="text_page_counter">Trang 40</span><div class="page_container" data-page="40"><i><b>3.1.2. The role of conducting MSA for MTE at HcP </b></i>
Quality Assurance: Measurement system accuracy and dependability in production processes are guaranteed by MSA. This is essential to preserving the consistency and quality of the product.
Process Validation: MSA confirms that the MTE apparatus is capable of precisely measuring the features and attributes of goods. Validating manufacturing processes requires this.
Data Integrity: It guarantees that the information gathered from MTE is reliable and suitable for use in process optimization, quality assurance, and decision-making.
Cost Reduction: MSA enables targeted improvements by identifying and quantifying sources of measurement variability, potentially reducing the need for expensive rework or excessive inspection.
Compliance: By proving the dependability of measurement systems, MSA assists HcP in adhering to industry standards and laws, such as IATF 16949.
Continuous Improvement: Any problems with the MTE can be found and fixed with MSA, which helps with continuous process improvement initiatives.
Risk Mitigation: By ensuring that the measurement equipment is operating accurately, it helps reduce the chance of producing defective products or components.
In summary, MSA for MTE at HcP plays a pivotal role in maintaining product quality, process validation, data integrity, cost reduction, compliance, continuous improvement, and risk mitigation.
<b>3.2. Status of MSA application at Bosch </b>
At Bosch, the QMM6 department analyzed and classified the list of equipment groups according to each MSA type to easily conduct MSA assessment as shown in Appendix 1, Appendix 2.
The reassessment process for MSA in relation to MTE:
</div>