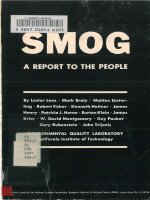
smog a report to the people 9 docx
Bạn đang xem bản rút gọn của tài liệu. Xem và tải ngay bản đầy đủ của tài liệu tại đây (6.26 MB, 174 trang )
A
REPORT
TO
THE
PEOPLE
By
Lester
Lees •
Mark
Braly
•
Mahlon
Easter-
ling
•
Robert
Fisher
•
Kenneth
Heitner
•
James
Henry·
Patricia
J.
Horne
•
Burton
Klein·
James
Krier
•
W.
David
Montgomery
•
Guy
Pauker
•
Gary
Rubenstein
•
John
Triionis
ENVIRONMENTAL QUALITY LABORATORY
~al;forn;a
InstItute
of
Technology
Supported in part by the National Science Foundation,
Research
Applied
to National
Needs
(RANN),
under
Grant
No.
GI-29726.
Copyright
© 1972 by California Institute
of
Technology
Library
of
Congress Catalog Card
Number
72-86498
Printed in the United States
oj
America
by
Anderson,
Ritchie
&
Simon,
Los
Angeles
Art
Director, Patricia
J.
Horne; Photography, Walt Mancini
CONTENTS
PAGE
Foreword .
11
PART
I.
EQL
STRATEGY
NO.
I-A
SUMMARY
15
III
Need for a New
Air
Pollution Strategy
in
the
South Coast
Air
Basin .
18
1/2
EQL
Strategy
No.1
1/2.1
General Features 20
II2.2
Specific Control Measures
21
A. Motor Vehicles .
23
B.
Stationar~,Sources
. 24
c. Phase
II
25
II3
A Glimpse
at
the Post 1982 Period and Long-Range Needs 30
PART
II.
SUPPORTING
INFORMATION
AND
ANALYSIS
31
IIll
A New
Air
Pollution Control Strategy for the
South Coast Air Basin . 34
III
1.1
The Present Control Strategy and its Deficiencies 34
III
1.2 Implications
of
the Clean
Air
Act
of
1970 for
Air
Pollution Control Strategy in the South Coast
Air
Basin.
37
II/l.3
Short-term (1972-1977) Objectives and Manage-
ment Air Quality Standards .
40
II/2
Effects of
EQL
Strategy
No.1
in Reducing Emissions and
Improving
Air
Quality.
46
II/2.1
Introduction.
46
II/2.2
Relations Between
Air
Quality and Emission Levels
46
II/2.3
Reductions in Emissions
in
the South Coast
Air
Basin (1972-1982)
51
III2.4
Projected Improvements in Air
Quality.
56
II/2.5
Lower Limits on Emissions and
on
the Average
Number
of
"Objectionable" Days
Per
Year.
58
III2.6
The Air Quality Problem for Sulfur Dioxide and
Particulate Matter . 59
5
PAGE
1113
Feasibility
of
Control Measures for Motor Vehicles. 64
III3
.1
Supply
and
Distribution
of
Gaseous
Fuels
.
64
11/3.2
Economics of Conversion to Gaseous Fuels. 67
11/3.3 Gaseous Fueled Vehicles: Safety and Insurance 72
11/3.4 Feasibility and Costs
of
Exhaust and Evaporative
Emissions Control Devices for Used Cars . 77
1114
EQL
Strategy
No.1
for Reductions in Emissions from
Stationary Sources . 84
11/4.1 Introduction. 84
11/4.2 Reductions in Reactive Hydrocarbon Emissions 84
11/4.3 Reduction
in
Oxides
of
Nitrogen Emissions 86
1115
Social and Economic Incentives and Disincentives
Designed to Reduce Emissions . 94
11/5.1 Introduction. 94
11/5.2 The Public Policy Issues. 95
11/5.3
The
Motor Vehicle Emissions
Tax
as an Air Pollu-
tion Control Measure 99
11/5.4 Export
of
Old, High Emissions Cars out
of
the
Basin
111
11/5.5 Moving More People in Fewer Vehicles 112
11/5.6 Reducing the Annual Rate
of
Increase in Gasoline
Consumption 117
11/6 A Glimpse at the Post-1982 Situation and Long-Range
Needs 122
Appendix 127
About the Authors 169
6
LIST
OF
TABLES
PAGE
1 Present Strategy (1971) . 35
2 Comparison
of
California State Ambient
Air
Quality Standards
and Federal Standards (April 30, 1971) . 37
3 Emissions Levels for Gaseous Fuels . 52
4 Percentage Changes in Emissions for Vacuum Spark Advance
Disconnect 54
5
EQL
Strategy No.
I-South
Coast Air
Basin.
57
6 Sulfur Dioxide Emissions in
L.
A. County 60
7 Particulate Emissions in
L.
A. County .
61
8 Example 1: Conversion
of
a
Truck
Fleet . 68
9 Example
2:
Conversion
of
Fleet
of
8 Sedans and
18
Trucks.
71
10 Sources
of
Reactive Hydrocarbons 87
11
Reactive
HC
Reductions-L.A.
County.
88
12
Sources
of
Oxides
of
Nitrogen (1971) . 89
13
Rule 68-Limitations on
NO
x
Concentrations from Power Plants 89
14 Stationary Source
NO
x
Reduction Program for L.A. County 90
15 Emissions Taxes for Various Model Year Vehicles. 110
16 Tax Savings for Emissions Reduction . 110
17
Birth-Death Schedule for Vehicles in L. A.
County.
128
18
Average Mileage vs. Vehicle
Age.
128
19 Exhaust Emissions Levels for Present and
Future
Vehicles. 129
20 Sample Calculation-Exhaust Emissions
of
Reactive Hydrocar-
bons for 1975 . 130
21
Effect
of
Vacuum Spark Advance Disconnect . 130
7
LIST
OF
ABBREVIATIONS
APCD
ARB
A.S.M.E.
CNG
CO
CTA
CVS
DOT
EPA
EQSC
GSA
HC
LPG
LNG
LPG
NO
NO
x
NO
z
PCV
ppm
pphm
scfm
TAC
VSAD
Air Pollution Control District
Air Resources Board
American Society
of
Mechanical Engineers
Compressed natural gas
Carbon monoxide
Chicago Transit Authority
Constant volume sampling
Department
of
Transportation
Environmental Protection Agency
Environmental Quality Study Council
General Services Administration
Hydrocarbons
Liquefied flammable gas
Liquid natural gas
Liquid petroleum gas
Nitric acid
Nitrogen oxides
Nitrogen dioxide
Positive crankcase ventilation
Parts
per
million
Parts per hundred million
Standard cubic feet per minute
Technical Advisory Committee
Vacuum spark advance disconnect
8
FIGURES
PAGE
1 Effect
of
Reduction in Nitrogen Oxides Emissions
on
Nitrogen
Dioxide
Air
Quality for Downtown Los Angeles
131
2
Nitrogen Dioxide Air Quality
vs.
Emissions for Various Stations 132
3 Breakdown
of
Reductions in Reactive Automotive Hydrocarbon
Emissions for Los Angeles
County.
133
4
Breakdown
of
Reductions in Automotive Oxides
of
Nitrogen
Emissions for Los Angeles
County.
134
5 Reduction
in
Total Reactive Hydrocarbon Emissions for Los
Angeles
County.
135
6 Reductions in Total Oxides
of
Nitrogen Emissions for Los
Angeles County
136
7 Improvement in Oxidant
Air
Quality for the South Coast Air
Basin (0.10
ppm)
137
8
Improvement in Nitrogen Dioxide
Air
Quality for the South
Coast
Air
Basin .
138
9
Improvement in Oxidant Air Quality for the South Coast
Air
Basin
(0.20
ppm)
139
10 Breakdown
of
Reductions in Automotive
Carbon
Monoxide
Emissions for Los Angeles
County.
140
11
Improvement in Carbon Monoxide Air Quality
for
L.A. County
141
12
Supply and
Demand
of
Natural Gas in August 1975 for South-
ern
California
142
13
Summary
of
Propane Supply and Demand Annual Averages for
California.
143
14
Long Range Projection of Oxidant
Air
Quality
for
the South
Coast
Air
Basin .
144
15
Carbon Monoxide
Air
Quality
vs.
Emissions for Downtown Los
Angeles
145
16
Carbon Monoxide
Air
Quality
vs.
Emissions for Los Angeles
County
146
17
Probability
that
the Mid-Day Maximum One
Hour
Average Oxi-
dant
in Central Los Angeles is Greater
Than
10
pphm
(Sum-
mer)
147
18
Oxidant Air Quality vs. Emissions for Downtown Los Angeles
(0.10 ppm) .
148
9
PAGE
19 Oxidant Air Quality
vs.
Emissions for Downtown Los Angeles
(0.15
ppm)
. 149
20 Oxidant Air Quality vs. Emissions for Downtown Los Angeles
(0.20
ppm)
. 150
21
Evaporative Emissions of Hydrocarbons from Automobiles for
Los Angeles County
151
22 Breakdown of Improvement in Oxidant
Air
Quality for Down-
town Los Angeles 152
23 Improvement in Oxidant
Air
Quality for Downtown Los
Angeles (0.15
ppm)
.
153
24 Improvementin Oxidant Air Quality for Downtown Los
Angeles (0.20 ppm) 154
25 Improvement in Nitrogen Dioxide Air Quality for Downtown
Los
Angeles.
155
26 Improvement in Oxidant
Air
Quality for the South Coast
Air
Basin (0.15
ppm)
. 156
27 Various Projections
of
Reductions in Automotive Reactive Hy-
drocarbon Emissions for Los Angeles. 157
28
Various Projections
of
Reductions in Automotive Oxides
of
Nitrogen Emissions for Los
Angeles.
158
29 Various Projections
of
Reductions in Automotive Carbon Mon-
oxide Emissions for Los Angeles County . 159
30 Various Projections for Improvement in Oxidant Air Quality
for the South Coast Air Basin . 160
31
1969 Seasonal Variation in Natural Gas Demand for the South
Coast Air
Basin.
161
32 Supply and Demand
of
Natural Gas in February 1975 for South-
ern California 162
33 Typical Vacuum Spark Advance Disconnect Installation. 163
34 Typical Capacitor Discharge Ignition Optimization System
Installation 164
35 Typical Evaporative Emissions Control System. 165
36 Vapor Return System for Station
Filling.
166
37 Vapor Return System for Vehicle Filling. 167
10
FOREWORD
The Environmental Quality
Laboratory
(EQL) traces its origins
to
a series
of
discussions initiated by Caltech President Harold Brown
on
the feasibility
of
a Caltech Air Pollution
Laboratory
aimed
at
alleviating the smog problem in
the
South
Coast Air Basin.
In
an
address
to
the Institute for the Advancement
of
Engineering
on
February
28,
1970,1
Dr. Brown summarized the main con-
clusions
of
a faculty-JPL study group
on
smog led by Professor Carver Mead
that
preceded the formation
of
the EQL.
To
quote from Dr. Brown's address,
the most
important
conclusion "is
that
there are
other
factors which are as
important
or
more
important
than
the technological ones
Unless expert
social scientists are
available-and
I
mean
not only economists
to
examine
the economic balance, but political scientists, sociologists, psychologists,
and
so
on-the
study will be done in too narrow a context. Although it will give
the right answers
to
its own questions, it will prove
to
have overlooked ques-
tions more important
than
those which it asked."
Our
experience in working
on
the smog problem over the past year fully
confirms Dr. Brown's observations. The
EQL
team engaged in this study
included social scientists, lawyers, engineers,
and
graduate
and
undergradu-
ate students. Each
of
us
had
to
learn
that
the social, cultural, legal, economic
and technical factors interact strongly
and
therefore cannot be treated separ-
ately.
In
addition
to
innumerable internal debates, seminars
and
memos,
we
had the benefit
of
numerous discussions with people in industry, in environ-
mental action groups,
and
in government
at
all levels who are concerned with
air pollution.
At the outset
of
the
EQL
study
we
made the decision
to
consider only those
air pollution control strategies
that
comply with the spirit (if
not
the letter)
of
the Clean Air Act
of
1970.
In
the spirit
of
that
act
this report describes a
"management standards" approach for achieving drastic reductions in the
,number
of
"smoggy" days in the
South
Coast Air Basin
of
California by the
end
of
1977.
In
order
to
illustrate the kinds
of
control measures
that
are
required if the management
air
qijality standards are
to
be satisfied,
we
chose
one particular control strategy for detailed study. This strategy, called
EQL
Strategy #
1,
is
based
on
new "technical" control measures
on
stationary
sources
and
used
motor
vehicles, combined with a set
of
social
and
economic
incentives and disincentives designed to encourage the shift to low-pollution
motor
vehicles,
to
encourage the use
of
multiple-occupancy vehicles (buses,
carpools, etc.),
and
to
halt
or
at
least reduce the
annual
rate
of
increase in
gasoline consumption in the Basin.
2
If
EQL
Strategy # 1
is
followed,
we
estimated
that
the average
number
of
days per year
on
which the California
'Brown, H.: "The University and Environmental Research," Bulletin
of
the
California Institute
oj
Technology, Vol. 79, No. I, 'March 7,
1970.
2Some
of
these technical control measures are also included in the Implementation Plan sub-
mitted by the State to the U.S. Environmental Protection Agency in February,
1972.
11
ambient air quality standard
on
photochemical oxidants
is
violated would be
reduced from
241
days in 1970
to
50 days by the end
of
1975, and
to
25
days
by the end
of
1977.
The measures
we
propose are neither painless
not
inexpensive. We did
not
find any "magic solutions."
For
example, the cost
of
EQL
Strategy # 1
for this Basin
is
estimated at
about
one billion dollars through the end
of
1975, or
about
$100 per head. Whether
or
not
the results
that
could be
achieved are worth the effort and expense
is
up
to
the people
of
the
South
Coast Air Basin
to
decide.
An earlier version
of
this report called
EQL
Report
#
4,
dated
January
15,
1972,
consisted
of
Part
I, which contained a summary
of
EQL
Strategy
1,
and
Part
II, which briefly outlined the legislative
and
administrative actions
required. The present final edition
of
the
EQL
air pollution report contains
a revised and updated version of
Part
I
and
a new
Part
II, entitled
"Support-
ing Information and Analysis."
Our
work
on
the short-term (1972-1977) air pollution control problem
raised important
and
difficult questions
about
the long-range (1982-2000)
problem
of
controlling air pollution in the
South
Coast Air Basin. Members
of
the EQL staff are studying new technologies, social
and
economic incen-
tives, modes
of
transportation
and
patterns
of
land use
and
development in
an
attempt
to
formulate a long-range strategy.
LESTER
LEES
Director, Environmental Quality Laboratory
Pasadena, California
June
15,
1972
12
SMOG A
REPORT
TO
THE
PEOPLE
EQL
STRATEGY
NO.
I-A
SUMMARY
16
PART
1:
SUMMARY
In 1970,
25
years after California enacted its first air pollution control law,
LOg
Angeles
County
stal had
a~r
that
d~d
not
meet state
air
quality
standards
for pnotocnemical oxidants (such as ozone)
on
65%
of
the days, for
carbon
monoxide
on
55%
of
the
days,
and
for nitrogen dioxide on
31
%
of
the days.
Clean air was three decades behind us,
and
state
and
local enforcement
agencies estimated
that
it was two decades
ahead-in
1990. The federal gov-
ernment said otherwise. With the enactment
of
the Clean Air Amendments
of
1970 the timetable for clean air was moved ahead
to
1975-or
1977,
at
the
latest.
The California strategy,
on
one hand,
and
the federal requirements,
on
the
other, seemed to represent two extremes. One was so slow
that
the time when
economic and population growth would overtake control measures could be
readily predicted. This would
happen
sometime in the middle
of
the 1980's.
The other was so rapid
that
only a sudden
and
wrenching curtailment
of
transportation
and
economic activity could produce
the
required results.
In
the latter case, the cure might be worse
than
the disease.
An
interdisciplinary team
of
researchers
at
the Environmental Quality
Laboratory concluded
that
for
air
basins with critical air pollution
problems-
like
that
of
Los Angeles
and
surrounding
areas-a
compromise was needed.
The team
put
together a strategy
that
seemed practical
and-when
added
to
pollution control measures presently in effect
or
planned-would
reduce the
number
of
substandard, smoggy days 80% by 1975
and
90% by 1977.
EQL
Strategy #
I-so
designated since it was only one
of
many
possible
combinations-would
introduce several novel features to air pollution control.
It
would focus
on
the millions
of
motor
vehicles presently
on
the
road
instead
of
relying, as has been the case heretofore, only
on
increasingly stringent
control
of
new cars. Engine
and
evaporation emissions from the existing
stock
of
cars would be reduced by a
number
of
practical means: changing
the fuel from gasoline
to
the cleaner-burning
natural
gas
or
propane; retrofit
devices and engine modification;
mandatory
inspection
and
testing
of
vehicle
emissions. Somewhat more radical were socio-economics policies
that
would
reduce use
of
motor
vehicles significantly
and
thus,
for
the first time, test the
motorist's determination
to
reduce air pollution by asking
of
him a personal
sacrifice
of
a measure
of
his freedom in deciding where, when,
and
how he
would use his car. Stationary sources would be recognized as significant
causes
of
pollution in the Basin
and
efforts to make further emission reduc-
tions at power plants, industry,
and
even service stations, would be redoubled.
The cost
of
such a
program
is
not
small-about
$1
billion for those tech-
nical measures to which a dollar value can be attached. That's
about
$100 a
head for everyone in the
South
Coast
Air Basin, or, looked
at
another
way,
it's less
than
35
miles
of
a new freeway in Los Angeles.
17
1/1
NEED
FOR
A
NEW
AIR
POLLUTION
CONTROL
STRATEGY
IN
THE
SOUTH
COAST
AIR
BASIN
Twenty
five
years ago the California State Legislature passed its first air
pollution control legislation.
During
the last quarter-century California has
come
to
be recognized as a world leader in air pollution control. Yet in 1970
the California state ambient
air
quality standard
on
photochemical oxidants
(including ozone), chosen so
that
it lies "below
that
(level) associated with
aggravation
of
respiratory diseases,"l was violated
on
241
days in the
South
Coast Air Basin.
In
that
same year the standard
on
nitrogen dioxide was ex-
ceeded
on
115
days
and
the standard
on
carbon
monoxide (12
hour
average)
was violated
on
203 days.2
Without
the
air pollution control measures
on
stationary sources
and
new
motor
vehicles now in effect the situation would be even worse. But if the
State
and
local control
program
in effect in
1971
were
to
be followed for the
rest
of
this decade, it would lead
at
best
to
a relatively slow improvement
in air quality in this Basin.
For
example, it
is
estimated
that
the California
standard
on
oxidents would still be violated
on
140 days in 1975
and
on
85
days
in
1980. The two principal reasons for this slow progress are:
(I)
the low "death
rate"
of
dirty old cars and the low
"birth
rate" of new
motor
vehicles
that
meet stringent exhaust emission
and
evaporative control standards; (2) the
increase in gasoline consumption
at
a rate
of
about
4% per year. The EQL
is
certainly
not
the only group to conclude
that
a new air pollution control strat-
egy
that
would deal effectively with these two problems
is
urgently needed
(Section
III 1.1).
While the
EQL
study
of
the "smog" problem was in progress, the federal
government began
to
exert pressure for a much faster rate
of
improvement
in air quality
than
the 1971 State
and
local strategy could possibly provide
(Section III 1.2).
On
April 30, 1971, the Administrator
of
the Environmental
Protection Agency, acting under the provisions
of
the Federal Clean Air Act
of
1970 (as amended), published new federal
air
quality standards
that
are
even more stringent
than
the California standards. Except for the standard
on
nitrogen dioxide, the federal standards are
not
to
be exceeded more
than
once a year. These standards must be attained within three years
of
the date
of
final approval of the state plan, except
that
an
extension
of
up to two years
may be granted by the Administrator.
Thus, the
South
Coast Air Basin
is
required to meet the new federal
ambient air quality standards by
1975, except in the case
of
photochemical
oxidants, for which the
EPA
granted a two-year extension.
If
the state agencies do
not
prepare a satisfactory implementation plan,
the Act empowers the Administrator
of
EPA
to
develop such a plan,
and
if
~~~~~~~~~~~~~~~~~
broad authority to the Administrator. Even if the Administrator does
not
act,
I
Air
Resources
Board,
Annual
Report
to
Governor
Ronald
Reagan
and
the
Legislature, entitled
Air
Pollution
Control
in
California.
1970,
January,
1971,
Table
1,
p.
24.
'Profile
of
Air
Pollution Control,
Los
Angeles
APeD,
1971.
18
private citizens
and
groups can sue under the Act
to
force compliance with
federal ambient air quality standards.
In contrast
to
these new federal requirements the Los Angeles County Air
Pollution
Control
District stated in its 1971
annual
reportJ
that
the present
matew
would
brin.g
llir
CJU9.l~ty
up
to
the Cal:£ornla state standards by 1990!
Thus, the present California control
program
places "clean air" so far in
the future
that
any improvements in
air
quality might well be overtaken by
population
and
economic growth long before the distant "target date"
is
reached. But
to
reduce violations
of
air quality standards from the present
level
of
241
days per year for photochemical oxidants (for example) to liter-
ally
one day per year within the period allowed by the Clean Air Act would
require drastic curtailments in the rates
of
consumption
of
gasoline, natural
gas
and
residual oil in the Basin,
and
a sudden brake
on
economic activity.
The most effective practical
approach
must lie somewhere in between these
two extremes.
The approach adopted in this report occupies this "middle ground." We
recognize
that
the
South
Coast Air Basin in California
is
faced with a uniquely
difficult air pollution control problem. Because
of
its special meteorology
and topography,
and
the enormous rate
of
consumption
of
fossil fuels,4 even
the best technology likely
to
be available
in
this decade would
not
reduce the
average number
of
days per year
on
which State air quality standards
on
photochemical oxidants are violated below a lower bound
of
10-15 days.5 We
chose for detailed study a particular control strategy (called
EQL
Strategy
#
1)
designed
to
drive toward these lower limits as rapidly as feasible in the
spirit (if
not
the letter)
of
the Clean Air Act
of
1970 (as amended).6 In sum-
mary, EQL Strategy
# 1
is
based partly
on
new "technical" control measures
to reduce emissions from stationary sources
and
used
motor
vehicles.? But
even in the
short
run
(1972-1977)
we
found it necessary
to
combine these
technical measures with a set
of
social
and
economic incentives and disincen-
tives designed
to
encourage the shift to low-pollution
motor
vehicles,
to
encourage the use of multiple-occupancy vehicles (buses, carpools, etc.),
and
to
reduce the annual rate
of
increase in gasoline consumption in the
Basin. These control measures are
not
supposed to
be
all-inclusive,
and
the
"mix"
is
not
optimized for minimum cost
to
achieve a given level
of
air
quality.
8
But they are representative
of
the kinds
of
measures
that
are
required.
'Profile
of
Air Pollution Control, Los Angeles
APCD,
1971.
'List,
E.
J., Energy
Use
in
California: Implications for the Environment, EQL Report # 3,
December, 1971.
5The California ambient air quality standard states
that
the
maximum
daily one-hour average
oxidant level should not exceed 0.10
ppm
(parts
per
million).
'Later
(Section III 1.1) this strategy
is
compared with a strategy
that
relies mainly on new
car
con-
trols and does not meet the requirements
of
the Clean Air Act
of
1970
(as amended) even in spirit.
'Some
of
these measures are included in the new State Implementation Plan (February, 1972)
'Cost
optimization for a wide range
of
strategies
is
treated in some detail by Trijonis,
John,
An
Economic Air Pollution Model. Application: Photochemical Smog
in
Los Angeles County
in
1975,
Summer, 1972.
19
1/2
EQL
STRATEGY
NO.1
1/2.1 General Features
The
EQL
strategy depends
on
the concept
of
"management standards,"
based on technical, economic and social feasibility,
that
would serve as mile-
stones enroute to the clean air required by
both
the California and federal
ambient air quality standards. These management standards would set a
first "target date," by which time significant percentage reductions are to
be
achieved in the number
of
days per year
that
ambient air quality standards
are violated in the Basin.
By
the second "target date" substantial percentage
reductions would have to be made in the
remaining number
of
these
"objectionable" days, etc. This approach provides the flexibility required,
and allows for "feedback" from the public as it assesses the beneficial
effects
of
specific control measures, measured against the economic and
social costs
of
these measures.
The Clean Air
Act
of
1970
(as amended) appears to give the Administrator
of
the
EPA
discretionary authority to approve such
an
approach by a state
during the period in which a time extension
is
in effect. Such extensions can
be granted when (among other reasons) the necessary technology
is
unavail-
able; when the state has implemented reasonable alternatives (as would
be
the case if a strategy similar to
EQL
Strategy # 1 were adopted); when
reasonable interim measures are provided for (the basis
of
the
EQL
strategy).
EPA
regulations published in the Federal Register
on
August
14,
1971
en-
courage each state
"to
consider the socio-economic impact and the relative
costs and benefits"
of
alternative strategies. Public welfare and productive
capacity are to be weighed as well as public health.
Before discussing specific control measures contained in EQL Strategy #1,
certain desirable main features
of
any such strategy are outlined as follows:
1.
In
order to be credible the "target dates" for the achievement
of
manage-
ment standards ought to
be
set well within the present decade and not in
the vague future one
or
two decades hence. December 31,
1975
is
a
reasonable first target date (corresponding roughly to the end
of
the 3-year
period allowed under the Clean Air Act), and December 31,
1977
is
a
reasonable second target date (corresponding to the end
of
the 2-year
extension period).
2.
These management standards should
be
expressed in terms
of
percentage
reductions in the average number
of
days per year on which the Califor-
nia (or federal) standards
on
oxidants, nitrogen dioxide and carbon mon-
oxide are exceeded.
For
example, a reasonable goal
is
to reduce these
"objectionable" days in the
South
Coast Air Basin from the 1970 level
of
241
per year to a level
of
50
days per year by the end
of
1975
(a reduction
of 80%).
By
the second target date,
at
the end
of
1977, the objectionable
days should be reduced to
25
(an additional
redu~tion
of
50foF
'If
desired a third target date could be set
at
the end of
1979
by which time a reduction
of
50% in
the remaining number
of
these "objectionable" days must
be
achieved (to about
13
days per year).
20
21
3.
Because
of
the relatively short time periods involved, the "technical" con-
trol measures required to reach these management standards will have to
be based mainly on existing technology that can be developed
and
intro-
duced within the next 2-4
years.
4.
Any strategy must rely on a number
of
different control measures, each
of which provides a modest improvement.
It
is
the cumulative effect
which
is
significant. There
is
no one "magic solution."
One such strategy (EQL Strategy #
1)
is
described in the next sub-section.
The control measures
that
are proposed are
not
supposed to be all-inclusive,
nor are control costs supposed to be minimized.
Our
purpose
is
to illustrate
the kinds
of
measures
that
must be taken if
the
requirements listed above
are to be met.
In
most
of
the discussion
to
follow we are making
the
"con-
servative" assumption
that
new
motor
vehicles for model years beyond 1974
will meet the
1974
California exhaust emissions standards,
but
not
the more
stringent 1975(76 federal standards. Some
of
the figures
to
be presented
in
Part
II will show the additional benefits to be gained
(at
additional cost!)
if new
motor
vehicles do in fact meet the federal standards beginning in 1975.
1/2.2 Specific
Control
Measures
The nature and extent
of
the
specific control measures that are needed depend
on
the magnitude
of
the reductions in emissions
of
reactive hydrocarbons and
nitrogen oxides
that
are required in order
to
meet
the
management air quality
standards set forth in
EQL
Strategy #
1.
At present
no
general theory exists
that would enable us to predict ambient air quality for photochemical oxi-
dants, nitrogen dioxide
and
carbon
monoxide in terms
of
the emissions level
of
the primary contaminants.
In
lieu
of
such a theory, the relationship between
air quality
and
emissions levels
is
here established by means
of
a statistical
analysis
of
air quality monitoring
data
obtained
at
the ground-level stations
of
the Los Angeles Air Pollution Control District over the last several years.
10
An important simplifying physical assumption
is
made
that
for
given meteo-
rological conditions
the atmospheric concentrations
of
carbon monoxide and
the "early morning"!l concentrations
of
reactive hydrocarbons and nitrogen
oxides are directly proportional to their respective emissions levels.
The application
of
this simple idea to the statistical
data
is
best illustrated
by dealing first with the contaminant nitrogen dioxide, which tends to
be
approximately proportional to the total input
of
nitrogen oxides. Statistical
data
is
displayed in terms
of
the average number
of
days per year
that
the
maximum atmospheric concentration exceeds a given level for
at
least one
hour, plotted against the concentration (Figure
1).
(The solid curve in
lOThis
analysis
was
carried out by Mr.
John
Trijonis
as
part of
his
Caltech PhD thesis research on
the economics of air pollution control.
II
By
"early morning"
we
mean before 9:30 A.M., in Los Angeles, or before photochemical
reactions have begun.
Figure 1 corresponds to the 1969 average
of
about
1000 tons per day
of
nitrogen oxides emissions in the Basin.) As expected, "low" one-hour maxi-
mum concentrations
of
nitrogen dioxide
around
10
pphm
12
are exceeded
quite frequently,
but
"high" concentrations
around
50
pphm
are rarely ex-
ceeded
at
this emissions level. These observations correspond roughly
to
the relatively high frequency
of
occurrence
of
maximum
mixing layer heights
(or heights
of
the base
of
the infamous inversion layer)
that
are 3500 feet
or
less, compared
to
the infrequent appearance
of
maximum
mixing layer heights
that
are 700 feet, or less. These relatively infrequent low inversion layers
markedly concentrate the pollutants near the ground.
Suppose
that
by means
of
a set
of
control measures the level
of
emissions
of
nitrogen oxides in the Basin
is
reduced by
50%
to
500 tons per day.
For
the
same meteorological conditions, atmospheric
conce~trations
of
nitrogen diox-
ide are also cut in half (dashed curve in Figure
1).
In other words, ifemissions
are reduced by
50%, the simple rule
to
follow
is
that
the number
of
days per
year
on
which a particular
maximum
one-hour concentration
of
nitrogen diox-
ide
is
exceeded
is
the same as the number
of
days per year
on
which twice
this concentration was exceeded
at
twice the emission level (horizontal
dashed line in Figure
1).
By
following this rule,
we
see
that
at
the new
emissions level, a concentration
of
25
pphm
for one
hour
(California state
standard)
is
exceeded
on
the same number
of
days per year as a concentra-
tion
of
50
pphm
was exceeded
at
the old emissions level. A 50% reduction in
emissions level leads
to
a 90-95% reduction in days per year
of
violations
of
the state standard (vertical dashed line in Figure
1).
The situation for photochemical oxidants
is
more complicated
than
for
nitrogen dioxide because the peak one-hour oxidant level depends
on
"early-
morning" concentrations
of
reactive hydrocarbons
and
nitrogen oxides,
on
sunlight intensity, temperature
and
other variables in a complex manner. In
spite
of
this difficulty, by using the Los Angeles
APCD
data
Trijonis was able
to work
out
"summer"
and
"winter" correlations between daily one-hour
average oxidant level
and
"early-morning" concentrations
of
reactive hydro-
carbons
and
nitrogen oxides. The effect
of
reductions in emissions levels
on
the concentrations
of
these two substances
is
calculated
just
as nitrogen
dioxide was analyzed in the simple illustrative example given earlier.
13
Our
calculations show
that
in order
to
reduce from
241
to
50 the average
number
of
days per year
on
which the
maximum
daily one-hour average oxi-
dant
concentration
of
0.10
ppm
is
exceeded
14
(first "target"
of
EQL
Strategy
#
1)
the total emissions
of
reactive hydrocarbons from all sources in the Basin
must be reduced to 28%
of
present levels,
and
emissions
of
nitrogen oxides
"parts
per hundred million.
13Estimates
of
the number of objectionable days per year for each pollutant were obtained for
Central Los Angeles. The average number
of
days per year on which the California ambient air
quality standards are violated
at
some station in the entire Basin
is
significantly higher.
For
photo-
chemical
oxidant
the number
of
objectionable days for the entire Basin is 1.7 times higher
on
the
average than in Central L.A., and for nitrogen dioxide the number
of
such days
is
2.3
times hiBher
on the average.
I'California State ambient air quality standard.
22
must be reduced to
about
45%
of
present levels.
If
these reductions were
made, the California ambient air quality standards for nitrogen dioxide
of
25
pphm
for one
hour
would be exceeded
on
10
days per year as compared
with
130
days
in
1970.
Th~
"h~t\lth
wllrning"l5
lcvcl
of
a
onc'hour
average
oxidant concentration
of
0.20
ppm
(twice the State standard) for persons
with coronary artery diseases
or
chronic respiratory diseases would be
exceeded
on
15
days per year, as compared with
150
days per year in 1970.
Thus, Phase 1
of
EQL
Strategy # 1
is
designed
to
reduce
total
emissions
of
reactive hydrocarbons
to
28%
of
present levels
and
nitrogen oxide emis-
sions
to
45%
of
present levels by December 31, 1975.
These objectives would be accomplished by means
of
the following Phase 1
control measures, combined with the effects
of
the new cars introduced into
the Basin.
A.
Motor Vehicles
1.
Mandatory
conversion
of
all gasoline-burning commercial
motor
vehicles
of
model years 1970 and later in
both
small
and
large fleets (trucks, taxis,
buses, cars)
to
burn
a gaseous fuel, such as compressed
natural
gas
or
liquid propane gas, by December 31, 1973, in the
South
Coast Air Basin.
This measure means
that
about
33%
of
the gasoline now burned in the
Basin would be replaced by gaseous fuels.
2.
(a) Mandatory installation
on
1960-1965 gasoline-powered cars
of
a cur-
rently available control device
that
reduces hydrocarbon emissions by
about
60%
and
NO
x
emissions by
about
35%
on
pre-1966 cars.
16
(b)
Mandatory
installation
on
1966-1970 gasoline-powered cars
of
a con-
trol device
that
reduces nitrogen oxides emissions by a substantial
amounLI?
3.
Mandatory
installation of
an
evaporative control device
on
gasoline-
powered 1966-1969 vehicles
that
reduces fuel tank evaporative emissions
by 90%. (Starting with the 1970 models new cars have such controls.)
Since this device
is
estimated to cost approximately $150
to
purchase
and install, some subsidy
or
cost-sharing would be required. (Less expen-
sive retrofit devices are currently under study
at
the EQL.) If such a
subsidy were
to
be paid to vehicle owners for installation
of
this device,
an
equal subsidy ought
to
be made available to vehicle owners who elect
any other step
that
would reduce reactive hydrocarbon emissions in the
15Proposed by the Los Angeles
County
Medical Association.
16The
State Air Resources Board has approved the General Motors vacuum spark advance
disconnect device
and
the Air Quality Products capacitor discharge, ignition optimization system
for these cars (Section
Uj3A).
"In
November 1971 Governor Reagan signed the Sieroty-Cologne Bill, which requires
that
beginning in 1973 all 1966-1970 cars
must
be
equipped with a device
that
will "significantly"
cut nitrogen oxide emissions. The certification
that
such a device
is
installed
on
the
car
is to be made
on initial registration, on transfer of ownership, or on renewal
of
registration. A limit
of
$35
is
set
on the initial cost of such a device,
induding
installation charges,
and
the bill specifies
that
it
should not require maintenance more
than
once every 12,000 miles at a
maximum
cost
of
$15. The
State Air Resources Board must now set the standards for such equipment.
23
Basin by a comparable amount. Example: purchase
of
a post-1969 vehicle
to
replace
an
older vehicle
that
is
sold
to
a new owner who lives and works
outside the Basin.
4.
A mandatory vehicle emissions inspection system
that
would: (1) insure
that
new and used gasoline-powered vehicles meet the emissions standards
set for them by present and proposed control measures; (2) insure
that
vehicles operating
on
gaseous fuels are properly tuned to achieve the low
exhaust emissions levels qualifying them for the 7 cents/gallon (equiva-
lent) State fuel
tax
remission;18 (3) form the basis for a system
of
emis-
sions taxes.
5.
Social and economic incentives
and
disincentives designed
to
encourage
the shift to low-pollution
motor
vehicles by motorists
and
vehicle manu-
facturers,
to
encourage the use
of
multiple-occupancy vehicles, and
to
halt
or
at
least reduce the
annual
rate
of
increase in gasoline consumption.
Such measures include: (1) emissions taxes assessed
on
car
owners in
proportion
to
the
amount
of
emissions their cats discharge into the air;
(2) reserved "fast lanes"
on
freeways for buses
and
carpools; (3) controlled
access to freeways so
that
buses and carpools are given priority during
rush hours; (4) free
or
subsidized parking for carpoolers; (5) buses
and
demand-jitneys partially subsidized by revenues collected from emissions
taxes;
(6)
as a last resort, additional gasoline taxes
and/
or a limit
on
the
total consumption
of
gasoline in the Basin
at
2.7 billion gallons per year
by a system of freely auctioned coupons, giving motorists in the Basin
gasoline purchase rights up
to
this total amount,
but
no more.
19
In
our
calculations
we
assumed
that
by December 31, 1975, the com-
bined effect
of
all the measures
under
# 5 amounts
to
a 20% reduction in
the
motor
vehicle pollution remaining after measures # 1-4 are
put
into
practice.
B.
Stationary Sources
1.
Nitrogen Oxides.
Mandatory
installation
of
two-stage combustion
and/
or
gas recirculation (or
other
control devices) designed
to
cut NO
x
emissions
by 50% by the end
of
1973 in all fossil-fuel power plants.
2o
Mandatory
use
of
low "excess" air in industrial boilers
and
heaters using natural gas
with
a rating in excess
of
30 million
BTU/hour
(about
8.5 megawatts).
"California law presently exempts vehicles operating with propane
or
natural
gas conversion
systems approved
by
the Air Resources Board from the State
tax
on vehicle fuel.
19
According to E. J. List, the actual rate of gasoline consumption
in
1969 was 4 billion gallons
a year. The figure
of
2.7 billion gallons represents
what
is left after one-third
of
current gasoline
demand
is
converted
to
gaseous
fuels.
'OSuch control devices are now being installed in the large electric power plants
of
Southern
California Edison
and
the Los Angeles
Department
of
Water
and
Power.
24
2.
Hydrocarbons. (a) Substitution
of
nonreactive materials by users
of
organic solvents emitting "high reactivity"
HC
(as defined
by
the Los
Angeles
APCD)
in order to cut these emissions by 50%
by
1973.
21
(b) Man-
datory
recirculation
of
vapors
from
gasoline
storage
tanks
in
filEng
sta-
tions back to tanker trucks during filling operations.
c.
Phase
Two
Phase 2 of EQL Strategy # 1 consists
of
a limited number
of
"smog alerts" to
be called in the Basin during the period July through September when the
oxidant level exceeds 0.20
ppm
at
any station in the Basin,
or
when early
morning inversion layer height
and
temperature indicate a high probability
that this level will be exceeded.
22
Beginning in 1973 two
or
three such alerts
would be called,
and
by
1975
the number of such alerts would be increased
to 6-8.
Although
we
do
not
attribute any specific reduction in the number
of
"ob-
jectionable" days to Phase
2,
it seems clear
that
the two phases
of
EQL
Strategy #1 are mutually reenforcing. Incentives for reducing emissions are
created by calling smog alerts that shut down
or
curtail emission sources,
while reductions in emissions require fewer smog alerts.
If
our target
of
about
15
days per year for an oxidant level
of
0.20
ppm
is
reached by the end
of
1975, these smog alerts could be discontinued.
1.
During these smog alerts only "low emission" vehicles,23 vehicles with
two
or
more passengers, and buses
and
jitneys would be permitted
on
the freeways.
2.
During
an
alert all stationary sources
of
"high reactivity"
HC
emissions
would be shut down.
Rough estimates indicate
that
the cost
of
Phase 1
of
EQL
Strategy # 1 for
the South Coast Air Basin
is
about
one billion dollars
through
December 31,
1975, which amounts to
about
$100 per head,
or
$300 per household ($25
per head per year
or
$75
per household per year). The cost breakdown
is
as
follows:
(1) loss
of
federal
and
State
tax
revenues by conversion to gaseous
fuels-$400
million; (2) Vacuum
Spark
Advance
Disconnect-$70
million;
(3)
evaporative control
retrofit-$225
million;
(4)
mandatory
motor
vehicle
21Approximately
100
tons/day
of
"high reactivity"
HC
are emitted
by
these sources. Another
550
tons/day
of
"low reactivity"
HC
emissions from stationary sources would
not
be affected
by
this program.
"At
present first stage smog alerts are called when the oxidant level exceeds 0.50 ppm (five
times the State air quality standard). No emissions sources are curtailed during these alerts.
lJThese vehicles could be identified by means
of
special windshield stickers.
25
inspection
program-$200
million; (5) controls for stationary
sources-$lOO
million.
24
By
the second target date
of
December 31,1977,
EQL
Strategy #1 calls
for
no
more
than
25
days
per
year
on
which the California ambient air quality
standards for oxidants is violated in the Basin.
Our
calculations show
that
in
order
to
achieve this objective the total emissions
of
reactive hydrocarbons in.
the Basin must be reduced
to
about
22%
of
present levels
and
nitrogen oxides
emissions must be reduced to
about
38%
of
present levels.
If
the Phase 1 con-
trol measures are successful in reaching their targets by the end
of
1975, it
turns
out
that
the additional reductions in
total
emissions
that
are required
by the end
of
1977 could be achieved by means
of
two specific control meas-
ures:
(I)
continued conversion
of
gasoline-burning commercial vehicles
to
burn
a gaseous fuel, as long as emissions from new vehicles are significantly
higher
than
emissions from gaseous-fueled vehicles (maintaining the level
of
one-third
of
the gasoline replaced by gaseous fuels
at
all times); (2) contin-
uation
of
mandatory
vehicle emissions inspection
program
(AA
of
Phase I).
The social
and
economic incentives
and
disincentives listed
under
A.5
of
Phase I would almost certainly be necessary in the long
run
(Section 1/3),
but
no
additional reductions in emissions after 1975 are attributed to these
measures in the present "conservative" calculations. The additional cost
of
this
program
from the end
of
1975 to the end
of
1977
is
estimated
at
about
$380 million. (The total cost
of
the emission controls for new cars for 1976
and
1977
is
estimated
at
about
$300 million in this Basin.)
In Section
II/2
of
this
report
the reductions in emissions from
motor
vehi-
cles
and
stationary sources
that
can
be achieved by each
of
the control meas-
ures in
EQL
Strategy # 1 are discussed in detail. In Figures 3
and
4 we show
the breakdown in reductions in reactive automotive hydrocarbons
and
nitrogen
oxide emissions for L.A. County. Figures 5
and
6 show the
contribution
from
stationary sources
and
the reductions in total reactive automotive hydrocar-
bons
and
nitrogen oxide emissions. Based
on
these reductions the projected
improvement in ambient air quality for photochemical
oxidant
and
nitrogen
dioxide are calculated by methods already outlined
and
described in detail
in Section
II/2.2.
In
Figures 7
and
8 the results
of
these calculations are
illustrated for the "present strategy" (1971)
and
for
EQL
Strategy #
1.
Fig-
ure 9 shows the projected reductions in the
number
of
"health warning" days
(proposed by the Los Angeles
County
Medical Association for persons suffer-
ing from
coronary
artery diseases
or
chronic respiratory diseases).
Control measures
A.l
and
A.5
on
motor
vehicles will also greatly reduce
carbon monoxide emissions into the atmosphere
of
the Basin, as shown in
24The
costs
to
the buyers
of
new cars
that
meet the California
exhaust
emission
standards
is
estimated
at
approximately $400 million over this same period. This estimate is based
on
an
addi-
tional cost
of
pollution controls
of
$50jcar
in 1972,
$150jcar
in
1973
and
$300jcar
in 1974
and
1975. Detailed cost calculations contained in Trijonis' thesis based
on
"harder"
data
later shows
that
the
cost
of
Phase
I
in
the
South
Coast
Air
Basin
is
about
$1.8
billion,
including
new
car
con-
trols. This cost
amounts
to
about
$45 per capita per year,
or
about
1.2%
of
disposable income per
capita after taxes.
26
