Derivatives the tools that changed finance pot
Bạn đang xem bản rút gọn của tài liệu. Xem và tải ngay bản đầy đủ của tài liệu tại đây (1.36 MB, 202 trang )
A derivative is a contract that is used to transfer risk. There are many
different underlying risks, ranging from fluctuations in energy prices to
weather risks. Most derivatives, however, are based on financial securities
such as common stocks, bonds and foreign exchange instruments. This
chapter will explain, in broad terms, the following points:
❑ what derivatives are;
❑ how they are used;
❑ how derivatives can reduce risks such as price risk;
❑ how they can also increase risk – the aspect of derivatives that receives
most attention from the media;
❑ how some recent derivatives disasters occurred; and
❑ the ways in which some basic derivative contracts such as forwards,
options, swaps and futures work.
Derivatives have changed the world of finance as pervasively as the
Internet has changed communication. Their growth has exploded during
the last 30 years as ever more risks have been traded in this manner. By the
end of 1999, the estimated dollar value of derivatives in force throughout
the world was some US$102 trillion – about 10 times the value of the entire
US gross domestic product.
1
Insurance is the traditional method for sharing risks. We will use the
concept of insurance when discussing derivatives because insurance is a
familiar notion and most people understand it. However, although insur-
ance and derivatives share common features in that they are both devices
for transferring risk, there are also distinct differences. The risks covered
by insurance are generally different from those that are dealt with by
derivatives.
We first need to clarify the meaning of the word “risk”. “Risk” has a
specialised meaning in an insurance context: it refers to the chance that a
future event might happen with bad consequences for somebody – for example an
airline might lose someone’s baggage. This event is uncertain in that it
may or may not happen. If it does not happen, you are no worse off but if
it does, there is an adverse consequence that could involve an economic
loss or something else untoward.
2
1
1
Introduction
The more usual meaning of “risk” has positive as well as negative
undertones. In business and investment decisions, risk involves both the
prospect of gain as well as the chance of loss. When there is a wide varia-
tion in the range of outcomes we say that a project “carries a lot of risk”. If
there is little variation in the range of outcomes we say that it “carries very
little risk”. We willingly take on risks all the time – risk taking is a perva-
sive human and business activity. Individuals and firms undertake risky
ventures because of their potential rewards even though there is the possi-
bility of loss. Indeed, we have a basic intuition that high expected returns
are associated with high risk.
Insurance risk, then, relates only to downside risk. Business risk, on the
other hand, involves both an upside chance of gain and a downside possi-
bility of loss. No one likes pure downside risk and we would like to
dispose of it if we could. We can sometimes do this by entering a contract
with an insurance company whereby we pay the premium up front and
the insurance company reimburses us if a specified event happens. The
policy specifies what the payment will be under different outcomes and is
one way of eliminating downside risk.
A derivative is also a contract where the ultimate payoff depends on
future events. To that extent it is very similar to insurance. However,
derivatives are much more versatile because they can be used to transfer a
wider range of risks and are not restricted to purely downside risks.
Contracts that serve a useful economic purpose such as reducing or
transferring important types of risks are the ones most likely to survive
and flourish. Thus, insurance contracts that serve to transfer risks from
consumers to insurance companies are pervasive. One of the reasons why
derivatives have become so popular is that they enable risks to be traded
efficiently. Different firms face different risks and attitudes to risk vary
across firms as well as individuals. These factors increase the gains from
trade. The same event may have opposite impacts on two different firms.
For example, a rise in the price of oil will benefit an oil-producing
company because it receives more money for its product. The same price
rise will hurt an airline company because it has to pay more for fuel.
However, one can envisage a contract based on the price of oil that would
make both companies better off.
The concept behind derivatives is simple. First, the risk is sliced up into
standardised pieces. Then these pieces are traded in a market so that there
is a price for all to see. Those who want to dispose of the risk sell it and
those who are willing to take on the risk buy it. The idea is that those
players who are most able to bear the risk will end up doing so at market
prices. In a competitive market it can be argued that the market price
provides a fair basis for exchange.
DERIVATIVES
2
SOME SIMPLE DERIVATIVES
With advancing technology it is now possible to write derivatives on a
broader range of underlying assets and variables. There has been remark-
able innovation in the development of new derivatives. In this section we
shall look at two simple types of derivatives.
Common stocks
If you own 100 common shares of General Electric you actually own a very
tiny piece of this huge company. Common stocks are very flexible vehicles
for risk transfer. They are, in fact, early examples of derivatives. Their
basic structure illustrates four simple yet powerful concepts that fore-
shadowed subsequent developments in derivatives:
❑ Divisibility of the claim. The division of the total-ownership pie into iden-
tical little slices is a very simple way to distribute risk.
❑ Upside appreciation. Common stocks do well when the firm does well, so
they provide a way to share in the firm’s good fortunes.
❑ Downside protection. Common stocks provide a way of limiting the
investor’s downside risk. Because of limited liability, the maximum a
shareholder can lose is the initial investment made to buy the share. This
protection does not exist under some other forms of ownership such as
certain types of unlimited partnership.
❑ An organised market. Publicly traded stocks trade on an organised
market. The prevailing market prices should accurately reflect their
current value.
These four features make common stocks extremely efficient tools for
transferring risk. Financial derivatives have magnified such features.
Forward contracts
A forward contract is an important example of a derivative. It is an
arrangement, made today, to buy something in the future for a fixed price.
Consider the example of buying a house. Normally there is a period
between the signing of the purchase contract and my taking possession of
the property. This contract to purchase the house is an example of a
forward contract. In other words, I agree now to buy the house in three
months’ time and to pay the agreed purchase price at that time. The seller
also agrees now to sell me the house in three months’ time. In the jargon of
forward contracts, I have a long position in the forward contract or, more
simply, I am long the forward contract. The seller is said to have a short posi-
tion in the forward contract or, more simply, is short the forward contract.
A forward contract can be written on almost any type of underlying
asset. The owner of a forward contract has the obligation to buy the under-
lying asset (or commodity) at a fixed date in the future for a fixed price.
INTRODUCTION
3
The price to be paid for the asset is termed the delivery price or the
contract price. This price is fixed at inception and does not change over the
term of the contract. In contrast, the price of the underlying asset will
change as time passes. If the price of the asset rises a lot over the term of
the contract, the asset will be worth more than the contract price at the
delivery date. In this case fortune has favoured the person holding the
long position because they can buy the asset for less than its market value.
However, if the price of the asset falls during the life of the contract, the
asset will be worth less than the contract price at the delivery date. In this
case fortune has favoured the person holding the short position because
they can sell the asset for more than its market value.
The parties have agreed in advance to exchange the asset for the contract
price at a fixed rate in the future. However, when the delivery date arrives,
one of the parties will show a profit on the contract and the other will show
a loss. We will explain later how the contract (delivery) price is determined
at the outset so that when the forward contract is set up, the terms of the
contract are fair to both parties.
HEDGING AND SPECULATION
Corporations use forward contracts to manage price risk. A gold mining
company, Sperrin Corp (a hypothetical company named after a mountain
range in Northern Ireland that does contain traces of gold) faces the risk
that the price of gold will fall. To protect itself against this risk Sperrin
could enter a forward contract to sell gold in one year’s time at a fixed
price of US$310 per ounce. In other words, the delivery price is US$310.
This forward contract protects Sperrin if gold prices drop below US$310.
If the price falls to US$200 an ounce Sperrin will still be able to sell its gold
at the prearranged price of US$310. On the other hand, if gold prices rise
Sperrin still has to fulfil the terms of the contract. For example, if the price
of gold jumps to US$400 an ounce Sperrin has to sell its gold for the
contracted price of US$310 per ounce. In other words, Sperrin has given up
the right to any price appreciation above the contract price of US$310. In
this situation, the other party will be able to make money by buying gold
from Sperrin under the forward contract at US$310 and selling it on the
cash (spot) market at US$400.
Who might be willing to take the other side of the forward contract with
Sperrin Corp? The forward contract might also be attractive to a firm that
makes gold jewellery, as the risks it faces are the mirror image of those
faced by Sperrin. Suppose the Old Triangle
3
jewellery firm normally buys
its gold on the cash market. If the price of gold rises, Old Triangle faces
higher production costs. If the price of gold falls the firm’s costs decline.
Gold price changes have opposing impacts on Old Triangle and Sperrin so
they can both reduce their risks at the same time by entering the forward
contract. Through the forward contract Sperrin has locked in a fixed price
DERIVATIVES
4
at which it can sell gold in the future and Old Triangle has a contract to
buy gold at a fixed price in the future.
This practice of reducing price risk using derivatives is known as
hedging. In our example, Sperrin is hedging its exposure to gold price risk.
Old Triangle is also hedging its price risk. Thus, the same contract can be
used as a hedging vehicle by two different parties.
The opposite of hedging is speculating. Speculation involves taking on
more risk. An investor with no exposure to the price of gold can obtain this
exposure by entering into a forward contract. Many financial markets need
risk takers or speculators to make them function efficiently and provide
liquidity. Speculation serves a useful economic purpose. It can lead to
improved risk sharing and provide a rapid and efficient way of incorpo-
rating new information into market prices. Derivatives provide a very
powerful tool for speculating as they can increase an investor’s exposure
to a given type of risk.
OPTIONS
Options are classic examples of derivatives that can be used to increase or
reduce risk exposure. An option is a contract that gives its owner the right to
buy or sell some asset for a fixed price at some future date or dates. A call option
gives its owner the right to buy some underlying asset for a fixed price at
some future time. A put option confers the right to sell an asset for a fixed
price at some future date.
The owner of the option has the right – but not the obligation – to buy
(or sell) the asset. In contrast, under a forward contract one party is obliged
to buy (or sell) the asset. Options can be based on a wide range of under-
lying assets. The asset could be a financial security such as a common stock
or a bond. The underlying asset need not be a financial asset: it could be a
Picasso painting or a rare bottle of Chateau Margaux.
The terms of the option contract specify the underlying asset, the dura-
tion of the contract and the price to be paid for the asset. In option jargon,
the fixed price agreed upon for buying the asset is called the exercise price
or the strike price. The act of buying or selling the asset is known as exer-
cising the option. The simplest type of option is a “European” option, which
can only be exercised at the end of the contract period. On the other hand,
an “American” option can be exercised at any time during the contract
period.
4
Put options provide protection in case the price of the underlying asset
falls. Sperrin Corp could use put options on gold to lock in a floor price.
For example, suppose the current gold price is US$280 an ounce and
Sperrin decides it wants to have a guaranteed floor price of US$285 per
ounce in one year’s time. The company could buy one-year maturity put
options with a strike price of US$285 an ounce. If the price of gold in one
year’s time is below US$285, Sperrin has the right to sell its gold for a fixed
INTRODUCTION
5
price of US$285 per ounce. For example, if gold dropped to US$250 per
ounce Sperrin has the right under the put option to sell the gold for US$285
per ounce and the option is then worth US$35 per ounce. However, if the
price were to rise to US$360, Sperrin can make more money by selling its
gold at the prevailing market price and would not exercise the option. In
this case, the option would not have any value at maturity. The put option
gives Sperrin protection against a fall in the price of gold below US$285
while still allowing the gold company to benefit from price increases. In
this respect the put option differs from the forward contract. Under a
forward contract, the firm still has price protection on the downside but it
gives up the benefits of price increases because it has to sell the gold (at a
loss) for the contract price.
We will now examine how call options can be used by an airline to
reduce the risks of high fuel costs. Assume the current price of jet fuel is
US$135 per tonne and American Airlines is concerned about future
increases in fuel prices. If American Airlines buys one-year call options
with a strike price of US$140 per tonne it has the option to buy jet fuel at a
price of US$140 per tonne. We assume the option is “European”, which
means simply that it can only be exercised at its maturity. If the price of jet
fuel in one year’s time is US$180 per tonne, the airline can buy the fuel at
US$140 per tonne or US$40 below what it costs on the cash market. In this
case American Airlines will exercise the call option, which will then be
worth US$40 per tonne. On the other hand, if the price of fuel in one year’s
time has dropped to US$100 per tonne, the airline will not exercise its
option. It makes no sense to pay US$140 for fuel when it can be bought in
the market for US$100. When American Airlines buys this option contract
from a Texas-based energy company it has to pay for the option. The price
it pays for the option is called the option premium. We will discuss how this
premium is determined in Chapters 4 and 5.
Hedgers can use option contracts to reduce their exposure to different
types of risk. In the above examples both Sperrin and American Airlines
used options to reduce their risk. As is the case with all derivatives, options
can also be used to increase risk. Victor Niederhoffer, a legendary trader,
provides a dramatic example of how put options can be used to increase
risk. Niederhoffer’s hedge fund routinely sold put options on the Standard
and Poor (S&P) Index. This index is based on a portfolio of the common
stocks of large US corporations. When the fund sold the options it collected
the option premiums. This strategy worked well as long as the Index did
not drop too sharply. However, on October 27, 1997 the S&P fell by 7% in
a single day and totally wiped out Niederhoffer’s fund. Ironically, Victor
Niederhoffer’s autobiography was titled Education of a Speculator.
5
DERIVATIVES
6
SWAPS
A swap is an agreement between two parties to exchange a periodic stream of bene-
fits or payments over a pre-arranged period. The payments could be based on
the market value of an underlying asset.
For example, a pension plan that owns 10,000 shares of the Houston-
based energy company Enron could enter an equity swap with an invest-
ment bank to exchange the returns on these shares in return for a periodic
fixed payment over a two-year period. Assume the payments are
exchanged every month. Each month the pension plan pays the invest-
ment bank an amount equal to the change in the market value of its Enron
shares. In return, the plan receives the agreed fixed dollar amount every
month; after two years the swap expires. The two parties go their separate
ways. The two parties go their separate ways. During this two-year period
the bank receives the same returns that it would have received had it
owned the Enron common shares. The pension plan receives a fixed
income for two years, thus giving up its exposure to the Enron shares for
the two-year period.
Swap terminology
We now describe some of the terms associated with swaps. The duration
of the swap contract is called the tenor of the swap. In the above example
the tenor is two years. The two parties to the contract are called the coun-
terparties. In the last example the counterparties are the pension plan and
the investment bank. The sequence of fixed payments is called the fixed leg
of the swap and the sequence of variable payments is called the variable leg
of the swap.
In a commodity swap the payments on one leg of the swap may be based
on the market price of the commodity. Sometimes the swap is based on the
actual delivery of the underlying commodity. Cominco, the largest zinc
producer in the world, is based in British Columbia, Canada. In December,
2000, Cominco entered an innovative swap with a large US energy
company.
6
Under the terms of the swap Cominco agreed to deliver elec-
tricity to the energy company at a fixed price per megawatt hour. The
energy company paid US$86 million for the power. The duration of the
swap was from December 11, 2000, to January 31, 2001. During this period,
electricity prices were very high in the western US as a result of the Cali-
fornia power crisis (which we discuss in more detail in Chapter 2).
Cominco generates its own power from a dam on the Pend Oreille River.
Normally, Cominco uses this power to refine zinc in its plant near the
town of Trail in southern British Columbia. In the winter of 2000, the price
of power in the Pacific North West was so high that Cominco found it prof-
itable to scale back its production of zinc to free up the power. During this
period, Cominco reduced its zinc production by 20,000 tonnes. To meet its
customers’ demands for zinc, Cominco purchased zinc on the spot market.
INTRODUCTION
7
The employees, who were no longer needed in the zinc-production opera-
tions, were deployed on maintenance activities. The revenue from the
swap had a major impact on the company’s bottom line. According to
Cominco officials, the company has a goal of making an annual operating
profit from its Trail operations of US$100 million – the revenue generated
by the swap produced almost an entire year’s projected profit.
Interest rate swaps
Interest rate swaps are very popular financial instruments. They have
grown to such an extent that they are the most widely traded derivatives
contracts in the world. In an interest rate swap, one counterparty pays a
fixed rate of interest and the other counterparty pays a variable, or
floating, rate of interest. The payments to be exchanged are based on a
notional amount of principal.
Interest rate swaps are useful tools for managing interest rate risk. We
can illustrate this use of interest rate swaps with an example involving
savings and loan banks. These institutions, often known as “thrifts”, were
set up in the US to provide mortgages to residential homeowners. Most of
the assets of a typical thrift consist of long-term mortgages, which often
pay fixed interest rates, and the liabilities tend to be consumer deposits.
The interest rates paid on these deposits vary with market conditions and
depend on the current level of short-term rates. This means that the thrift’s
income and outflow are not well matched. If there is a dramatic rise in the
level of rates, the thrift has to pay out more money to its depositors. At the
same time its revenue stream remains fixed because its existing assets
provide a fixed rate of interest computed at lower rates. The thrift there-
fore faces a significant exposure to interest rate risk.
The thrift’s problem can be neatly solved with an interest rate swap. The
parties exchange a stream of fixed-rate payments for a stream of floating-
rate (variable-rate) payments. The thrift agrees to pay the fixed interest
rate and receive the floating rate. The dealer agrees to pay the floating rate
and receive the fixed rate. These floating rate payments provide a much
closer match to the amounts the thrift must pay to its depositors.
NEW CONTRACTS
New types of derivative instruments are being introduced all the time.
Weather derivatives provide a good example of a recent innovation in this
area. Many business organisations have profits that depend on the
weather and there is considerable scope for such derivatives as hedging
vehicles. For example, a brewery company’s beer sales in the summer are
strongly linked to the weather. As the temperature increases, more beer is
consumed but if it gets too hot the consumption of beer may actually
decrease. On the other hand, the yield on many crops may be adversely
affected by a long, hot summer, thereby reducing farmers’ incomes.
DERIVATIVES
8
If the winter is abnormally cold, a company that sells snowmobiles will
experience increased sales. For example, Bombardier, a Quebec-based
company that manufactures and sells snowmobiles, has sales that are
highly related to the amount of snowfall in its sales areas. Bombardier has
exposure to a specific type of weather risk and it was able to hedge this risk
by buying a weather derivative, based on the amount of snowfall.
Bombardier bought a snow derivative that meant it could offer cash back
to customers if snowfall was less than half the norm. In a weather deriva-
tive we need to specify precisely the method by which the payment is to
be computed: if the contract is to be based on the temperature level or the
average temperature level, then the location needs to specified. For
example, the traded weather options on the Chicago Mercantile Exchange
use the temperature readings at O’Hare Airport as a basis for their
Chicago contract.
Power providers and energy utilities have considerable exposure to the
vagaries of the weather. If the summer is very hot consumers will turn up
the air conditioning and if the winters are very cold there will be a surge
in heating demand. These companies can reduce their risk exposure using
weather derivatives. For example, consider Hank Hill, a propane distrib-
utor. Hank lives in Arlen, Texas, and he is concerned that in a very mild
winter propane sales will be low, reducing his profit. Suppose that under
normal winter conditions his sales are one million gallons but if the winter
is very mild he will sell only half this amount, reducing his profit. Hank
can protect himself against this risk by buying a weather derivative from
Koch Industries. The payoff on this derivative will be based on the actual
average winter temperature for Hank’s sales region. Panel 1 describes an
interesting weather derivative that is designed to protect the revenues of a
chain of London pubs from adverse weather conditions.
MARKETS
In the next chapter we will discuss the reasons for the significant growth
of derivatives that has taken place in recent years. Much of the initial
growth was in the development of exchange-traded instruments, which
are standardised contracts that are traded on organised markets such as
the Chicago Board Options Exchange (CBOE) or the London International
Financial Futures Exchange (LIFFE). The exchanges provide a secondary
market for derivatives and current information on market prices. There are
a number of safeguards to maintain orderly markets and, in particular, to
guard against the risk of default. For example, there are limits on the posi-
tion any one firm can take. If an investor is losing money on a short posi-
tion, the exchange will monitor the situation and require additional funds
from time to time, known as “margin funds”. These include the posting of
margins and position limits. The exchange knows the positions of all the
participants and can step in if necessary to take corrective action. Kroszner
INTRODUCTION
9
(1999) suggests that the control of credit risk is an important achievement
of organised exchanges.
The other main market for derivatives is the so-called over-the-counter
(OTC) market, which now accounts for about 85% of all derivatives. This
market does not have a fixed geographical location; rather, it is formed by
the world’s major financial institutions. OTC derivatives are extremely
flexible instruments and they have been the vehicles for much of the finan-
DERIVATIVES
10
PANEL 1
ENRON WEATHER DEAL FOR UK WINE BAR CHAIN
LONDON, 6 June – Corney & Barrow (C&B), which owns a chain of wine
bars in the City of London, has closed a weather derivatives deal with US
energy giant Enron – the first such undertaking by a non-energy company
in the UK. The deal was brokered by Speedwell Weather, a division of
the UK-based bond software company Speedwell Associates.
Sarah Heward, managing director of C&B Wine Bars, told RiskNews
that the deal helps to protect her company against volatility in business
caused by spikes and falls in temperature. “This deal protects a total of
£15,000 in gross profit, so it is not a huge contract. But it does show that
weather derivatives can be used by small companies”, says Heward. She
was introduced to the idea of hedging her business’s volatility with
weather derivatives by her own customers. “Many of our customers are
market makers – including Speedwell – and we were talking about the
volatility in C&B’s business. They suggested that weather derivatives
might help”, she says. Heward acknowledges that for some executives of
small companies, convincing their board of the need to use weather
derivatives will be difficult. She says it was not a tough pitch for her, as
her board members all work in the City of London.
Steven Docherty, chief executive of Speedwell Weather, says that the
market responded surprisingly well to the offer of the C&B deal. Once
Speedwell had taken some time to research and define C&B’s particular
problem, the deal itself was closed a couple of days after it was offered,
he says. He believes that those involved in the weather derivatives market
will view non-energy contracts as a good way of hedging against putting
too many eggs in the energy basket. However, he points out that these
deals will still need to be aggressively priced.
While Docherty told RiskNews that the weather market has developed
more slowly than was expected, he still describes himself as “insanely
optimistic”. He believes that banks and funds are becoming more inter-
ested in weather products and that this will bring a capital markets
approach – resulting in aggressive pricing and efficient marketing of
weather products, as well as additional liquidity.
cial innovation in the last two decades. OTC contracts tend to be much
longer dated than exchange-traded options: in some cases they last for as
long as 30 to 40 years. One of the most critical differences between
exchange-traded derivatives and OTC derivatives is that the former are
guaranteed by the exchange whereas OTC derivatives are guaranteed only
by the issuer. Thus, the investor is subject to credit (default) risk. The
longer the term, the higher is the risk that one of the parties will default.
Firms and countries that seem strong today may be in default in the future.
DERIVATIVES AND DISASTERS
Inordinate risk taking, however, can have harmful results. Indeed, the
term “speculator” has acquired unsavoury associations because of past
excesses. In their role as speculative instruments, derivatives have been
associated with some of the most famous financial failures in recent years.
For example, in 1995, the venerable British bank Barings collapsed with
a loss of US$1.4 billion. The scapegoat for this loss was Nick Leeson, the
bank’s 28-year-old head trader. A characteristic of derivatives is that the
price paid to enter the contract is often small in relation to the size of the
risk. We call this property leverage because a lever gives us the ability to
magnify our efforts. Leeson used derivatives to take very highly leveraged
positions, betting on the direction of the Japanese stock market. He
guessed wrongly and brought down the bank. However, the bank’s
internal control system proved to be ineffective and Leeson’s activities
were not supervised. Most of Leeson’s pay was in performance bonuses: if
he made a large trading profit his bonus would be huge. Leeson therefore
had a very strong incentive to take risks.
One of the criticisms of the Barings case was that Nick Leeson was not
an expert in the derivatives area. In contrast, Long-Term Capital Manage-
ment (LTCM), which collapsed in 1998, was advised by some of the
brightest minds in the business. LTCM was a very prominent hedge fund
that invested the funds of very rich clients and provides a spectacular
example of extreme speculation. Note that the word “hedge” in this
context does not mean that these funds actually hedge. LTCM tottered on
the brink of collapse in 1998 in the aftermath of the Russian debt crisis
because it had taken on massive and very risky positions in several
markets. Edward Chancellor observes that LTCM “used derivatives
wantonly to build up the largest and most levered position in the history
of speculation”.
7
Paul Krugman describes the role of leverage in the fund’s
near collapse:
8
Rarely in the course of human events have so few people lost so much
money so quickly. There is no mystery about how Greenwich-based Long-
Term Capital Management managed to make billions of dollars disappear.
Essentially, the hedge fund took huge bets with borrowed money – although
INTRODUCTION
11
its capital base was only a couple of billion dollars, we now know that it had
placed wagers directly or indirectly on the prices of more than a trillion
dollars’ worth of assets. When it turned out to have bet in the wrong direc-
tion, poof! – all the investors’ money, and probably quite a lot more besides,
was gone.
Funds such as LTCM historically operated with very few restrictions
and little disclosure. The justification for this state of affairs was that
people who invested in hedge funds were presumed to be sophisticated
investors who needed less protection. The most frightening aspect of the
LTCM affair was the threat its demise posed to the entire financial
industry which was already under pressure from the Russian debt crisis.
LTCM was such a major player that it had very significant positions with
many large institutions. If it fell into disarray, the domino effect could
topple the entire financial system. LTCM was rescued by an infusion of
US$3.6 billion from a consortium of some of the world’s largest investment
banks, which had significant exposure to LTCM. The rescue was mounted
after it was realised that LTCM would have to default if the banks stood
idly by. Disasters such as Barings and LTCM provided a compelling incen-
tive for banks and other financial institutions with large derivatives posi-
tions to improve the way in which they manage these positions. This trend
was reinforced by regulation at both the domestic level and the interna-
tional level. Trade associations, motivated by enlightened self-interest,
also developed codes of best practice for the derivatives business.
We have seen that derivatives have two contradictory powers. On the
one hand they are remarkably efficient tools for reducing risk. At the same
time derivatives have an awesome capacity to increase risk through
leverage. This dual nature of derivatives can be viewed in terms of two
conflicting emotions that can be used to describe attitudes to risk: fear and
greed. The common tendency to reduce risk stems from fear of loss. The
motivation to take on large amounts of risk and reap high profits is based
on greed. Derivatives provide an efficient way to construct a strategy that
is consistent with either of these attitudes.
DEFAULT RISK
Default risk has been a factor since the first contracts were arranged and
various procedures have been used to deal with it. One is to try to set up
the contract so that it provides incentives that discourage default or non-
performance. The life of the Russian author Dostoevsky provides an inter-
esting example of a contract with draconian penalties for non-
performance. The contract involved an agreement to produce a new book
within a given time. Dostoevsky was deeply in debt because of his
gambling activities and he was under pressure from his creditors, so he
DERIVATIVES
12
entered a deal with an unscrupulous publisher named Stellovsky. Under
this deal Dostoevsky sold the copyright to all his published books for 3,000
roubles. The deal also stipulated that Dostoevsky would deliver a new
novel by November 1, 1866. If he failed to deliver on time, then Stellovsky
would also gain the rights to all of Dostoevsky’s future books. This created
a severe penalty if the book was not produced on time. Dostoevsky, with
help from a secretary, Anna Snitkin, whom he later married, managed to
write the book in under a month and finished it by October 31, 1866. By a
twist of irony the new book was called The Gambler.
Futures contracts provide a further example of how the design of a
derivative contract can help reduce exposure to default risk. These are
exchange-traded instruments. The owner of a futures contract has the
obligation to buy some underlying asset. In this respect futures contracts
are similar to forward contracts but there are important differences
between them concerning the realisation of gains and losses. For example,
if an investor is long a forward to buy some asset and the price of the
underlying asset rises steadily over the contract period, the gain will not
be realised until the end of the contract term. In contrast, if the investor
owns (is long) a futures contract and the price of the underlying asset goes
steadily up, the gains would be realised on a daily basis and they are
posted to the investor’s account. By the same token, if a trader sells (is
short) a futures contract and the price rises every day, then the loss will
have to be settled up each day and the trader loses money every day. The
exchange clearing house ensures that losses and gains are settled up on a
daily basis. If the prices move dramatically during the day then the settling-
up can be more frequent. The exchange broker will ask his client to deposit
more money (margin) as soon as a position exceeds a given loss. This peri-
odic settling up means that no side of the transaction is allowed to build
up a large loss position. If the client is unable to meet the margin call the
position may be liquidated to prevent additional losses. The design of
futures contracts provides a very sturdy mechanism for reducing default
risk.
CONCLUSION
This chapter demonstrated how widely derivatives are used as tools for
transferring risk. It described some basic derivative contracts such as
forwards, options, swaps and futures, and gave examples of how these
contracts are used to reduce different types of risk. It emphasised that
derivatives can be used to increase leverage and take on more risk, while
pointing out the dangers of unbridled risk taking. There are also important
differences between exchange-traded derivatives and OTC derivatives.
The next chapter will analyse the reasons for the tremendous growth of
derivatives.
INTRODUCTION
13
1 These figures refer to the notional amounts. Figures are from the Bank for International
Settlements (BIS) press release, May 18, 2000 ref 14/2000E. The data relates to December,
1999.
2 Sometimes the term “risk” is used to describe the occurrence that triggers the bad conse-
quences. This usage of “risk” to mean “peril” is common in insurance. For example, an
insurance policy may be described as offering protection against named “risks”.
3 The firm, invented by the authors, gets its name from a song by Brendan Behan: “And the
old triangle/Went jingle jangle/Along the banks of the Royal Canal.”
4 The terms “European” and “American” are misleading in this respect. They have nothing to
do with geography. The names are apparently due to Samuelson, who coined the term Euro-
pean to describe the simpler type of option and the term American to describe the more
complicated type of option. Samuelson picked these names because of some Europeans he
met during his research on options.
5 See Niederhoffer (1998).
6 At the time of writing, the name of the energy company was not public.
7 See Chancellor (1999).
8 Paul Krugman, “What Really Happened to Long-Term Capital Management”, Slate, URL:
(1 October 1998).
DERIVATIVES
14
This chapter explains why derivatives have become so popular in the last
30 years. It discusses the initial growth of derivatives products on organ-
ised exchange markets and the more recent expansion of derivatives on
over-the-counter markets. It describes how derivatives now play an
important role in deregulated power markets. Different types of derivative
contracts are described using diagrams to explain the concepts. The
chapter ends with an example showing how a pension plan used deriva-
tives to alter its investment mix.
REASONS FOR GROWTH
The explosive growth in derivatives began during the 1970s when certain
key financial variables became more volatile and new types of derivatives
were introduced to manage the increased risk. This growth was fuelled by:
❑ deregulation;
❑ growth in international trade;
❑ increased investment abroad;
❑ advances in computers and technology; and
❑ new research ideas that showed how to price options.
This confluence of factors enabled derivatives to grow from their former
modest position in the financial landscape to the dominant place they
occupy today. In the early 1970s, the increased volatility in financial vari-
ables such as interest rates and exchange rates exposed corporations to
more risks and increased the demand for vehicles to reduce these risks.
During the last quarter of the 20th century there was also a large increase
in international trade and foreign direct investment in real assets, associ-
ated with a huge expansion of cross-border capital market flows. Deriva-
tives provided investors with efficient instruments for investing in the
global economy, and dramatic advances in information technology
lowered the costs of storing and transmitting information. This made the
rapid development of global markets possible. Finally, fundamental
advances in financial theory gave rise to the basic models that provide the
foundation for the pricing and risk management of derivatives.
Foreign exchange risk, which had not been a major concern during the
15
2
Markets and Products
previous 30 years, became an important factor in the early 1970s. This
added a new dimension of uncertainty to international trade. A system of
fixed exchange rates had been in force among the industrialised nations
since the Bretton Woods Agreement in 1944. This meant that the price of
one currency in terms of another currency remained fixed. For example,
the value of £1 sterling remained constant in terms of US dollars. Under
this system, a US manufacturer knew at the outset how many dollars it
would receive for a payment of, for example, £1 million due in two years
time. If £1 was worth US$2 at the outset, it would still be worth US$2 after
two years.
Fixed exchange rates came under increasing pressure due to economic
growth in Europe and Japan and a decline in the competitiveness of US
exports. In 1971, Richard Nixon severed the fixed link between the US
dollar and gold and set in motion the breakup of the Bretton Woods
system of fixed exchange rates. This led to a system of floating exchange
rates, in which the price of one currency in terms of another varied
according to the relative strength of the two countries’ economies.
With the advent of floating exchange rates, our US exporter would have
to convert the £1 million back into dollars at the prevailing exchange rate.
If the pound had strengthened against the dollar so that £1 was now worth
US$3, the manufacturer would receive US$3 million for the UK currency.
Alternatively, if the pound had weakened against the dollar so that £1 was
only worth US$1, the manufacturer would receive just US$1 million for the
British pounds. Hence the increased risk in international trade.
The advent of floating exchange rates coincided with the increased
volatility in interest rates and a sharp increase in oil prices. The stage was
set for the development of new derivatives – instruments that could
protect firms against these risks.
The Chicago exchanges
The centre of this development was Chicago, whose location as the major
hub in the fertile farming lands of the American Midwest had made it the
world’s leading centre for agricultural and commodity derivatives.
Contracts are traded on two major exchanges: the Chicago Board of Trade
(CBOT) and the Chicago Mercantile Exchange (CME).
In the early 1970s, both exchanges were anxious to expand their busi-
ness and were looking for new contracts to trade. In true Chicago style,
they competed vigorously with each other. In 1972, the CME created the
first financial futures contract to trade futures on seven major currencies.
In 1973, the CBOT began trading option contracts on individual stocks.
These were the first derivatives to be based on financial assets rather than
agricultural commodities.
In 1975, the CBOT introduced its US Treasury bond futures contract,
which was to become one of the most active exchange-traded contracts in
DERIVATIVES
16
the world. The bond futures contract enabled corporations to protect
themselves against future interest rate movements.
As we have indicated, other factors contributed to the rapid growth in
derivatives. In the last 25 years there has been a global expansion in trade
due to the relaxation of trade restrictions. Financial markets have been
deregulated, especially in Europe and Asia, and cross-border transactions
in the basic securities have expanded enormously. For the US, these trans-
actions rose from 4% of GDP in 1975 to 230% by 1998. Other industrialised
countries show similar rates of growth during this period. In Germany, for
example, cross-border transactions grew from 5% of GDP in 1975 to 334%
in 1998.
1
Advances in information technology and developments in electronic
communication mean that vast amounts of data can now be stored very
efficiently and transmitted quickly and inexpensively to almost any corner
of the globe. These advances in technology have reduced trading costs and
lowered the cost of innovation.
In turn this has made it easier to create new types of derivatives. The
basic instruments such as standard calls and puts are often termed plain
vanilla derivatives. The more complex instruments are sometimes termed
exotic derivatives. Later in this chapter, we will describe some of the fasci-
nating new types of derivatives that have been introduced in recent years.
Sometimes a legal restriction can impede innovation and its removal can
open the way for the development of new contracts. There is an interesting
example of this that led to the growth of financial derivatives. In 1982, the
CME introduced the first cash-settled futures contract and this paved the
way for an extension of the futures concept to a whole new range of assets.
The idea behind the cash settled futures contract is that instead of deliv-
ering the underlying asset, the two parties settle the contract by
exchanging cash at the delivery date. The first contract with this feature
was the CME’s Eurodollar futures contract. Cash settlement of futures
contracts would have been illegal had it been subject to Illinois state law
because it would have been classified as “gambling”. However the
Commodity Futures and Trading Commission (CFTC), set up in 1974 as
the sole regulator of futures contracts, sanctioned the use of this concept.
This change in the way that derivative contracts could be settled has had
profound implications for the expansion of the market.
We can get a sense of how important this development was if we
hypothesise a world where only physical settlement is permitted. For
example, consider how we would organise the settlement procedure for an
option based on the Standard & Poor’s 500 Stock Index. This index corre-
sponds to a portfolio of the common stocks of 500 of the most important
firms in the US. Suppose that an option to buy this index could only be
settled by physical delivery. In this case, when the option is exercised, the
seller of the call would have to deliver to the buyer a physical portfolio that
MARKETS AND PRODUCTS
17
consists of the entire 500 stocks that make up the index. This would be
so inefficient as to be impractical. By settling in cash, the buyer of the
option receives a cash amount that has the same value as the index
portfolio.
Paradoxically, the existence of regulations can also increase the use of
derivatives and provide a spur for financial innovation. Derivative instru-
ments can be used to circumvent regulations or alter the impact of tax law.
For example, in many countries there is a limit on the percentage of
pension assets that can be invested in foreign securities. Options and
futures contracts can be used to neutralise such regulations. We will see
later in this chapter how the Ontario Teachers’ Pension Plan Board used
derivatives to change its asset mix without selling assets that it was
required by law to hold.
THE OVER-THE-COUNTER MARKET
In the last chapter, we made the distinction between exchange-traded
contracts and over-the-counter (OTC) contracts. Exchange-traded deriva-
tives dominated the 1970s and 1980s, but in the last decade the off-
exchange or OTC market grew so quickly that it is now much larger than
the exchange-traded market. Although the OTC market competes with the
exchanges for some of the same business, the two markets have advan-
tages for one another. An institution that writes OTC derivatives will often
use an exchange-traded product to offset the risk that it has taken on. For
example, a British insurance company might buy a five-year call option on
the UK market from a Swiss investment bank to cover option features that
it has included in its insurance contracts. This growth in demand can
increase trading volumes in exchange-traded products. Moreover, the
market prices available from the exchange-traded products provide
valuable information for the pricing and risk management of the OTC
products.
Sometimes products that start out as highly customised OTC instru-
ments can evolve until they acquire many of the standardised features of
exchange instruments. A standardised instrument with clearly specified
contractual provisions on default, reduces uncertainty and lowers transac-
tion costs. Interest rate swaps are prime examples. The first swaps were
individually tailored agreements between two counterparties. The bid-ask
spreads were huge.
2
As time passed, market participants saw the benefits
of standardisation and, in particular, of having clear documentation to
reduce uncertainty. It was important to reduce legal uncertainty because
swaps can involve parties from different legal jurisdictions. Many swap
contracts are now standardised and have many of the features of
exchange-traded contracts. The bid-ask spreads have shrunk by a factor of
one hundred, to one or two basis points from 1–2% previously.
The globalisation of the world economy has expanded the use of
DERIVATIVES
18
derivatives. The expansion of international trade has increased the foreign
exchange risk in business transactions. Derivatives provide an efficient
method of managing this risk. Moreover, equity investments have become
much more international. Until 1985, equity investment in most countries
took place mainly in the domestic market, with the UK and the Nether-
lands being notable exceptions. Since then, there has been a marked
increase in the volume of cross-border equity investment.
In the financial sector, there has also been a restructuring from domestic
institutions to global entities. For example, Citigroup now conducts busi-
ness in virtually every country in the world with interests in banking,
insurance and investments. Citigroup was formed by the merger of Citi-
corp and Travelers Group in 1998. Citigroup is a very broad-based finan-
cial services organisation, whose subsidiaries include Citibank,
Commercial Credit, Primerica, Salomon Smith Barney, SSB Citi Asset
Management Group, Travelers Life & Annuity, and Travelers Property.
For such global institutions, derivatives provide an efficient mechanism to
structure deals to arrange financing and transfer risks.
The OTC derivatives market encourages the creation of new products
and innovative contracts; new types of derivatives can be introduced to
solve particular problems. However, such creations are more likely to
flourish if they solve a generic problem. Such derivatives cover an
expanding range of risks and new applications open up for various
reasons. For example, there is now a worldwide trend towards deregula-
tion in some industries that were once highly regulated, such as the elec-
tricity industry.
DERIVATIVES AND POWER
Electricity is such an important commodity that governments have tradi-
tionally regulated the industry and controlled its price. Typically, the elec-
tricity supply for a given region was produced by a single entity. This
could be either a state-owned enterprise or a privately owned, regulated
utility. The price of electricity was computed by a formula based on the
utility’s production costs with an allowance for profit.
In recent years, there has been sweeping deregulation in this industry in
many countries. The first country to deregulate electricity markets was
Chile, in 1982. Since then deregulation has occurred in several countries
in South America, Europe and in many regions of the US and Canada.
The aim of these changes is to make the industry more competitive and
efficient.
The stereotype of the traditional utility is of a sleepy, inefficient giant
passing on its costs to the public. Under deregulation, the monopoly
power of the single producer is abolished and a market is established for
the supply of electricity. Under the new regime different producers bid to
supply the power and this establishes a market price. It turns out that
MARKETS AND PRODUCTS
19
market prices for electricity are significantly more volatile than regulated
prices. Hence, both producers and consumers of electricity are exposed to
more price risk under the market regime than under the previous regime.
New types of derivatives to buy (and sell) power have been created so that
this price risk can be better managed.
When you switch on your washing machine, it begins to consume elec-
tricity because it taps into an electric current that is being generated by a
central power source at a central power plant. If you turn up your air
conditioner during a hot and muggy summer day you will use more elec-
tricity. We take the existence of the steady supply of power for granted; the
price we pay is an average price based on the usage for the month. The
total consumption for a given region is the sum of the usage by the house-
holds and industries in that region. This consumption varies considerably
by time of day, by the season of the year and also with the vagaries of the
weather. The total consumption level at a given time represents the total
demand for electricity and traditionally this demand is not very sensitive
to price.
Electricity cannot be stored and so it has to be produced in sufficient
quantities to meet this demand. The electricity is produced at generating
facilities and the production involves turning some energy source into
electricity.
The supply of electricity is related to the cost of producing it and this
cost depends on the technology used to generate it. Once the facilities are
in place, the costs of producing electricity using nuclear power, coal and
hydro power are stable and do not increase much as capacity is increased.
Of course, there is an upper limit to the amount these plants can produce.
Gas and oil tend to be more expensive, and when the system is operating
near full capacity it becomes very expensive to produce additional units of
electricity using these fuels. The total amount of electricity produced at a
given price is called the aggregate supply. The total supply is not very
sensitive to price when the system is not producing at full capacity.
However, the total amount of electricity supplied to the market becomes
highly sensitive to the price when the system is operating at full capacity.
At the higher levels of production the supply becomes inelastic.
Forward contracts on electricity have become very important as soon as
the electricity industry becomes deregulated because they can be used to
manage price risk. A forward contract to buy electricity is an agreement,
made today, to buy a certain amount of power over some future period at
a fixed price. The price to be paid for the power is fixed today so that it is
locked in at the outset. By entering the forward contract to buy the elec-
tricity a firm can guarantee a certain supply of electricity at a guaranteed
price.
DERIVATIVES
20
Power failure
This background will help us understand what happened in California in
the winter of 2000. When electricity was deregulated in 1996, the state’s
investor-owned utilities were compelled to sell their power plants and buy
wholesale power. However, to protect consumers, the law put a cap on the
prices they could charge their customers. Throughout the 1990s, California
had underinvested in new power plants and transmission lines. During
this same period, the state’s economy boomed, putting increasing
demands on power consumption. By the end of the decade, a number of
factors had pushed the market price of electricity in California to unprece-
dented heights. The state’s two largest utilities, Southern California Edison
and Pacific Gas & Electric Co, teetered on the verge of bankruptcy.
The market price of electricity in California rose because of both
demand and supply factors. The summer of 2000 was one of the hottest on
record with low rainfall in the west and northwest of the United States.
The hot weather increased the demand for power and the low rainfall
meant that the availability of hydro-electric power was reduced. This was
followed by one of the coldest winters on record: November 2000 was the
coldest November nationwide since 1911. The cold winter increased the
demand for power. Since there had been very little new generation added
in California, Washington and Oregon, the supply was not on hand to
meet the increased demand. To make matters worse, well-intentioned
environmental legislation restricted the full use of power generation in the
region. The confluence of these factors meant that both scheduled and
unscheduled power cuts were common.
With hindsight, it is clear that deregulation could have been introduced
in a more sensible way. One of the advantages of deregulation is that the
market price provides a signal that helps to reduce demand and also bring
new production on line. Why did this not happen in California? One of the
reasons is that the existence of price caps can distort these signals. As a
recent report noted:
3
In addition, price caps that protect consumers from the signals of higher spot
prices do not create any incentive to reduce demand, leading to higher costs
in the long run. Price caps will also deter new entry at a time when new entry
is the essential to long term solution. Finally, price caps could reinforce any
reluctance of California or other states to deal with long term solutions.The
existence of the price caps would not have been such a problem had the util-
ities been able to reduce the risk by hedging it. The natural vehicle here is a
fixed-price forward contract. If the utilities had bought electricity in the
forward market they could have locked in a price for their power. Forward
contracts are efficient risk-management tools for handling a price cap but
surprisingly, the California utilities were not allowed to enter long-term
forward contracts. As the Federal Energy Regulatory Commission (FERC)
report notes: “The primary flaw in the market rules in California was the
MARKETS AND PRODUCTS
21
prohibition on forward contracts, and the primary remedy is the re-establish-
ment of forward contracts”.
Elsewhere the FERC staff report comments:
If California had negotiated forward contracts last summer, or even last fall,
it is likely that billions of dollars would have been saved and its two largest
utilities might not be facing bankruptcy today.
THE BASIC PRODUCTS
To describe derivatives it is useful to classify them systematically. This
can be achieved in different ways. We can classify derivatives:
❑ by type of instrument based on the payoff structure of the contract; or
❑ according to the underlying risk or risks on which the payoff is based.
In this section we start with very basic contracts and then move on to
more complex derivatives.
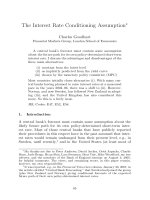
Digital options
The first type of derivative we consider is a digital option where the payoff
is either a fixed amount or zero. The payoff depends upon whether the
terminal asset price exceeds the strike price or is less than the strike price.
For example, a digital call option might pay 100 in three months provided
that ABC stock is above 110 at that time. In this case the strike price is 110
and if the terminal asset price is less than 110 at that time, the call pays
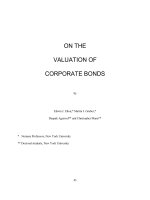
zero. The corresponding digital put option pays 100 in three months
provided that ABC stock is below 110 in three months.
Figure 2.1 shows how the payoff on a digital call option at maturity
varies with the price of the asset at maturity. The terminal asset price is
plotted on the horizontal axis and the option payoff is plotted on the
vertical. Note that the payoff is zero as long as the terminal asset price is
below 110. As soon as the terminal asset price rises above 110, the option
payoff becomes 100. Figure 2.2 shows how the payoff on the corre-
sponding digital put option at maturity varies with the price of the asset at
maturity. Note that the payoff is 100 as long as the terminal asset price is
below 110. As soon as the terminal asset price rises above 110, the option
payoff becomes zero.
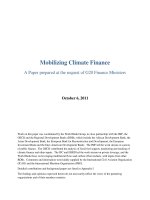
Figure 2.3 shows that if we combine these two digital options we get a
very simple payoff. The combined package produces a payoff of 100 in
three months no matter what happens to the price of the underlying asset.
Therefore, the two digital options can be combined to produce a risk-free
bond that matures in three months. These two digital options combine like
two interlocking pieces of Lego.
DERIVATIVES
22
MARKETS AND PRODUCTS
23
Figure 2.1 Payoff of a digital call option
0
0
20
40
60
80
100
120
20 40 60 80 100 120 140 160 180 200
Asset price
Option payof
f
Figure 2.2 Payoff of a digital put option
0
0
20
40
60
80
100
120
20 40 60 80 100 120 140 160 180 200 220
Asset price
Option payof
f
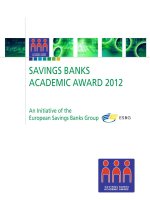
Standard options
Next, we consider a standard, or plain vanilla, European option. We have
already discussed this type of option in Chapter 1. First, we deal with call
options. In this case the payoff at maturity is equal to the difference
between the terminal asset price and the strike price if this difference is
positive. For example, if the strike price is 110 and the option matures in
three months then the call payoff is positive if the asset price is above 110
in three months. Otherwise the payoff is zero. Figure 2.4 shows how the
payoff on the call varies with the terminal asset price.
Figure 2.5 gives another way of showing how the payoff on a call option
is related to the history of the asset price. In this case we plot time along
the horizontal axis. The two jagged lines represent two possible paths of
the asset price. We see that one path gives a terminal asset price that is
greater than the strike price. For this path the call has a positive value at
maturity. The second path ends up with a terminal asset price that is less
than the strike price. For this path the call is worth zero at maturity.
Now we deal with European put options. In this case the payoff at matu-
rity is equal to the difference between the strike price and the terminal
asset price as long as this difference is positive. For example, if the strike
price is 110 and the option matures in three months then the put payoff is
zero if the asset price is above 110 in three months. The put has a positive
payoff if the terminal asset price is below the strike price. Figure 2.6 shows
how the payoff on the put varies with the terminal asset price.
DERIVATIVES
24
Figure 2.3 Combination of the payoff of digital options
0
0
20
40
60
80
100
120
20 40 60 80 100 120 140 160 180 200 220
Asset price
Payof
f
MARKETS AND PRODUCTS
25
Figure 2.4 Payoff of a standard call option
0
0
20
40
60
80
100
120
20 40 60 80 100 120 140 160 180 200 220
Asset price
Option payof
f
Figure 2.5 Payoff of a standard call option
180
160
140
120
100
80
60
40
20
0
Now Maturity
Time
Strike price
Payoff at
maturity
Asset price