PROGRESS IN HEMODIALYSIS – FROM EMERGENT BIOTECHNOLOGY TO CLINICAL PRACTICE potx
Bạn đang xem bản rút gọn của tài liệu. Xem và tải ngay bản đầy đủ của tài liệu tại đây (6.85 MB, 456 trang )
PROGRESS IN
HEMODIALYSIS –
FROM EMERGENT
BIOTECHNOLOGY TO
CLINICAL PRACTICE
Edited by Angelo Carpi, Carlo Donadio
and Gianfranco Tramonti
Progress in Hemodialysis – From Emergent Biotechnology to Clinical Practice
Edited by Angelo Carpi, Carlo Donadio and Gianfranco Tramonti
Published by InTech
Janeza Trdine 9, 51000 Rijeka, Croatia
Copyright © 2011 InTech
All chapters are Open Access articles distributed under the Creative Commons
Non Commercial Share Alike Attribution 3.0 license, which permits to copy,
distribute, transmit, and adapt the work in any medium, so long as the original
work is properly cited. After this work has been published by InTech, authors
have the right to republish it, in whole or part, in any publication of which they
are the author, and to make other personal use of the work. Any republication,
referencing or personal use of the work must explicitly identify the original source.
Statements and opinions expressed in the chapters are these of the individual contributors
and not necessarily those of the editors or publisher. No responsibility is accepted
for the accuracy of information contained in the published articles. The publisher
assumes no responsibility for any damage or injury to persons or property arising out
of the use of any materials, instructions, methods or ideas contained in the book.
Publishing Process Manager Masa Vidovic
Technical Editor Teodora Smiljanic
Cover Designer Jan Hyrat
Image Copyright argus, 2011. Used under license from Shutterstock.com
First published September, 2011
Printed in Croatia
A free online edition of this book is available at www.intechopen.com
Additional hard copies can be obtained from
Progress in Hemodialysis – From Emergent Biotechnology to Clinical Practice,
Edited by Angelo Carpi, Carlo Donadio and Gianfranco Tramonti
p. cm.
ISBN 978-953-307-377-4
free online editions of InTech
Books and Journals can be found at
www.intechopen.com
Contents
Preface IX
Part 1 Modeling, Methods and Technique 1
Chapter 1 Kinetic Modeling and Adequacy of Dialysis 3
Malgorzata Debowska, Bengt Lindholm and Jacek Waniewski
Chapter 2 Automated Blood Volume
Regulation During Hemodialysis 27
Isabelle Chapdelaine, Clément Déziel and François Madore
Chapter 3 Sodium and Hemodialysis 47
Matthew Gembala and Satish Kumar
Chapter 4 Polyethersulfone Hollow Fiber
Membranes for Hemodialysis 65
Baihai Su, Shudong Sun and Changsheng Zhao
Chapter 5 The Evolution of Biocompatibility:
From Microinflammation to Microvesiscles 93
Ciro Tetta, Stefano Maffei, Barbara Cisterna, Valentina Fonsato,
Giorgio Triolo, Giuseppe Paolo Segoloni, Giovanni Camussi,
Maria Chiara Deregibus and Emanuele Gatti
Chapter 6 Pulse Push/Pull Hemodialysis:
Convective Renal Replacement Therapy 113
Kyungsoo Lee
Chapter 7 Optical Dialysis Adequacy Monitoring: Small Uremic Toxins
and Contribution to UV-Absorbance Studied by HPLC 143
Kai Lauri, Jürgen Arund, Jana Holmar, Risto Tanner,
Merike Luman and Ivo Fridolin
Chapter 8 Influence of Online Hemodiafiltration on
Hemoglobin Level, ESA-Dosage and Serum Albumin
– A Retrospective, Multicenter Analysis 161
Roland E. Winkler, Peter Ahrenholz and Klaus Freivogel
VI Contents
Chapter 9 Leukocyte Function in High-Flux Hemodialysis 175
Jenny Olsson
Chapter 10 Dialysis Membrane Manipulation
for Endotoxin Removal 197
Michael Henrie, Cheryl Ford,
Eric Stroup and Chih-Hu Ho
Chapter 11 Citrate Anticoagulation in Hemodialysis 217
Stephan Thijssen
Chapter 12 Hemodialysis Principles and Controversies 227
Parin Makadia, Payam Benson,
Filberto Kelly and Joshua Kaplan
Part 2 Prognosis 253
Chapter 13 Residual Renal Function in Hemodialysis Patients 255
Zachary Z. Brener, Stephan Thijssen, Peter Kotanko,
James F. Winchester and Michael Bergman
Chapter 14 Biomarkers in Chronic Kidney Disease -
The Linkage Between Inflammation,
Ventricular Dysfunction and Overhydration 265
Olimpia Ortega
Chapter 15 Determinants of Cardiovascular Risk in Hemodialysis
Patients Without Significant Comorbidities 281
Aysegul Zumrutdal
Chapter 16 Malnutrition, Inflammation and Reverse
Epidemiology in Hemodialysis Patients 297
Rodney G. Bowden, Neil A. Schwarz and Brian D. Shelmadine
Part 3 Complications 313
Chapter 17 Complications and Managements
of Hyperphosphatemia in Dialysis 315
Eiji Takeda, Hironori Yamamoto,
Hisami Yamanaka-Okumura and Yutaka Taketani
Chapter 18 Management of Secondary
Hyperparathyroidism in Hemodialysis Patients 331
Emanuel Zitt and Ulrich Neyer
Chapter 19 Lipid and Lipoprotein Abnormalities
in Chronic Renal Insufficiency: Review 349
Oliver Rácz, Rudolf Gaško and Eleonóra Klímová
Contents VII
Chapter 20 Hemodialysis Vascular Access Dysfunction 365
Timmy Lee
Chapter 21 Nontraditional Anti - Infectious Agents in Hemodialysis 389
Martin Sedlacek
Chapter 22 Sleep in Patients with ESRD Undergoing Hemodialysis 407
Mukadder Mollaoğlu
Chapter 23 The Importance of Exercise Programs
in Haemodialysis Patients 429
Susanne Heiwe, Andrej Ekholm
and Ingela Fehrman-Ekholm
Preface
Hemodialysis (HD) represents the first successful long term substitutive therapy with
an artificial organ for severe failure of a vital organ. Because HD was started many
decades ago, a book on HD may not appear up-to-date.
Indeed, HD covers many basic and clinical aspects and this book reflects the rapid
expansion of new and controversial aspects either in the biotechnological or in the
clinical field.
The related topics are multiple because HD includes either biotechnology or multi-
organ involvement as well as different pathogenetic factors. Many efforts to reduce
dialysis complications and their treatment are made. This book revises new
technologies and therapeutic options to improve dialysis treatment of uremic patients.
This book consists of three parts:
modeling, methods and technique
prognosis
complications
The first part includes twelve chapters, five on modeling, water and electrolyte
preparation or regulation, four face membranes and biocompatibility, the remaining
three deal with procedures or controversies.
Besides important progress in biotechnology, a common and principal aim crossing
most of these chapters is the attempt to reduce morbidity by the use of more
compatible devices.
Prediction of morbidity or mortality by progress in the laboratory is a principal
general topic or aim of the second group of four chapters. These chapters underline
the relevance of the residual renal function and of the main laboratory biomarkers to
predict cardiovascular complications.
The third part includes seven chapters on clinical complications. The principal topic
crossing two chapters is the importance of metabolic disorders for the origin and the
development of the most important clinical complications (cardiovascular and bone).
X Preface
The remaining five chapters deal with lifestyle aspects (sleep or physical activity) and
local (vascular access) or systemic (infections) complications.
Therefore, this book reflects either emergent biotechnological or updated clinical
aspects concerning HD. These two topics include suggestions to improve prognosis
and therapy of the patients on HD.
The book will help not only general physicians, nephrologists, internists, cardiologists,
endocrinologists but also basic researchers, including bioengineers, to approach,
understand and manage the principal problems related to HD.
Finally, we consider that we were medical students in the same university hospital in
the sixties and successively we worked in the same university hospital department.
Our original department of internal medicine specialized in nephrology, under the
leadership of the late Prof. Gabriele Monasterio, who first proposed and validated the
low protein diet and included teachers who were pioneers in projecting and using the
artificial kidney.
Thanks to them, the authors of these book chapters and the publisher, we once more
have the pleasure to work together in this project including colleagues from multiple
continents.
Prof. Angelo Carpi, M.D.,
Department of Reproduction and Aging, University of Pisa,
Italy
Prof. Carlo Donadio, M.D.,
Department of Internal Medicine, University of Pisa,
Italy
Prof. Gianfranco Tramonti, M.D.,
Department of Internal Medicine, University of Pisa,
Italy
Part 1
Modeling, Methods and Technique
1
Kinetic Modeling and Adequacy of Dialysis
Malgorzata Debowska
1
, Bengt Lindholm
2
and Jacek Waniewski
1
1
Institute of Biocybernetics and Biomedical Engineering,
Polish Academy of Sciences, Warsaw,
2
Divisions of Baxter Novum and Renal Medicine, Karolinska Institutet, Stockholm,
1
Poland
2
Sweden
1. Introduction
The mathematical description of hemodialysis (HD) includes two parts: 1) explanation of the
exchange between patient’s blood and dialysate fluid across a semipermeable membrane of
the dialyzer, and 2) characterization of the solute removal from the patient. The solute
transport across the dialyzer membrane depends on the difference in hydrostatic pressure
and solute concentration gradients between both sides of the membrane and also on the
permeability of the membrane to the solute. The local equations for solute and fluid
transport through the membrane are based on a phenomenological (thermodynamic)
description according to the Staverman-Kedem-Katchalsky-Spiegler approach (Staverman,
1951; Kedem & Katchalsky, 1958; Katchalsky & Curran, 1965; Spiegler & Kedem, 1966). The
two compartment model describes the functioning of the patient – dialyzer system,
assuming that body fluid is divided into two parts: one directly (extracellular compartment)
and one indirectly (intracellular compartment) accessible for dialysis (Schneditz &
Daugirdas, 2001). The one compartment model of the solute distribution volume assumes
that the solute is distributed in a single, homogenous pool. Solute kinetic modeling is based
on a set of ordinary differential equations describing the changes of solute mass,
concentration and distribution volume in body compartments and in the dialyzer. Using
solute kinetic modeling one is able to evaluate dialysis efficiency.
The question concerning dialysis dosing has been debated and remains controversial since
the beginning of the dialysis treatment era. Between 1976 and 1981, the National
Cooperative Dialysis Study (NCDS) was performed in the United States to establish
objective, quantitative criteria for the adequate dose of dialysis (Gotch & Sargent, 1985;
Sargent & Gotch, 1989; Locatelli et al., 2005). The primary analysis showed that morbidity
was less at lower levels of time average urea concentration. The secondary ‘mechanistic’
analysis of the NCDS data done by Gotch and Sargent launched the issue of urea KT/V
(Gotch & Sargent, 1985).
Single-pool KT/V overestimates the removed amount of urea because of the postdialysis
urea rebound, i.e., a fast postdialysis increase in urea concentration in plasma, which is a
compartmental effect; therefore, the equilibrated KT/V (eqKT/V), estimated by the
Daugirdas formula, was introduced to clinical practice (Daugirdas et al., 2001). Equilibrated
KT/V values can be also calculated using an alternative equation by Daugirdas and
Progress in Hemodialysis – From Emergent Biotechnology to Clinical Practice
4
Schneditz (Daugirdas & Schneditz, 1995), or the formula derived from observations during
the HEMO Study (Depner et al., 1999; Eknoyan et al., 2002; Daugirdas et al., 2004), or that
introduced by Tattersall et al. (Tattersall et al., 1996).
The usage of the KT/V index as a sole and optimal measure of dialysis dose is questioned
by many authors. Fractional solute removal (FSR) and equivalent continuous clearance
(ECC) are two such alternative options, which can be used instead of KT/V. FSR was
suggested by Verrina et al. (Verrina et al., 1998) and Henderson (Henderson, 1999) for
comparative studies of various dialysis modalities and schedules. By definition FSR is the
removed mass over the reference solute mass in the body. The concept of FSR is closely
related to the concept of the solute removal index (SRI) proposed by Keshaviah (Keshaviah,
1995). Standard KT/V (stdKT/V), introduced by Gotch, is another variant of FSR (Gotch,
1998). The time-average solute concentration (C
ta
) has been introduced to define ‘equivalent
renal clearance’ (EKR), as a solute removal rate over C
ta
(Casino & Lopez, 1996). Using other
reference concentrations in the definition of EKR instead of C
ta
, the general idea of
equivalent continuous clearance, ECC, can be formulated (Waniewski et al., 2006;
Waniewski et al., 2010). There are at least four different reference methods: 1) peak, p,
2) peak average, pa, 3) time average, ta, and 4) treatment time average, trta, reference values
of volume, mass, and concentration applied in KT/V, FSR and ECC (Waniewski et al., 2006;
Waniewski et al., 2010). KT/V, FSR and ECC are mathematically related for the same
reference method. However, the choice of an adequacy index and the respective reference
method is not obvious. It is not possible to decide whether this or the other definition is
better although some authors have declared their preferences (Keshaviah, 1995; Casino &
Lopez, 1996; Verrina et al., 1998; Henderson, 1999). The difference between different
hypotheses and the indices based on them may be investigated theoretically, but the choice,
if any, may be done only on the basis of a large set of clinical data. Future research should
hopefully provide more information about the relationship between various definitions and
the probability of clinical outcome in dialyzed patients.
Recent studies report some advantages of low-efficiency, frequent schedule over short, high-
efficiency HD (Depner, 1998; Charra et al., 2004). The two compartment variable volume
urea kinetic model can be applied to examine the whole set of dialysis adequacy indices in
different dialysis treatments, e.g. 1) conventional HD with 3 sessions per week, 2) daily HD
with 6 sessions per week and 3) nocturnal HD with 6 long sessions using typical patient and
treatment parameters. The peak average reference method used in FSR and ECC
calculations seem to be a more sensitive to the frequency and time of dialysis than the
method based on time average reference (Waniewski et al., 2006; Waniewski et al., 2010).
The unified approach to the definition of dialysis adequacy indices proposed by Waniewski
et al. is valid for all modalities of dialysis performed in end-stage renal disease and acute
renal failure patients and for the assessment of residual renal function (Waniewski et al.,
2006; Debowska et al., 2010; Waniewski et al., 2010). The integrated system of dialysis
adequacy indices takes into account all currently applied indices and allows to explain their
relationships and specificities.
The theory and practical application of this system of adequacy indices are here presented
on the basis of our previous publications and a (unpublished) PhD thesis (Waniewski &
Lindholm, 2004; Debowska & Waniewski, 2005; Debowska et al., 2005; Waniewski et al.,
2006; Debowska et al., 2007a; Debowska et al., 2007b; Debowska et al., 2010; Waniewski et
al., 2010).
Kinetic Modeling and Adequacy of Dialysis
5
2. Theory of fluid and solute transport in hemodialysis
The mathematical description of hemodialysis includes two parts: 1) one part that explains
the fluid and solute transport across a semi-permeable membrane of the dialyzer, and 2) one
part that characterizes the global solute transport between removal device and patient.
2.1 Solute and fluid transport in dialyzer
The fluid and solute transport in dialyzer consists of two processes: transport through a
permselective membrane between blood and dialysate and transport in blood and dialysate
channels.
The theoretical description of transport through a permselective membrane is based on
phenomenological (thermodynamic) descriptions according to the Staverman-Kedem-
Katchalsky-Spiegler approach (Staverman, 1951; Kedem & Katchalsky, 1958; Katchalsky &
Curran, 1965; Spiegler & Kedem, 1966; Weryński & Nowosielcew, 1983; Werynski &
Waniewski, 1995; Waniewski, 2006). Diffusion is the dominant factor for small solute
transport in hemodialyzer. The transport due to convection prevails in hemofilters, plasma
separators, etc. In hemodialyzer with highly permeable membrane used in
hemodiafiltration, the convective transport component plays a leading role in the removal of
middle molecules and small proteins (Werynski & Waniewski, 1995).
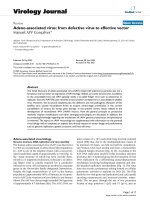
Considering the dialyzer as shown in Fig. 1, the system will soon after the start of dialysis be
at the quasi-steady state with the mass balance:
(
)
(
)
b,i b,i d,i d,i b,i v b,o d,i v d,o
QC QC Q Q C Q Q C+=− ++ (1)
where Q
b,o
= Q
b,i
– Q
v
and Q
d,o
= Q
d,i
+ Q
v
are the rates of blood and dialysate flows at the
outlet of hemodialyzer, respectively, Q
v
is ultrafiltration rate, C
b,i
and C
d,i
are the inlet blood
and dialysate concentrations and C
b,o
and C
d,o
are the outlet blood and dialysate
concentrations, respectively.
Fig. 1. Schematic description of concentration and flows in dialyzer.
After rearrangement of equation (1):
(
)
(
)
b,i b,i b,o v b,o d,i d,o d,i v d,o
QC C QC QC C QC−+ = −+ (2)
The left side of equation (2) represents the solute leaving the blood; the right side is the
solute appearing in dialysate. The first term on each side of equation (2) is the diffusive
component of flux and the second term represents the convective contribution.
At any specific blood and dialysis fluid flow rates, the diffusive dialysance D is the change
in solute amount of incoming blood over concentration driving force (C
b,i
– C
d,i
):
C
d,o
, Q
d,o
C
b,o
, Q
b,o
C
b,i
, Q
b,i
C
d,i
, Q
d,i
Progress in Hemodialysis – From Emergent Biotechnology to Clinical Practice
6
(
)
(
)
b,i b,i b,o d,i d,o d,i
b,i d,i b,i d,i
QC C QC C
D
CC CC
−−
==
−−
(3)
Assuming that solute concentration in the inflowing dialysate is zero (C
d,i
= 0) equation (3)
yields the definition of diffusive clearance K:
(
)
b,i b,i b,o
b,i
QC C
K
C
−
= (4)
Dialyzer clearance is a parameter that describes the efficiency of membrane devices, i.e. the
solute removal rate from the blood related to blood solute concentration at the inlet to the
hemodialyzer (Darowski et al., 2000; Waniewski, 2006).
Ultrafiltration Q
v
from blood to dialysate increases diffusive solute transport from blood to
dialysate and therefore the clearance of the hemodialyzer or hemofilter may be described as:
0rv
KK TQ
=
+⋅ (5)
where K
0
is the diffusive clearance for Q
v
= 0 and T
r
is the transmittance coefficient
(Werynski & Waniewski, 1995; Darowski et al., 2000; Waniewski, 2006). Although the
dependence of K on Q
v
in the one-dimensional theory is slightly nonlinear, one may assume
the linear description used in equation (5) that was confirmed experimentally with high
accuracy (Waniewski et al., 1991). T
r
may be estimated from the experimental data using the
equation:
0
r
v
KK
T
Q
−
= (6)
The measurements of K
0
and K for a few different values of Q
v
allow determining T
r
using
equation (6) and linear regression.
2.2 One and two compartment models for the distribution of fluid and solutes in the
body
Compartment models consider the patient body as a single compartment (thick line in Fig.
2) or as two compartments: intracellular and extracellular (dashed line in Fig. 2).
The one compartment model of the solute distribution volume assumes that solute mass,
M
b
, is distributed in the body in a single, homogenous pool of volume V
b
with concentration
C
b
. The two compartment model assumes that body fluid is divided into two parts: one
directly (extracellular compartment, described by solute mass M
e
, concentration C
e
and fluid
volume V
e
) and one indirectly (intracellular compartment, with solute mass M
i
,
concentration C
i
and fluid volume V
i
) accessible for dialysis (Schneditz & Daugirdas, 2001).
It is assumed that solute generation, at the rate G, and water intake, at the rate G
w
, occur
only in the extracellular space. In the two compartment model, solute and water removal by
the kidneys, with clearances K
r
and K
rw
, respectively, are also related only to the
extracellular compartment.
Some authors use more general terminology for the two compartment model with perfused
and non-perfused compartments, without deciding a priori about their physiological
interpretation. This terminology may be used for the description of the distribution of small
Kinetic Modeling and Adequacy of Dialysis
7
Fig. 2. One and two compartment models for the distribution of water and solutes in the body.
solutes (as urea and creatinine) and proteins (as β
2
-microglobulin). In some papers,
extracellular and intracellular water were called perfused and non-perfused compartments,
respectively (Clark et al., 1999; Leypoldt et al., 2003; Leypoldt et al., 2004).
In one compartment model the rate of the change of solute mass in the body,
dM
b
/dt = d(C
b
V
b
)/dt, and in dialysate, dM
d
/dt = d(C
d
V
d
)/dt, during hemodialysis, are
described by the following ordinary differential equations:
(
)
()
()
()
⎧
=− − −
⎪
⎪
⎨
⎪
=−
⎪
⎩
bb
bd rb
dd
bd
dCV
GKC C KC
dt
dCV
KC C
dt
(7)
In the two compartment model, the removal of solute by the dialyzer with clearance K and
by the kidneys with residual clearance K
r
, is a function of the solute concentration in the
extracellular compartment, C
e
, but indirectly depends also on the intercompartmental mass
transport coefficient K
c
:
(
)
()( )
()
()
()
()
⎧
=−−−+−
⎪
⎪
⎪
=− −
⎨
⎪
⎪
=−
⎪
⎩
ee
ci e e d re
ii
ci e
dd
ed
dVC
KC C KC C GKC
dt
dVC
KC C
dt
dVC
KC C
dt
(8)
For urea and creatinine, C
d
= 0 in standard hemodialysis and hemofiltration treatments,
because fresh dialysis fluid without these solutes is continuously provided. The rate of total
solute mass removal from the body, dM
R
/dt, during hemodialysis is:
()
=−+
R
ed re
dM
KC C KC
dt
(9)
G, G
w
Patient body
K, Q
v
K
c
K
r
, K
rw
Dialyzer
M
d
, C
d
, V
d
Extracellular
compartment
M
e
, C
e
, V
e
Intracellular
compartment
M
i
, C
i
, V
i
M
b
, C
b
, V
b
Progress in Hemodialysis – From Emergent Biotechnology to Clinical Practice
8
The total solute amount removed from the body ΔM
R
is the mass removed by dialyzer with
clearance K and by the kidneys with residual clearance K
r
. The solute removal by dialyzer is
proportional to the solute concentration gradient between dialysate and extracellular
compartment (C
e
– C
d
) when using the two compartment model. In the one compartment
model, the body solute concentration C
b
is used in equation (9) instead of C
e
.
In the two compartment model, the changes of fluid volume in extracellular and
intracellular compartments, V
e
(t) and V
i
(t), respectively, are assumed to be proportional to
the volumes of these compartments (Canaud et al., 1995; Clark et al., 1998; Ziolko et al.,
2000):
(
)
ebi b
V(t) α V(t),V(t) 1 α V(t)=⋅ = − ⋅ (10)
where α is usually about 1/3, V
b
for urea and creatinine is assumed to be equal to total body
water (TBW) and V
b
as well as V
e
can be measured by bioimpedance (Zaluska et al., 2002).
During HD the change of solute distribution volume is described by a linear relationship:
(
)
bb0
V(t) V t β t
=
+⋅ (11)
where V
b
(t
0
) is the initial volume of solute distribution and the rate of volume change:
wrw v
β GK Q=− −
(12)
consists of water intake with rate G
w
, residual water clearance K
rw
and ultrafiltration with
rate Q
v
.
3. Hemodialysis efficiency: history and definitions of dialysis adequacy
indices
The questions concerning how to quantify dialysis dose and how much dialysis should be
provided, are controversial and have been debated since the beginning of the dialysis
treatment era. Between 1976 and 1981, the National Cooperative Dialysis Study (NCDS) was
performed in the United States to establish objective, quantitative criteria for the adequate
dose of dialysis (Gotch & Sargent, 1985; Sargent & Gotch, 1989; Locatelli et al., 2005). It
included 165 patients and had a 2 x 2 factorial design: the patients were randomized to two
different midweek pre-dialysis blood urea nitrogen (BUN) levels (70 vs. 120 mg/dL) and
two different treatment times (2.5 - 3.5 vs. 4.5 – 5.0 h).
Concentration targeting in this study used a time average BUN concentration (C
ta
) of
50 mg/dL (groups I and III) and 100 mg/dL (groups II and IV). Dialysis time was fixed for the
protocol; hence, dialyzer clearance was the main treatment parameter that was adjusted. A one
compartment variable volume model was used to prescribe and control the treatment. Urea
kinetic modeling was applied to determine protein catabolic rate (pcr) and the parameters of
dialysis necessary to achieve a specified BUN level with thrice weekly treatments. BUN
changes in an individual patient were quantified as the product of dialyzer urea clearance (K,
mL/min) and the treatment time (T, min), normalized to the urea distribution volume (V, mL).
KT/V exponentially determines the total decrease in BUN during a dialysis treatment:
KT
V
post pre
CCe
−
= (13)
Kinetic Modeling and Adequacy of Dialysis
9
C
post
and C
pre
are postdialysis and predialysis blood urea concentration. KT/V was
prescribed in the NCDS as a function of pcr and C
pre
:
pre
KT 0.49pcr 0.16)
ln 1
VC
⎛⎞
−
−= −
⎜⎟
⎜⎟
⎝⎠
(14)
The primary analysis showed that morbidity was less at lower levels of urea C
ta
and the
number of deaths in patients assigned to groups II and IV was very high (Parker et al., 1983).
No significant effect of treatment time was found, although there was a clear trend towards
a benefit from longer dialysis (p = 0.06).
The ‘mechanistic’ analysis of the NCDS data done by Gotch and Sargent launched the issue
of urea KT/V (Gotch & Sargent, 1985). The patient groups II and IV, with high BUN, had
low KT/V values at all levels of pcr and the groups I and III, with low pcr, had low levels of
BUN and KT/V. For Kt/V > 0.8 the data base was comprised almost entirely of patient
groups I and III with pcr > 0.8. KT/V < 0.8 provided inadequate dialysis with high
probability of failure irrespective of pcr.
The factor KT/V was described as the “fractional clearance of urea” (Gotch & Sargent, 1985).
If K is the urea clearance and T is time, the term KT is a volume. The ratio of KT to V
expresses the fraction of the urea distribution volume that is totally cleared from urea.
3.1 Fast hemodialysis: two compartment effects, single-pool and equilibrated KT/V
The human body has a large number of physical compartments. The mathematical
description of body is usually simplified by considering it as single pool (one compartment)
or as a few interconnected pools. In a multicompartment model, the solute and fluid
transport between body spaces should be described.
The one compartment model assumes that the body acts as a single, well mixed space and is
characterized by: 1) high permeability of cells to the solute being modeled, 2) rapidly flowing
blood that transports the solute throughout a totally perfused body. The assumptions of one
compartment model for urea or creatinine during dialysis are valid as long as the flux of solute
into and out of cells is faster than the flux of solute from the extracellular space accessible to
dialysis. When the intercompartment flow between body compartments is too slow and
constrained in comparison with the solute removal rate from the perfused compartment, then
the solute behavior increasingly deviates from that of one compartment kinetics.
With the available high efficiency dialyzers and the tendency to short-time, rapid dialysis at
least the two compartment modeling appears to be necessary. The two compartment model
assumes solute generation to and removal from the perfused space, which is for urea and
creatinine typically the extracellular compartment. This assumption is considered
reasonable because urea is produced in the liver and enters body water from the systemic
circulation (Sargent & Gotch, 1989). Regarding creatinine, in most studies the previously
determined urea distribution volumes for each patient were successfully used as an
approximation for creatinine distribution space (Canaud et al., 1995; Clark et al., 1998;
Waikar & Bonventre, 2009).
The perfused (extracellular) compartment communicates with the non-perfused
compartment (intracellular) according to the concentration gradient with an
intercompartmental mass transport coefficient (K
c
, mL/min). For a low value of K
c
, the
Progress in Hemodialysis – From Emergent Biotechnology to Clinical Practice
10
discrepancy between one and two compartment modeling is larger because the immediate
intercompartmental flow is precluded (Debowska et al., 2007b).
Assuming one compartment model, a fixed distribution volume (no ultrafiltration) and no
generation during the dialysis, as during a short HD session, the concentration of any solute
can be described by the equation (Sargent & Gotch, 1989; Daugirdas et al., 2001):
Kt/V
tpre
CC e
−⋅
=⋅ (15)
where C
t
is the blood concentration of the solute at any time t during dialysis, C
pre
is the
blood concentration at the beginning of HD, K is the clearance of applied dialyzer, and V is
the solute distribution volume.
The single pool KT/V (spKT/V) for urea is determined from equation (15) as the natural
logarithm (ln) of the ratio of postdialysis (C
post
) to predialysis (C
pre
) plasma urea
concentrations (Gotch & Sargent, 1985; Daugirdas et al., 2001):
post
pre
C
spKT /V ln
C
⎛⎞
=−
⎜⎟
⎜⎟
⎝⎠
(16)
The expression 1 – C
post
/C
pre
, is called urea reduction ratio (URR):
URR 1 R
=
− (17)
where
post
pre
C
R
C
=
(18)
A solute like urea or creatinine is however removed during hemodialysis more efficiently
from the extracellular than from the intracellular compartment and its concentration in
plasma falls faster than expected when assessed by one compartment modeling; this effect is
called urea inbound (Daugirdas et al., 2001), Fig. 3. When dialysis is completed, the flow
from intracellular to extracellular compartment causes a fast increase of postdialysis urea
concentration in plasma, i.e., urea rebound (Daugirdas et al., 2001; Daugirdas et al., 2004),
Fig. 3. Even if solute removal from a compartment directly accessible to dialyzer is relatively
efficient during an intermittent therapy, the overall solute removal may be limited by slow
intercompartmental mass transfer. Urea concentration measured in plasma represents the
extracellular urea concentration.
The effects of urea generation and urea removal due to solute convective transport that are
not included in the basic relation between spKT/V and URR can be corrected by Daugirdas
formula (Daugirdas, 1993):
spKT/V ln(R 0.008 T) (4 3.5 R) UF/W
=
−− ⋅+−⋅⋅ (19)
where T is treatment time in hour, UF is ultrafiltration volume and W is the postdialysis
weight (in kilograms). Single-pool kinetics overestimates however the removed amount of
urea because of the postdialysis urea rebound, which is an compartmental effect, and
therefore the equilibrated KT/V (eqKT/V) was introduced to clinical practice to be
estimated by the following formula (Daugirdas et al., 2001):
eq eq
eqKT/V ln(R 0.008 T) (4 3.5 R ) UF/W
=
−−⋅+−⋅⋅ (20)
Kinetic Modeling and Adequacy of Dialysis
11
0 1 2 3 4 5 6 7 8 9 10 11
0.2
0.4
0.6
0.8
1
1.2
Time, h
Urea concentration, mg/mL
C
pre
C
post
inbound
rebound
Fig. 3. The phenomena of the intradialytic drop in urea concentration in plasma (inbound),
and the postdialysis increase in urea concentration in plasma (rebound).
where
eq
eq
0
C(T )
R
C
=
(21)
C(T
eq
) is the urea concentration 30 to 60 minutes after the dialysis session. The eqKT/V is
typically about 0.2 KT/V unit lower than the spKt/V, but this difference depends on the
efficiency, or rate of dialysis (Daugirdas et al., 2001). Equilibrated KT/V values can be also
calculated using an alternative equation, as described by Daugirdas and Schneditz
(Daugirdas & Schneditz, 1995):
spKT /V
eqKT /V spKT/V 0.6 0.03
T
=−⋅+
(22)
or the formula derived from observations during the HEMO Study (Depner et al., 1999;
Eknoyan et al., 2002; Daugirdas et al., 2004):
spKT /V
eqKT/V spKT/V 0.39
T
=−⋅
(23)
or that introduced by Tattersall et al. (Tattersall et al., 1996):
T
eqKT/V spKT/V
T36
=⋅
+
(24)
where T indicates treatment time in minutes. Equations (22) and (23), were derived from
regression using the rebounded BUN measured 30 or 60 minutes after dialysis. The
Tattersall equation was derived from theoretical considerations of disequilibrium and
rebound, but the coefficient was derived from fitting to clinical data.
Progress in Hemodialysis – From Emergent Biotechnology to Clinical Practice
12
3.2 Urea KT/V and creatinine clearance for the kidneys
To assess the residual renal function (RRF) urine is usually collected for 24 hours and
analyzed for urea as well as creatinine (Daugirdas et al., 2001). Residual renal clearance for a
particular substance can be calculated as follows:
urine urine r
r
e urine e urine e
excretion rate
CV 1ΔM1
K
CTCTC
=== (25)
where V
urine
is urine volume, C
urine
is solute concentration in urine, T
urine
is time of urine
collection, C
e
is plasma solute concentration and ΔM
r
is solute mass removed by the
kidneys. Weekly KT/V for the kidney for 1 week time is expressed as follows:
()
urine urine r
RRF
eb b
7C V 7ΔM
weekly KT /V
CV M
⋅⋅
== (26)
where M
b
is solute mass in the body, V
b
is TBW and other symbols have the same meaning
as in equation (25).
In clinical practice, the most popular methods used for evaluation RRF is creatinine
clearance (Cl
Cr
), calculated as follows:
R,Cr
Cr , RRF
e,Cr
7 ΔM
1.73
weekly Cl
1week C BSA
⋅
=
⋅
(27)
where ΔM
R,Cr
is creatinine total mass removed during one day due to therapy and by
residual renal function, C
e,Cr
is serum creatinine concentration, BSA is body surface area and
1.73 is the average BSA for a typical human. Weekly creatinine clearance is the most often
expressed in L for 1 week.
3.3 Equivalent renal clearance (EKR)
In a steady state, during continuous dialytic treatment or/and with renal function, the
solute generation rate G is balanced by the solute removal rate K
ss
determining in this way
the constant concentration C
ss
within the patient body (Gotch, 2001):
ss ss
CG/K= (28)
The K
ss
is defined by rearrangement of equation (28):
ss ss
KG/C
=
(29)
Calculation of a continuous clearance K
ss
, equivalent to the amount of dialysis provided by
any intermittent dialysis schedule, K
eq
, requires calculation of G and the concentration
profile, and selection of a point on this profile, which may be considered to be equivalent to,
e.g. weekly, the oscillating concentration (C
eq
) according to: K
eq
= G/C
eq
. This approach to
the clearance calculation has been reported using different definitions of C
eq
. The peak
concentration hypothesis defined C
eq
as the maximum solute concentration, within e.g. one
week duration. The mean predialysis (peak average) solute concentration was used to define
standard K (stdK) (Gotch, 1998). The time-average solute concentration (C
ta
) has been
introduced to define ‘equivalent renal clearance’ (EKR) (Casino & Lopez, 1996):
Kinetic Modeling and Adequacy of Dialysis
13
ta
G
EKR
C
= (30)
The equation (30) may be used in metabolically stable patients, whereas in acute renal failure
patients the definition for EKR requires a more unifying form (Casino & Marshall, 2004):
R
ta
ΔM/T
EKR
C
= (31)
where ΔM
R
is total solute amount removed by replacement therapy and the kidneys, and T
is arbitrary assumed time. EKR, in the form of equation (31), is determined as solute
removal rate over time average solute concentration.
3.4 Standardized KT/V
Taking into account the average predialysis urea concentration, Gotch introduced the
standard KT/V (stdKT/V) concept to measure the relative efficiency of the whole spectrum
of dialytic therapies whether intermittent, continuous or mixed (Gotch, 1998). The stdKT/V
was defined with a relation between urea generation, expressed by its equivalent
normalized protein catabolic rate (nPCR) and the peak average urea concentration (C
pa
) of
all the weekly values (Gotch, 1998; Diaz-Buxo & Loredo, 2006):
pa
0.184(nPCR 0.17) V 0.001 7 1440
stdKT /V
CV
−⋅⋅ ⋅
=⋅ (32)
where 0.184(nPCR – 0.17) V·0.001 is equal to urea generation rate G (mg/min), V is body
water in mL and 7·1440 is number of minutes in one week´s time. Predialysis urea
concentration (C
pa
) - for any combination of frequency of intermittent HD (IHD), automated
peritoneal dialysis (APD) and continuous dialysis between IHD or APD sessions - was
defined as follows (Gotch, 1998):
()
()
()
()()
()
()()
()
()
()()
+− +−
−−
−
+−
−
−
−+−
⋅+
=
−
⎛⎞
⎜⎟
⎜⎟
⎝⎠
pr pr
pr
K K 7 / N 1440 T K K 7 / N 1440 T
eqKT / V
VV
pr
pa
K K 7 / N 1440 T
eqKT /V
V
GG
1e e 1e
spKT /V V/T K K
C
1e e
(33)
where K, K
p
and K
r
are dialyzer, peritoneal and renal urea clearances, respectively, T is
duration of treatment sessions, N is the frequency of IHD or APD per week and eqKT/V is
the equilibrated KT/V calculated according to equation (22).
Assuming a symmetric weekly schedule of dialysis sessions, no residual renal function, and
a fixed solute distribution volume V, Leypoldt et al. obtained an analytical relationship
between stdKT/V, spKT/V and eqKT/V (Leypoldt et al., 2004):
eqKT /V
eqKT /V
1e
10080
T
stdKT /V
1 e 10080
1
spKT /V N T
−
−
−
=
−
+
−
⋅
(34)