Keeping Track of Our Changing Environment pot
Bạn đang xem bản rút gọn của tài liệu. Xem và tải ngay bản đầy đủ của tài liệu tại đây (4.83 MB, 110 trang )
A
Globalization
+ 0.4˚C
300
million ha forest area loss
technology
change
B
© 2011 United Nations Environment Programme
Publication: Keeping Track of Our Changing Environment: From Rio to Rio+20 (1992-2012)
United Nations Environment Programme, Nairobi. Published October 2011
ISBN: 978-92-807-3190-3
Job Number: DEW/1234/NA
This Report has been prepared within the framework of UNEP’s fth Global Environment Outlook (GEO-5) reporting process. It
complements the detailed information on the status and trends of the global environment and information on related policy measures.
Disclaimers
The content and views expressed in this publication are those of the authors and do not necessarily reect the views or policies, or carry
the endorsement of the contributory organisations or the United Nations Environment Programme (UNEP). The designations employed and
the presentation of material in this publication do not imply the expression of any opinion whatsoever on the part of UNEP concerning the
legal status of any country, territory or city or its authorities, or concerning the delimitation of its frontiers and boundaries. Reference to a
commercial company or product in this publication does not imply the endorsement of UNEP.
© Maps, photos, and illustrations as specied.
Reproduction
This publication may be reproduced in whole or in part and in any form for educational or non-prot purposes without special permission
from the copyright holder, provided acknowledgement of the source is made. UNEP would appreciate receiving a copy of any publication
that uses this publication as a source. No use of this publication may be made for resale or any other commercial purpose whatsoever
without prior permission in writing from UNEP. Applications for such permission, with a statement of purpose and intent of the reproduction,
should be addressed to the Director, Division of Communications and Public Information (DCPI), UNEP, P.O. Box 30552, Nairobi 00100,
Kenya. The use of information from this publication concerning proprietary products for publicity or advertising is not permitted.
This publication was printed on 100 Per Cent chlorine free paper from sustainable managed forests using vegetable inks and
water-based varnish.
Citation
UNEP (2011). Keeping Track of Our Changing Environment: From Rio to Rio+20 (1992-2012).
Division of Early Warning and Assessment (DEWA), United Nations Environment Programme (UNEP), Nairobi
Produced by
UNEP Division of Early Warning and Assessment
United Nations Environment Programme
P.O. Box 30552
Nairobi, 00100, Kenya
Tel: (+254) 20 7621234
Fax: (+254) 20 7623927
E-mail:
Web: www.unep.org
This publication is available from
UNEP
promotes environmentally sound
practices globally and in its own activities. This
publication is printed on 100 Per Cent chlorine free paper
from sustainably managed forests. Our distribution policy
aims to reduce UNEP’s carbon footprint.
i
Keeping Track of Our Changing Environment
From Rio to Rio+20 (1992-2012)
ii
Foreword
In 1992, the rst United Nations Conference on Sustainable
Development, popularly known as the Rio Earth Summit, was convened
in Rio de Janeiro, Brazil to address the state of the environment and
sustainable development. The Earth Summit yielded several important
agreements including “Agenda 21”, a plan of action adopted by over
178 governments to address human impacts on the environment at
local, national and global levels, and key treaties on climate change,
desertication and biodiversity. At the second Conference in 2002—the
World Summit on Sustainable Development—governments agreed
on the Johannesburg Plan of Implementation, reafrming their
commitment to Agenda 21. In 2012, the United Nations Conference
on Sustainable Development, or Rio+20 Earth Summit, will focus
on the Green Economy in the context of sustainable development,
poverty eradication, and the institutional framework for sustainable
development. The object is to renew political commitment to
sustainable development, review progress and identify implementation
gaps, and address new and emerging challenges.
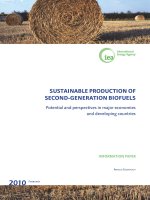
This publication serves as a timely update on what has occurred
since the Earth Summit of 1992 and is part of the wider Global
Environment Outlook-5 (GEO-5) preparations that will lead to the
release of the landmark GEO-5 report in May 2012. It underlines
how in just twenty years, the world has changed more than most of
us could ever have imagined—geopolitically, economically, socially
and environmentally. Very few individuals outside academic and
research communities envisaged the rapid pace of change or foresaw
developments such as the phenomenal growth in information and
communication technologies, ever-accelerating globalisation, private
sector investments across the world and the rapid economic rise of
a number of “developing” countries. Many rapid changes have also
taken place in our environment, from the accumulating evidence
of climate change and its very visible impacts on our planet, to
biodiversity loss and species extinctions, further degradation of land
surfaces and the deteriorating quality of oceans. Certainly, there have
been some improvements in the environmental realm, such as the
signicant reduction in ozone-depleting chemicals and the emergence
of renewable energy sources, new investments into which totalled
more than $200 thousand million in 2010. But in too many areas,
the environmental dials continue to head into the red.
This innovative report is based entirely on statistical data and indicators
and shows where the world stands on many social, economic and
environmental issues as we enter the second decade of the 21st century.
Drivers of environmental change including population increase and
economic growth, and especially the status of natural resources and
landscapes, are clearly illustrated. Numbers plotted on straightforward
graphs show upward and downward trends, which, along with satellite
images, tell the story of dramatic changes.
Maintaining a healthy environment remains one of the greatest global
challenges. Without concerted and rapid collective action to curb and
decouple resource depletion and the generation of pollution from
economic growth, human activities may destroy the very environment
that supports economies and sustains life.
The upcoming Rio+20 Conference presents a timely, global-level
opportunity to address one of its own stated objectives: to assess
progress and gaps in implementing goals as part of an acceleration
and scaling-up of transformative actions, programmes and policies. As
we move towards the Rio+20 Conference in an ever-more globalised
and integrated world, the need to chart progress towards a global
Green Economy and more efcient and effective international
environmental governance becomes vital. Without quantied targets,
our environmental goals cannot turn theory into reality. Numeric and
time-bound targets have certainly aided in progress made towards the
Millennium Development Goals (MDGs), for example, and should be
applied towards our environmental objectives as well.
This publication helps to tell the story of where the world was 20
years ago and where we collectively stand today, and to show the
direction in which we need to move in a post-Rio+20 world. It also
highlights the missing pieces in our knowledge about the state of
environment— such as those related to freshwater quality and quantity,
ground water depletion, ecosystem services, loss of natural habitat, land
degradation, chemicals and waste—due to lack of regular monitoring,
collection and compilation of data. Scientically-credible data for
environmental monitoring remains inadequate and the challenge of
building in-country capacity to produce better policy-relevant data
needs urgent attention.
We hope this report will inform all those participating in the Rio+20
events and the entire process and help set the world on a path towards
a more sustainable environment.
Achim Steiner
United Nations Under-Secretary-General
and Executive Director, UNEP
iii
Table of Contents
iv Introduction & Scope
v What’s New Since Rio 1992?
vii Goals & Targets in the
Global Environment
Population & Human Development
2 Total Population
2 Historical World Population
3 Population Growth Rate
4 Urban Population
5 Megacities
5 Top 10 Megacities
6 Population in China’s Pearl River Delta
(Satellite Image)
7 People Living in Slums
8 Age Distribution
8 Life Expectancy
9 Food Supply
10 Human Development Index
11 Proportion of Seats Held by Women
in National Parliaments
Economy
13 GDP per Capita, Total
13 GDP per Capita, Change
14 Per Capita Gross Domestic Product
14 Gross Domestic Product–per Capita (Map)
15 Trade
16 Global Materials Extraction
17 Resource Efciency
Environmental Trends
Atmosphere
21 Emissions of CO
2
- Total
21 Emissions of CO
2
- per Capita
22 Emissions of CO
2
- Total, by Type
22 Emissions of CO
2
- Change, by Type
23 Emissions of CO
2
per GDP
24 GHG Emitters by Sector
25 Consumption of Ozone-Depleting Substances
25 Ozone Hole, Area and Minimum Ozone
26 Ozone Hole Images
Climate Change
28 Atmospheric CO
2
Concentration/Keeling Curve
29 Global Annual Mean Temperature Anomaly
29 Temperature Deviation 2000-2009 vs. Mean
1951-1980 (Map)
30 Warmest Years on Record
31 Earth Global Temperature Changes by Latitude
32 Ocean Temperature Deviation
32 Global Mean Sea Level
33 Ocean Acidication
34 Mountain Glacier Mass Balance
35 September Arctic Sea Ice Extent
35 September Arctic Sea Ice Extent (Satellite Image)
Forests
37 Forest Net Change
37 Mangrove Forest Extent
38 Mato Grosso, Amazon Rainforest (Satellite Image)
39 Forest Plantation Extent
39 Roundwood Production
40 Certied Forest Area
Water
42 Improved Sanitation & Drinking Water Coverage
43 Mesopotamian Marshlands (Satellite Image)
Biodiversity
45 Living Planet Index
46 Red List Index
47 Protected Areas, Total Area
47 Protected Areas, Per cent
Chemicals & Waste
49 Oil Spills from Tankers
50 Plastics Production
Natural Hazards
52 Impacts of Natural Disasters
52 Reported Natural Disasters
53 Floods–Mortality Risk, Exposure and Vulnerability
53 Tropical Cyclones - Mortality Risk, Exposure
and Vulnerability
Governance
55 Multilateral Environmental Agreements, Number
and Signatories
55 Number of MEAs Signed (Map)
56 ISO 14001 Certications
57 Carbon Market Size
58 Total Foreign Aid and Environmental Aid
59 Aid Allocated to Environmental Activities
Agriculture
61 Food Production Index
62 Cereal Production, Area Harvested
and Fertilizer Consumption
63 Total Area Equipped for Irrigation
64 Saudi Arabia Irrigation Project (Satellite Image)
65 Organic Farming
66 Selected Crops in Humid Tropical
Countries, Area
66 Selected Crops in Humid Tropical Countries,
Change in Area
67 Grazing Animal Herds
Fisheries
69 Exploitation of Fish Stocks
70 Total Fish Catch
70 Tuna Catches
71 Fish Catch and Aquaculture Production
72 Shrimp and Prawn Aquacultures (Satellite Image)
Energy
74 Energy Consumption per Capita - Total
74 Energy Consumption per Capita - Change
75 Electricity Production
75 Electricity Production per Capita
76 Nightlights
77 Primary Energy Supply
78 Renewable Energy Supply, Total
78 Renewable Energy Supply, Change
79 Biofuels Production
80 Investment in Sustainable Energy
81 Nuclear Power Plants
81 Electricity Production & Nuclear Share
82 Oil Sands (Satellite Image)
Industry, Transport & Tourism
84 Cement & Steel Production
85 Air Transport
86 International Tourism, Arrivals
Technology
88 Internet Users & Mobile Phone Subscribers
90 Epilogue
91 Data Sources
93 References
93 Acronyms
97 Technical Notes
98 Annex for Aid To
Environmental Activities
99 Acknowledgments
iv
Introduction & Scope
This publication was conceived with the idea of showing how
the planet has changed in two decades—just twenty years—
since decision-makers met at the United Nations Conference
on Environment and Development in Rio de Janeiro. To
relay this information in a compelling and succinct manner,
environmental and related trends are charted and presented
using globally-aggregated (and mainly statistical) data sets
collected by international agencies, research bodies and other
ofcial entities.
Major economic, environmental, social and technological
trends are shown through numerically-based graphs, with their
upward, downward or stable trend lines as dictated by the
data. While most of these trends speak for themselves, short
explanations of the phenomena observed are also provided for
further elucidation. Also included are a number of illustrative
“before and after” satellite images, primarily covering the same
time period of 1992-2010 and showing environmental changes
at the local level. In some cases, these impacts are ongoing.
Scope and Methodology
Most of the time-series data were collected directly from
countries and aggregated to regional and global levels by
authoritative international agencies. The time series indicators
presented here are based on the best and most comprehensive
data available to date.
Three main criteria were used to select the indicators employed
in this publication. First, an approximately 20-year temporal
data record on which the trend charts could be based was
required, so as to accurately portray the time period in question.
In a few cases (and particularly for recent phenomena such as
carbon trading), a correspondingly shorter time period was used
to provide at least a partial picture to date. Second, the data on
which the charts are based had to be global in coverage—that
is, covering all or at least most countries so as to represent the
entire world and not only certain regions. Third, the data had
to be clearly sourced and taken from authoritative and reliable
institutions with extensive experience in the thematic areas
treated in each case.
To ensure reliability, indicator charts are only presented for areas
where all three data requirements were met. For areas where
one or another of the criteria was not met, such as freshwater
water availability, groundwater depletion, land degradation and
chemicals and waste, any analysis might not be reliable, and so
trends are not provided. Also, the availability of data related to
the environment and natural resources that are disaggregated
by gender (i.e., qualitatively) or sex (i.e., quantitatively) is
generally poor, especially for developing countries.
The implications of any shortcomings in the data are clear. To
promote evidence-based environmental policies and actions,
the underlying data needed to support sound decision-making
must be part of the equation and be of proven scientic
quality. Today, there are several reasons why the quality of
international statistics varies greatly. First, statistics may not
be available at the national level; second, the statistics that
are collected may be of poor quality or outdated; and third,
the comparability of statistics over time inherently presents
challenges. These deciencies and issues demonstrate the need
for a comprehensive data and information system to optimally
manage the vast array of related policy, scientic, technical,
methodological and practical issues. For this to be achieved,
the following steps are necessary:
(1) strengthen national-level capacity for collecting and
compiling environmental observations, especially where data
gaps exist;
(2) publish and provide access to data using various media; and
(3) develop services to efciently and rapidly provide information
to decision-makers in (an) understandable format(s).
Thus, a comprehensive capability at the global scale is needed
to pull together and analyze the wealth of data collections
that are available, and to enhance data collection for areas
where information may be lacking. Within these limitations, it
is hoped that this publication provides a clear and reasonably
comprehensive twenty-year story on the state and trends in
environment and development since 1992.
v
“What’s New?” since Rio 1992
In terms of environment, what did not exist or was not well-known in 1992?
In the twenty years since the rst Earth Summit in 1992, the
world has changed in ways most of us could not imagine.
The Internet, mobile phones and other information and
communications technologies have made the world a much
smaller place—and more of a ‘globalized village’. An estimated
ve billion people have subscribed to mobile phone services
and there are some two billion Internet users worldwide. Social
media have further increased connectivity in recent years, with
Facebook, for example, having more than 800 million users
since it was launched in 2004. At the same time, space-based
satellites can now even zoom in to street level, and provide
detailed images in real-time on sophisticated smart-phones.
We also see that economic power and production patterns are
shifting among regions to the East and South, and that overall
trade volumes are rising steeply.
Perhaps the ways in which our environment has changed are
not so immediately obvious to everyone, but they are at least as
signicant. Natural resources are being depleted or degraded—
sometimes before we realize it—and certain metals seem to
become “rare” all of a sudden. The ever-increasing demand
for resources such as water, energy, food, minerals and land
is driven by growing populations with rising incomes, while
in parallel these resources are increasingly constrained by
ecosystem changes, inherent variability of weather conditions
and resource productivity, and the impacts of climate change.
Within the context of the “mega-trends” taking place in
our rapidly changing world and society, a number of new
environmental issues and phenomena have arisen since 1992:
1992
2012
Evolution of the Internet: 1992-2012
vi
New Multilateral Environmental Agreements
and Conventions
Several new Multilateral Environmental Agreements (MEAs) and
Conventions have been established or entered into force in the
last two decades to address emerging global environmental
issues, including the United Nations Framework Convention
on Climate Change (UNFCCC), the Convention on Biological
Diversity (CBD), agreements related to chemicals (Basel,
Rotterdam and Stockholm Conventions), and the United Nations
Convention to Combat Desertication (UNCCD).
Awareness of Climate Change
Among much debate and controversy, Climate Change has
become a “hot topic” and entered the policy arena, topping
the global environmental agenda.
The Green Economy
Viable pathways for fundamentally shifting economic
development to become more low-carbon, climate resilient,
resource efcient, and socially inclusive, as well as for valuing
ecosystem services, are now being proposed widely and
increasingly pursued.
Carbon Trading and other Environmental Market Tools
Placing a monetary value on greenhouse gas emissions and
creating a market for trade in carbon is a new and increasingly
utilized concept to address climate change. Other new market
frameworks include biodiversity offset and compensation
programs, habitat credit trading and conservation banking, with
a goal toward reducing biodiversity loss and mainstreaming
impacts into economic decisions. Worldwide, at least 45
compensatory mitigation programs and more than 1 100
mitigation banks now exist (UNDP and GEF 2011).
Markets for Organic Products and Eco-labeling
Consumer demand for goods that are produced in a sustainable
way has boosted certication and eco-labeling, such as the
Forest Stewardship Council (FSC) and the Programme for the
Endorsement of Forest Certication (PEFC) for forest products,
the Marine Stewardship Council (MSC) for sh products, and
“bio” or organic labels for many agricultural products including
coffee, tea and dairy products.
Genetically Modied Organisms
Genetically Modied Organisms (GMOs) have been researched
for decades, but have gained widespread attention in recent
years, mainly due to prospects for increased food production.
However, they remain controversial for a variety of reasons.
Recycling
Although recycling efforts are only beginning in many parts
of the world, processing waste into new resources, products
and materials is becoming mainstream policy and practice in
several countries and regions.
Commercialization of Biofuels, Solar and Wind Energy
While the overall use of renewable energy is still modest,
biofuels are gaining a signicant market share, and wind and
solar power production is increasing steeply. Windmills and
solar panels are increasingly abundant, and in the transport
sector, hybrid cars have entered the streets and air transport
using biofuels are becoming a reality.
Chemicals Management
Management of toxic and other hazardous chemicals that
threaten human and ecosystem health has improved. A number
of deadly chemicals have been banned, and as of January 2010
the world is free of chlorouorocarbons (CFC) production.
Nano Materials
Nanotechnology offers signicant opportunities and benets
for industry and society at large, especially in the elds of
energy, health care, clean water and climate change. But debate
about this new technology continues and related potential
environmental hazards and risks could be emerging.
vii
Goals & Targets
in the global environment
One of the obstacles to achieving environmental goals set by the
international community is the lack of sufcient, solid data and
monitoring systems to measure progress. While for two of the
interdependent areas of sustainable development—economic
development and social development—the goals are normally
measured and tracked quantitatively, environmental targets
are largely dened in qualitative terms. On the other hand,
those environmental agreements for which specic numerical
targets were set, have been relatively successful. Already in
the 1960s, for example, the World Commission on Protected
Areas (WCPA) set a target of 10% of global land area to be
designated as formally protected; today, nearly 13% of the
world’s surface is now set aside as protected. Similarly, the
Montreal Protocol on Substances that Deplete the Ozone Layer
denes mandatory targets and specic timeframes within which
the required reductions must be met, and it conducts regular
reviews of phase-outs in accordance with scientic updates.
It has been hailed as perhaps the most effective environmental
agreement to date. More such initiatives are needed to promote
evidence-based environmental policies and measure progress.
The following is a summary of environment-related goals that
incorporate targets and indicators since 1992.
Specic Sets of Environmental Targets
The Millennium Development Goals (MDGs)
In September 2000, leaders from 189 nations agreed on a vision
for the future: a world with less poverty, hunger and disease;
greater survival prospects for mothers and their infants; better-
educated children; equal opportunities for women; a healthier
environment; and a world in which developed and developing
countries work in partnership for the betterment of all. This
vision took the shape of eight Millennium Development Goals
(MDGs), which provide a framework of time-bound targets
by which progress can be measured. A concise framework of
eight goals and 21 targets towards the MDGs was adopted,
along with 60 indicators to measure and show progress. While
environment as a crosscutting theme is part of several MDGs,
its signicance in the overall framework is most prominently
highlighted in MDG-7: Ensuring Environmental Sustainability.
MDG-7 is divided into four targets as set forth below. They
emphasize sustainability principles and reversing natural
resource degradation; reducing biodiversity loss; increasing
access to safe drinking water and sanitation; and improving
slums (Table 1).
Table 1: UN Millennium Development Goal-7
Goal 7: Ensure environmental sustainability targets Indicators
Target 7.A: Integrate the principles of sustainable 7.1 Proportion of land area covered by forest
development into country policies and programmes 7.2 CO
2
emissions, total, per capita and per $1 GDP (PPP)
and reverse the loss of environmental resources 7.3 Consumption of ozone-depleting substances
7.4 Proportion of sh stocks within safe biological limits
Target 7.B: Reduce biodiversity loss, achieving, by 7.5 Proportion of total water resources used
2010, a signicant reduction in the rate of loss 7.6 Proportion of terrestrial and marine areas protected
7.7 Proportion of species threatened with extinction
Target 7.C: Halve, by 2015, the proportion of people 7.8 Proportion of population using an improved drinking
without sustainable access to safe drinking water and water source
basic sanitation 7.9 Proportion of population using an improved sanitation facility
Target 7.D: By 2020, to have achieved a signicant 7.10 Proportion of urban population living in slums
improvement in the lives of at least 100 million
slum dwellers
viii
The World Summit on Sustainable Development
Additional environmental targets were subsequently adopted
in 2002 at the World Summit on Sustainable Development
(WSSD). These relate to: sheries; marine protection; biodiversity
loss; access to renewable energy; and phasing out of organic
pollutants (Table 2).
The Copenhagen Accord
In 2009, the Copenhagen Accord recognised the need for
emission targets that will hold the increase in global temperature
below 2°C —equated by scientists to a concentration level of
450 ppm (parts per million) of carbon dioxide in the atmosphere.
The Accord today is supported by 114 countries.
Aichi Biodiversity Targets
At its tenth meeting in Nagoya, Japan in October 2010, the
Convention on Biological Diversity (CBD) Conference of
the Parties adopted a revised and updated Strategic Plan for
Biodiversity for the 2011-2020 period, including the set of Aichi
Biodiversity Targets comprising ve strategic goals and 20 targets.
However, these targets have no clear numerical goals, except
the following ones:
Target 5: By 2020, the rate of loss of all natural habitats,
including forests, is at least halved and where feasible
brought close to zero, and degradation and fragmentation
is signicantly reduced.
Target 11: By 2020, at least 17% of terrestrial and inland
waters, and 10% of coastal and marine areas, especially
areas of particular importance for biodiversity and
ecosystem services, are conserved through effectively and
equitably managed, ecologically representative and well-
connected systems of protected areas and other effective
area-based conservation measures, and integrated into
the wider landscapes and seascapes.
To conclude, with specic quantitative goals being absent, the
above targets may read more like recommendations. However,
when goals incorporate numerical levels or values, the required
achievement is more clearly dened and potentially obtainable.
In fact, empirical evidence shows that goal-setting can work
when clear quantitative targets are set. Another lesson learned
from the history of environmental target-setting is that it works
best for well-dened issues, such as the phasing out of Ozone
Depleting Substances (ODS) or leaded gasoline, and for issues
related to industrial chemicals for which technologies exist or
can be developed to solve environmental problems associated
with their production and use. Finally, it has become clear
that it is critical to have baseline information to allow progress
towards the targets to be tracked. For example, relatively little
measurable progress has been made—or can be demonstrated—
towards the WSSD target to “reverse the loss of biodiversity by
2010”, since there are insufcient, reliable and comprehensive
biodiversity baseline data upon which to base trends and
assess progress.
Table 2: Environmental targets adopted at the WSSD, 2002
Targets Indicators
Maintain or restore depleted sh To be determined
stocks to levels that can produce
the maximum sustainable yield
by 2015
Reverse the loss of biodiversity Identied by Convention
by 2010 on Biological Diversity (CBD)
Establish a representative network To be determined
of marine protected areas by 2012
Increase the share of renewable To be determined
energy in the total energy supply,
and provide 35% of African
households with modern energy
within 20 years
Phase out by 2020, production To be determined
and use of chemicals that harm
health and environment
1
Population &
Human Development
Brian Gratwicke/Flickr.com
2
Since 1992, the human population has grown
by
1 450 000 000
people
Since 1992, the world’s
population increased by an
annual rate of 1.3%, adding
nearly 1 500 million people to
the planet. Between 1992 and
2010, world population grew
from around 5 500 million
to close to 7 000 million,
representing a 26% increase.
There are large differences
in population numbers and
changes between regions. For
example, nearly 60% of the
global population lives in Asia,
15% in Africa, and another
15% in North America and
Europe combined. However,
total population increases are
much greater in West Asia
(67% since 1992) and Africa
(53%), while the population
number in Europe has grown
only slightly (4%).
0
10 000 9 000 8 000 7 000 6 000 5 000 4 000
1
Thousand Million
People
Source: U.S. Census Bureau
World Population since 10 000 BC
0
2
4
6
8
1992 1997 2002 2007 2010
Thousand Million
People
Total Population
West Asia
North America
Latin America &
Caribbean
Europe
Africa
Asia + Pacific
+
26%
+
53%
+
4%
+
28%
+
21%
+
67%
Source: UNEP GEO Data Portal, as compiled from UNPD
Global
+
26%
since 1992
3
however, the population growth rate is declining
At the same time the population growth rate has been declining during the past several decades,
dropping from around 1.65% per year in the early 1990s to 1.2% per year in the late 2000s. This
represents a 27% decline in the growth rate between 1992 and 2010. There is a strong correlation
between a country’s economic state and its growth rate: developing countries tend to have a 2-3
times higher growth rate than developed countries.
This overall, global “decrease in the increase” means that the world’s population and its population
growth rate are increasing more slowly, and could eventually stabilise around 10 thousand million
people in 2100 (UN 2011).
3 000 2 000 1 000 0 1 000 2 050
1
2
3
4
5
6
7
8
9
Thousand Million
People
2012
1992
0
0.5
1
1.5
2
1992 1997 2002 2007 2010
Developing
Developed
Global
Source: UNEP GEO Data Portal, as compiled from UNPD
Population Growth Rate
Per Cent
4
In 2011, over
3 500 million
people—more than
half the world’s population—are living in urban areas
In 1992, 2 400 million of us lived in urban
agglomerations. By 2009, the number had climbed
to 3 500 million, a 45% increase. The additional
1 000 million “urban people”—nearly 200 000 new
city dwellers per day—are the equivalent of 32 times
the population of Tokyo, or 110 times that of Paris
(Brinkhoff 2011).
This unprecedented urban growth, projected to
continue (although at a decreasing rate) in the coming
decades, will require special attention in order to
make life in cities more socially, economically and
environmentally sustainable.
While over half of the world population now lives
in urban areas, they also account for 75% of global
energy consumption (UN-Habitat 2009) and 80%
of global carbon emissions (The World Bank Group
2010), at least when viewed from a consumption
perspective (Satterthwaite 2011). On the other hand,
the top 25 cities in the world create more than half of
the world’s wealth (UN-Habitat 2008).
This ongoing rapid urbanisation indicates that
long-term investments addressing the associated
vulnerabilities are critically needed. “[The] urgency is
acute considering that 30-50% of the entire population
of cities in developing countries live in settlements
that have been developed in environmentally fragile
areas, vulnerable to ooding or other adverse climate
conditions, and where the quality of housing is poor
and basic services are lacking” (UN 2009b).
0
1
2
3
4
1992 1997 2002
2007 2009
Thousand Million
People
Urban Population - Total
Developing
Developed
Global
0
1
2
3
1992 1997 2002 2007
2009
Per Cent
Urban Population - Growth Rate
Developing
Developed
Global
30
40
50
60
70
80
1992 1997 2002 2007 2009
Per Cent
Urban Population - Per Cent of Total Population
Developing
Developed
Global
UNEP GEO Data Portal, as compiled from UNPD
UNEP GEO Data Portal, as compiled from UNPD
UNEP GEO Data Portal, as compiled from UNPD
5
The number of “megacities” has
more than doubled since 1990
According to UN-Habitat, megacities
are high density metropolises with
at least 10 million inhabitants. The
number of these megacities climbed
from 10 in 1992 to 21 in 2010, a
110% increase, adding on average one
megacity every two years. Fifteen of
the world’s 21 megacities are found
in developing countries. The largest
megacity today is Tokyo which counts
nearly 37 million persons, more than
Canada’s total population.
With large and dense metropolises
come the associated environmental
impacts of urban life. Very dense
population structures and people living
in close quarters bring sanitation, waste
management, air quality, pollution
and other concerns for residents and
the environment alike. Not only do
anthropogenic factors play a major
role in megacities but the natural
environment also presents risks to
highly concentrated populations
including oods, mudslides, tsunamis
and earthquakes (UN 2009b, UN-
Habitat 2009).
Tokyo, Japan
Delhi, India
Sao Paulo, Brazil
Mumbai, India
Mexico City, Mexico
New York-Newark, USA
Shanghai, China
Kolkata, India
Dhaka, Bangladesh
Karachi, Pakistan
Million People
36.7
22.2
20.3
20.0
19.5
19.4
16.6
15.6
14.6
13.1
Rank 1990
1
11
4
5
3
2
18
7
23
21
1
2
3
4
5
6
7
8
9
10
Top 10 Megacities 2010
Source: UNPD
0
6
12
18
24
1990 1995 2000 2005 2010
Number of Megacities
Megacities
>10 Million Inhabitants
+
110%
since 1990
Source: UNPD
10
13
16
19
21
6
The population of China’s Pearl River Delta has tripled
since 1992 and includes two of the world’s megacities
The Greater Pearl River Delta area in southeastern China is the world’s largest “mega-region” with a population of
approximately 120 million people (UN 2010). Over the past two decades, the populations of the delta cities of Guangzhou
and Shenzhen have each reached nearly 10 million people while Hong Kong, Foshan and Dongguan have grown to around
5 million each (UN 2009). The individual cities are beginning to merge into one contiguous urban area. The core delta area
shown in the above image had a little over 20 million people in the early 1990s but has since tripled to roughly 60 million
people (SEDAC 2010). This intense urbanization has led to the loss of productive farmland and natural areas among other
environmental problems (Yan and others 2009).
Source: USGS; Visualization UNEP-GRID Sioux Falls
7
Since 1990, the share of the urban population living in slums in the developing world has declined signicantly, dropping
from 46% in 1990 to 33% in 2010. This decrease shows that many efforts to give inhabitants of slums access to improved
water or sanitation, and/or more durable housing have been successful. On the other hand, the absolute number of people
living in slums has increased by 26% over the same period, equaling 171 million additional people and raising their
number from 656 million in 1990 to 827 million in 2010. “Redoubled efforts will be needed to improve the lives of the
growing numbers of urban poor in cities and metropolises across the developing world” (UN 2011b).
Note:
A slum household is dened as a group of individuals living under the same roof lacking one or more of these conditions: access to improved water;
access to improved sanitation; sufcient-living area; durability of housing; security of tenure. However, since information on secure tenure is not
available for most of the countries, only the rst four indicators are used to dene slum household, and then to estimate the proportion of urban
population living in slums (UNSD n.d.).
A smaller proportion of urban dwellers live in slums, but
their total number has risen to
827 000 000
People Living in Slums
20
30
40
50
400
600
800
1 000
1990 1995 2000 2005 2010
Proportion of Urban
Population in Slums [%]
Population in Slums
[Million People]
46%
33%
656 Million
827 M
illion
Source: UN-Habitat
Percentage
Total Num
ber
8
The population aged over 65 is growing at a faster rate
than other age groups in most regions of the world
While the population of the groups below 14 and above 65 years of age in all developed countries
together has remained largely the same since 1990, this population in developing countries has
continued to grow (from 1 760 million to 2 040 million in 2010, an increase of 16%).
At the same time, there are signicant differences in age structure between developed and
developing regions. In the developed countries, the number of persons over 65 has been
increasing rapidly, and now nearly equals the under 14 population. By contrast, in the developing
countries, the under 14 population continues to grow and far outstrips the over 65 age group,
although the latter is also rising, both in numbers and percentage of total population.
This developed-developing countries’ dichotomy, as well as the fact that older populations are
growing faster than the total population and that the difference in growth rates is increasing, has
major implications for economies, the education and health care sectors, and the environment
itself (UN 2009).
Life expectancy depends heavily on good public health, medical care and a balanced diet, as
well as peaceful and stable surroundings. Although living conditions improved in all regions and
globally the average life span increased by four to eight years, Africa lags far behind, noting that
there are large differences within the continent.
50
60
80
70
Africa
Asia + Pacific
Europe
Latin America &
Caribbean
North America
West Asia
1990 2010
Years
Global
Source: UNEP GEO Data Portal, as compiled
from UNPD
Age Distribution
- High and Low Age Groups -
Life Expectancy
0
500
1 000
1 500
2 000
1990 1995 2000 2005 2010
Million People
Developing, Total, > 65 years
Developed, Total, > 65 years
Developed, Total, < 14 years
Developing, Total, < 14 years
Source: UNEP GEO Data Portal, as compiled from UNPD
9
The average global citizen consumes
43 kg
of meat per year, up from 34 kg in 1992
100
120
140
1992 1997 2002 2007
Fish & Seafood
Meat
Global Population
+
32%
since 1992
+
26%
since 1992
+
22%
since 1992
Source: UNEP GEO Data Portal, as compiled from FAO
110
Index, 1992=100
130
Global dietary patterns have changed enormously over the last decades. “Income growth, relative price changes,
urbanization and shifts in consumer preferences have altered dietary patterns particularly in developing countries” (FAO
2008). Diets shifted away from basic foods towards livestock products, as well as oils, fruits and vegetables, increasing the
demand for meat by 26% and for sh and seafood by 32% between 1992 and 2007. During that time, for example, global
average meat consumption grew from 34 kg per person per year to 43 kg. Nearly all of these increases can be attributed
to growing demand in Asia and to a lesser extent, Latin America. Based on different studies and considering the entire
commodity chain (including deforestation for grazing, forage production, etc), meat production accounts for 18-25% of the
world’s greenhouse gas emissions (UNEP 2009, Fiala 2008, FAO 2006).
Food Supply
- Meat, Fish & Seafood -
10
Human development levels are improving throughout
the world, but there are large regional differences
The Human Development Index (HDI), which serves as a frame of reference for both social and economic development,
combines three dimensions to measure progress: a “long and healthy life” (life expectancy), “access to knowledge” (school
enrollment) and “standard of living” (gross national income). Over the past 20 years, the HDI has grown globally by 2.5%
per year, climbing from 0.52 in 1990 to 0.62 in 2010, or 19% overall, showing substantial improvement in many aspects of
human development. Although progress has been made, large differences in values and growth are visible between regions,
with Africa lagging far behind.
“Most people today are healthier, live longer, are more educated and have more access to goods and services. Even in
countries facing adverse economic conditions, people’s health and education have greatly improved” (UNDP 2011).
0.2
0.4
0.6
0.8
1
1990 2000 2010
Index
Global
Africa
Latin America and
the Caribbean
Asia
OECD
Source: UNDP
Human Development Index
11
Women’s inuence, as measured by seats in
national parliaments, is steadily rising
In the realm of gender parity, one indicator is the number of women in national parliaments. This gure has risen steadily
over the last 20 years, from roughly 12% in 1997 to 19% in 2010, representing a 60% increase. This equals over 8 600
seats in more than 170 countries, up from just over 4 000 in 1997 (IPU 2011). “But this is far short of the target of 30% of
women in leadership positions that was to be met by 1995, and further still from the MDG target of gender parity” (UN
2010). Women play a key role in improving environmental-related legislation and seeing that these measures are adequately
funded and implemented.
10
12
14
16
18
20
1997 2002 2007
% of all Seats
2010
+
60%
since 1997
Source: World Bank
Proportion of Seats Held by Women
in National Parliaments
12
Economy
Nic McPhee/Flickr.com
13
GDP has continued to climb at a steady rate
Since 1992, the world’s overall
Gross Domestic Product (GDP) has
increased signicantly i.e., from
US$ 36 to 63 million millions in
2010, an increase of 75% or 3.2%
per year on average. GDP per capita
rose by 40% in that same period.
Due to strong economic growth in
many developing countries, their
level of GDP per capita increased
substantially, particularly in the
last decade (80% since 1992, 45%
since 2002). However, differences
between developing and developed
countries on per capita basis
are almost seven-fold, reecting
the wide economic discrepancy
between these two worlds.
GDP indicates the level of
economic activity, but is often
misinterpreted as a measure of a
country’s living standard. However,
GDP as such does not adequately
reect standards of living, human
well-being or quality of life.
One successful attempt to move
measurements and indicators
of development beyond GDP is
the Human Development Index,
launched just before Rio 1992 and
updated every year since.
100
120
140
160
180
1992 1997 2002 2007 2010
Index, 1992=100
Developing
Developed
World
+
33%
since 1992
+
39%
since 1992
+
80%
since 1992
Source: UNEP GEO Data Portal,
as compiled from World Bank, UNPD
GDP per Capita
- Change -
0
10
20
30
40
1992 1997 2002 2007 2010
Thousand Constant
2000 US$
GDP per Capita
- Total -
Developing
Developed
World
5 300
US$/person/yr
9 200
US$/person/yr
33 800
US$/person/yr
Source: UNEP GEO Data Portal, as compiled from World Bank, UNPD
14
Certainly not every country or citizen has beneted from overall higher levels of economic welfare. The gap between the
lowest and highest income countries remains large, with many countries in Africa, Latin America and Asia still below the
global average. In addition, many countries experience signicant domestic income inequalities between rich and poor.
In new and rising economic powers such as China and India, millions have been lifted out of poverty, but often at a high
environmental cost. “The economic growth of recent decades has been accomplished mainly through drawing down
natural resources, without allowing stocks to regenerate, and through allowing widespread ecosystem degradation and
loss” (UNEP 2011).
but huge differences in economic development persist
All data for year 2010; except year 2009 data used for the following countries: Australia, Brunei Darussalam, Iran (Islamic Republic of),
Libyan Arab Jamahiriya, Qatar, Saudi Arabia, United Arab Emirates, Yemen
Source: UNEP GEO Data Portal, as compiled from World Bank, UNPD
*All data for year 2010; except year 2009 data used for the following countries: Australia, Brunei Darussalam, Iran (Islamic Republic of), Libyan Arab Jamahiriya,
Qatar, Saudi Arabia, United Arab Emirates, Yemen
GDP per Capita (2010*)
below global mean
above global mean
no data available
15
The absolute value of trade among countries,
a major aspect of globalisation, has tripled
0
20
40
60
80
0
10
20
30
40
1992 1997 2002 2007 2009
Million Million US$
Trade (US$)
Trade (% of GDP)
% of GDP
Source: UNEP GEO Data Portal, as compiled from World Bank
Trade has been present throughout much of human history, but its importance in economic, social and political terms has
increased steeply over the last decades, and is a main facet of what is generally understood by “globalisation”. The value of
internationally traded products has tripled between 1992 and 2009, from over US$ 9 to 28 million millions. The share of
trade as of the global total Gross Domestic Product (GDP) increased in that period from 39% to 49%, reaching nearly 60%
before the economic crisis in 2008. By far the largest sectors of international trade in 2010 concern mineral fuels and oils
(15%), electrical and electronic equipment (13%), machinery (12%) and vehicles (7%) (ITC 2011).
Trade
- Total and Percentage of GDP -