Impacts of Technology on the Environment pot
Bạn đang xem bản rút gọn của tài liệu. Xem và tải ngay bản đầy đủ của tài liệu tại đây (1.32 MB, 38 trang )
ImpactsofTechnologyontheEnvironment|Page1
Impacts of Technology on the Environment
Resources for Decision Making
Thisresourcepacketemploysalifecycle
approachtobuildthetechnology
assessmentskillsof9‐12
th
grade
technologystudents.
Theactivitiesofthispacketaddressasingle
question:Whataretheenvironmental,social,and
healthimpactsofreplacingincandescentlampswith
compactfluorescentlamps(CFL)?
Prepared by…
Mary Annette Rose
ImpactsofTechnologyontheEnvironment|Page2
Althoughtheinformationinthisdocumenthasbeenfundedwhollyorin
partbytheUnitedStatesEnvironmentalProtectionAgencyunder
assistanceagreement#NE00E48901‐0
toBALLSTATEUNIVERSITYitmay
notnecessarilyreflecttheviewsoftheAgencyandnoofficialendorsement
shouldbeinferred.
April 2009
MaryAnnetteRose,Director,EnviroTech
DepartmentofTechnology
BallStateUniversity
AppliedTechnologyBuilding
Muncie,Indiana47306
ImpactsofTechnologyontheEnvironment|Page3
Theconsequencesofourtechnologicalchoices—products,processes,andsystems—are
comingintofocus.Thehistoricalrecorddemonstratesthattechnologicaldecisionshaveboth
desirableandunpredictableimpactsuponhumanhealthandthevitalityoftheenvironment.
Morerecentscientificevidenceexaminingcarbonandmercurycyclesindicatesthatthe
consequencesof
ourenergyandpowertechnologiesareglobalinscale.
Asdedicatedteachers,westrivetohelpstudentsdev elop
theanalyticalanddecision‐makingskillstheywillneedto
makewiser,environmentally–soundchoices regarding
thedesign,adoption,use,anddisposalofthese
technologies.TheStandardsforTechnologicalLiteracy
(2000,Standard5&
13),theNationalScienceEducation
Standardsandtheguidelinesforenvironmental
education(NAAEE,2004 )echoaresponsibilityfor
buildingstudents’understandingaboutthe
interconnectednessoftechnologyandtheenvironment
andtheirassessmentanddecision‐makingskills.This
instructionalresourcepacketprovidesonemodel for
addressingthesestandards.
Similartousing
processesassociatedwithengineeringdesignorproblemsolving,themodel
describedhereinemployslifecycleassessmentasaframeworkforteachingandlearning.
Takenasawhole,thestudent‐centeredresourcesinthispacketguidestudentsthroughalife
cycleassessmentprocess.Alternatively,theseindividualactivitiesmayserveasexamples
that
canthenbea ppliedtootherenvironmentalissuesandtechnologicalchoices.
Attheheartofourmoderntechnologicalsocietyliesan
unacknowledgedparadox.AlthoughtheUnitedStatesis
increasinglydefinedbyanddependentontechnologyand
isadoptingnewtechnologiesatabreathtakingpace,its
citizensarenotequippedtomakewell‐considered
decisionsortothinkcriticallyabouttechnology.
National
AcademyofEngineering&
NationalResearchCouncil(2002,p.1)
Standards for Technological Literacy (ITEA, 2000)
5. Students will develop an understanding of the effects of
technology on the environment.
13. Students will develop the abilities to assess the impact
of products and systems.
National Science Education Standards (NRC, 1996)
As a result of the activities in grades 9-12, all students
should develop:
• decision-making skills.
• understandings of population growth, environmental
quality, natural and human induced hazards, and
science and technology in local, national and global
challenges.
ImpactsofTechnologyontheEnvironment|Page4
Table1.LearningGoals
Aftercompletionofthisunit,studentsshouldbeableto:
1. Describethepurpose,principles,andmethodsoflife
cycleassessment.
2. Explaintheadvantagesofreplacingincandescentlamps
withCFLsintermsoftheirrelativeenergyefficiency,
wasteheatgeneration,andexpectedlife‐time.
3.
ExplaindisadvantagesofadoptingCFLsintermsofthe
disposalandrecyclingpracticesfortoxicmaterialsand
thereleaseofmercuryintotheenvironment.
4. Describephysical,chemical,andbiologicalprocesses
involvedwiththetransmissionanddispersionofmercury
throughtheenvironment,e.g.,mercurydeposition.
5. Describequalitiesofhealthyecosystems
andrecognize
technologicalthreatstotheintegrityofthesesystems.
6. Describeimpactsofmercuryupontheenvironment,
especiallythebioaccumulationofmercurywithinfish.
7. Explaincommonroutesofmercuryexposure,especially
inhalationandfishconsumption,andtheriskstohuman
health.
8. Explainappropriateproceduresforcleaningup
broken
CFLsanddisposingofspentCFLs.
9. Applymethodsforassessingtheimpactoftechnology
upontheenvironment,theeconomy,andhumanhealth.
10. Synthesizeandevaluatecontradictoryinformation.
11. Proposealternativedecisionsorpoliciesandpredict
potentialimpactsofthosedecisions.
12. Plananexperiment,systematicallycollect,analyze,and
interpretdatatoinformpersonaldecision‐makingand
communityaction.
13. Developpredispositionstoresponsiblyreduce
environmentalimpactsrelatedtotechnologicalchoices.
Allresourcesinthispacketrelatetoasingledecisioncharacterizedbythreeessential
questions:
Shouldwereplaceincandescentlampswithcompactfluorescentlamps(CFL)?
Whatareenvironmental,social,andhumanhealthimpactsofthisdecision?
Whatstrategiesmightindividualsandcommunitiesusetoreducethenegative
impactsofthisdecision
ontheenvironmentandhumanhealth?
Inadditiontobuildingstudents’assessmentanddecisionmakingskills,thelearning
experiencesdescribedherehelpstudentsmeetavarietyoflearninggoals(Table1).
Thisdocumentisarrangedintothreesections.Thisintroductorysectionprovidesbackground
informationfortheteacher.Thesecond
section
includesactivitysheetsthatmaybe
photocopiedanddistributedtostude nts.
Workedexamplesareprovidedinsection
three.
ImpactsofTechnologyontheEnvironment|Page5
Life Cycle Assessment
Lifecycleassessment(LCA)isatoolforidentifyingandanalyzingtheimpacts—influences,
costs,orbenefits—oftechnologyupontheenvironment.Policymakersusetheinformation
generatedbyanLCAtocomparethetradeoffsofalternativeproducts,processes,and
servicesandtobetterinformtheirpolicy,adoption,andmanagementdecisions.Business
andindustryleadersusethisinformationtoimprovetheenvironmentalperformanceoftheir
productsandoperations,e.g.,pollutionpreventionandrecyclability,andinformstrategic
decisions.
Systems and Sustainability
LCAisbuiltuponprinciplesofsystemsthinking,sustainability,andlifecyclethinking.A
systemisagroupofinterdependentcomponentswhichacttogetherinaunifiedway.All
technologicalsystemsareembeddedwithinlargersocial,economic,andenvironmental
systemswhichinteractthroughtheexchangeofmaterials,energy,andinformation.
These
inputsandoutputsindicatepointsofimpactanddependencebetweensystems.
Forasystemtobesustainable(i.e.,continue tofunction),theinputsconsumedbyone
systemmustnotexceedthestoredorregenerativecapacityoftheenvironmentfromwhich
thoseinputsoriginate.Thus,apapermillwhichdemands
treesasasourceofpulpmustnot
exceedthesupplyofanexistingforestorthegrowthrateofthatforest.Inaddition,the
outputsofasystem—theproducts,wastes,andemissions—mustbebenignordegradableby
theenvironmentalsystem,orthoseundesirableelementsmustbemanaged andstoredto
protectthehealthoftheenvironment.Lifecyclethinkingisapowerfuldecision‐makingtool
whenstrivingforsustainability.
Lifecyclethinkingislookingupstreamanddownstreamatthephasesofaproductslifecycle.
This“cradle‐to‐grave”perspectiveemphasizesthataproducthasenvironmental,social,and
humanhealth
impactsateachstageofitslifecycle,includingtheextractionofrawmaterials,
designandproduction,packaginganddistribution,useandmaintenance,anddisposal.This
comprehensiveviewcompelsthedecision‐makertoconsiderafullrangeofimpactindicators
associatedwiththeinputsandoutputsofeachsystem,especiallyenergy
consumption,water
requirements,solidwastes,atmosphericemissions,humanhealtheffects,andother
cumulativeimpactstothebiosphere.
ImpactsofTechnologyontheEnvironment|Page6
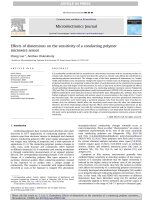
Figure 1. Life cycle of products.
Source:UnitedNationsEnvironmentProgramme(2007).Lifecyclemanagement:
Abusinessguidetosustainability[Image].p.12.RetrievedJanuary8,2009,from
/>
Conducting a Life Cycle Assessment
TheInternationalStandardsOrganization(ISO)hasoutlinedstandardsofLifeCycle
Assessment(LCA)initsISO14040Standard.Thisinvo lvesfourphases,including:
(1)GoalandScopeDefinition
(2)InventoryAnalysis
(3)ImpactAssessment
(4)Interpretation.
AsexplainedbytheScientificApplicationsInternationalCorporation(2006)andsummarized
inTable2,each
phaseconsistsofseveraltasks.Aswithmostresearchassessmentactivities,
theinitialphaseofLCAbeginsbyclarifyingthegoalsoftheassessment,boundingthestudy,
describingthetechnologyintermsofitslifecycle,selectinganalyticalmethods,and
planning.
ImpactsofTechnologyontheEnvironment|Page7
Table 2. Process of life cycle assessment.
Phases EssentialQuestions KeySteps
1 GoalDefinition
andScoping
Whatarethegoalsandboundariesofthe
study?
Whatenvironmentalimpactsandindicators
willbeconsidered?
Whatmethodsandreportingrequirements
willbeused?
Whataretheassumptionsandlimitationsof
thestudy?
1.Definethegoal(s)andessentialquestionsofthestudy.
2.Describetheproduct,process,orserviceintermsofits
lifecycle.
3.Selectthephasesofthelifecyclethatwillbeexamined.
4.Identifyanddefinetheenvironmentaleffectsand
indicators(andunitsofmeasurement)thatwillbe
examinedinthestudy.
5.Identifythedatagathering,analyticalandreporting
methods?
6.Listany
assumptionslimitationsofthestudy.
2
InventoryAnalysis Whatarethemajorprocessesofeachphase
ofthelifecycle?
Whatarethemajorinputs(water,energy,
materials)andoutputs(e.g.,airemissions,
waste)ofeachprocess?
Whatsourcesofinformationandmethods
willbeusedtoquantifytheinputsand
outputs?
Foreachlifecyclephase…
1. Identifyanddescribethemajorprocesses.
2. Developaflowdiagramfortheprocessesbeing
evaluated.
3. Foreachprocess,identifyandquantifytheinputs
(water,energy,materials)andoutputs(e.g.,air
emissionsandsolidwaste).
4. Recorddatainadatacollectionspreadsheet.
3 Impact
Assessment
Whichimpactcategoriesarerelevant?
Doestheinput/outputfactoractasastressor
tothisimpactcategory?
Whatisthepotentialimpactofthisstressor?
Howdoesthisimpactcomparetoothers?
1.Selectanddefineimpactcategories,e.g.,potential
mercurytoxicityinfish.
2.ClassifyLCIresultsintoimpactcategories.
3.Modelthepotentialimpacts.
4.Standardizepotentialimpactstoallowcomparison.
5.Groupandweightthepotentialimpacts.
4 Interpretation
Basedontheevidenceandanalyses,whatare
thesignificantissues?
Istheanalysiscomplete,sensitive,and
consistent?
Relativetothegoalandscopeofthe
assessmentandevidence,whatconclusions
andrecommendationsarereasonable?
1. Identifysignificantissues.
2. Evaluatethecompleteness,sensitivity,andconsistency
ofthedata.
3. Draw
conclusionsandrecommendations.
AdaptedfromScientificApplicationsInternationalCorporation.(2006,May).Lifecycleassessment:Principlesand
practice.U.S.EnvironmentalProtectionAgency(ContractEPA/600/R‐06/060).RetrievedJanuary8,2009,from
/>DuringPhase2,eachofthemajorprocessesofthesystemisexamined,inventoried,
quantified,anddepictedinasystemflowdiagram(Figure2).Thechallengeofthisphaseis
toselectreliabledatasourcesormethodswhichyieldthedesiredtypeandaccuracyofdata
foreachoftheinputs
(materialsandenergy)andoutputs(e.g.,airemissions,solidwaste,
water,effluents,productsandby‐products).Commondatasourcesincludeactual
performancemeasurements,manufacturerspecifications, governmentreports,orindustry‐
averagedreports.Thedataforthelifecycleinventory(LCI)arecompiledintoanelectronic
spreadsheetordatabaseforfurtheranalysis
andpresentationofresults.Theexample
providedinFigure3showsaflowdiagramofmercuryusedinfluorescentlamps(Cain,Disch,
Twarski,Reindl,andCase,2007).
ImpactsofTechnologyontheEnvironment|Page8
Figure 2. Generic system flow diagram for a single process.
InPhase3,thegoalistoevaluatethelinkagesbe tweenthetechnologyunderstudyandits
potentialimpactupontheenvironmentandhumanhealth.Majoractivitiesofthisphase
includeselectingimpactcategories(e.g.,mercurytoxicityoffish,globalwarming,orhuman
health)andthenclassifyingtheLCIresults
intothesecategories.Toallowcomparisonof
results,theindicatorswithincategoriesarethencharacterizedincommonterms.For
example,allemissionscontributingtoglobalwarmingmightberepresentedinCO
2
equivalents.Then,finallyeachoftheimpactcategoriesisassignedarankbasedontheir
perceivedimportance.
ImpactsofTechnologyontheEnvironment|Page9
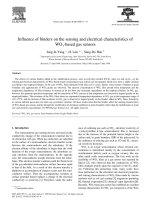
Figure 3. Flow diagram of mercury used in fluorescent lamps in the United States in 2005.
Source: Cain, A., Disch, S., Twarski, C., Reindl, J.& Case, C.R. (2007). Substance flow analysis of mercury
intentionally used in products in the United States. Journal of Industrial Ecology, 11(3). Retrieved December 7,
2007, from />
InthefinalphaseofLCA,theassessorreviewsthegoalsandresultsoftheassessmentand
identifiesthesignificantissues.Becauseestimatesandassumptionsmustbemadeduring
Phase2and3oftheLCA,anotherimportanttaskistorecheckandevaluatethedatabefore
drawingconclusions,making
recommendations,andformallyreportingthestudytoothers.
ImpactsofTechnologyontheEnvironment|Page10
Section 2. Student Handouts
ImpactsofTechnologyontheEnvironment|Page11
Life Cycle Thinking
Whenyouuseaproduct,youareparticipatinginonephaseofaproduct’slife.Beforethe
productmakesittoyou,rawmaterialsaretaken(extracted)fromtheenvironmentand
manufacturedintoaproduct.Then,thefinishedproductistransportedtoadis tributor
whereyoumakeadecisionaboutwhether
topurchaseit.Manyproducts,suchasalight
bulb,alsoconsumeenergyasyouusethem.Aftertheproductis spentandnolongeruseful,
youdisposeofitorrecycleit.Thiscircleiscalledaproductlifecycle.Alifecycleshowsthat
everyproductisconnected
totheenvironment.
Doyouthinkabouthowyourdecisionsto
purchaseanduseaproductcreatesademand
forplants,animals,minerals,andenergy?Do
youconsiderhowthetechnologiesusedto
extract,produce,transport,anddisposeof
productsmightaffect(impact)theenvironment
andyourhealth?
Inthis
lesson,wewilluselifecycleassessment
(LCA)tohelpusidentifyandassesshowour
choicesimpacttheenvironment.Todoso,we
willexploreonecommondecision…
Decision
:
Shouldyou and your family purchase and install
compact fluorescent lamps (CFL) in your house or
apartment?
Howmightthisdecisionimpactthehealthofhumans
andtheenvironment?
Source:UnitedNationsEnvironmentProgramme(2007).Lifecycle
management:Abusinessguidetosustainability[Image].p.12.
RetrievedJanuary8,2009,from
/>
Source:UnitedNationsEnvironmentProgramme. (2007).Lifecycle
management:Abusinessguidetosustainability [Image]. p.12.
ImpactsofTechnologyontheEnvironment|Page12
Life Cycle Assessment(LCA) Name ___________________________
TeamsofbusinessandindustryleadersuseLifeCycleAssessment(LCA)tohelpthemmakedecisions.
TheLCAprocesshelpstheteamidentifytheenvironmentalandsocialimpactsofaproduct.An
impactisachangeorconsequencethatresultsafterachoicehasbeenmade.Let’susethefour
phasesoftheLCAprocesstohelpusmakeadecision…
PHASE #1 Goal and Scope
OneofthefirsttasksofaLCAistodefineyourgoalsandboundyourassessment.Boundingmeans
settinglimits,suchassettinglimitsontime,place,sourcesofinformation,andimpactareas.The
impactareasofinterestcouldincludeimpactstothebiosphere(humans,animals,andplants),orthe
hydrosphere(water),cryosphere(ice),atmosphere(air),orlithosphere(land).
Directions:DiscussthegoalsandboundariesofyourLCAwithyourteacherandteammates.Then,
recordthesegoalsandboundariesbelow:
●●Goal & Scope ● ●
Goal:
TimeLimits
:
SettingoftheStudy:
SourcesofInformation
:
ImpactAreas
:
●●●
ImpactsofTechnologyontheEnvironment|Page13
PHASE #2A Inventory Analysis Name _______________________________
InthisphaseoftheLCA,theteamtakesaninventoryofthemajorsystemsusedduringaproducts’
lifecycle.Asystemisasetoftoolsandprocesses(e.g.,miningandmanufacturing)whichwork
togetherinaunifiedway.Asystemrequiresmaterialsandenergytofunction;these
elementsare
calledinputs.Processestransformtheseinputsintodesirableproductsandundesirableoutputs
(e.g.,wastesandemissions).Acompleteinventorywouldidentifyandquantifytheinputs,processes,
andoutputsfortheentirelifecycleofaproduct.
Directions:Thelistbelowidentifiessomeofthemajorinputs,processes,andoutputsofthelife
cycleofaCFL.AfterconductingaWebsearchandreviewingtheinf ormationprovidedbythe
instructor,categorizetheseprocesses,materials,energysources,intotheInventoryofCFL’s.
Remembertokeeptrackofyour
sourcesofinformationbyrecordingthembelow.
Majorinputs,processes,andoutputsinthelifecycleofaCFL.
Materials
Processes
Energy
Glass
Sand
Silica
Bauxite
Cinnabar
Mercury
Phosphor
CFL
Paper
Aluminum
Carbondioxide
Printedcircuitboard
Retorting
Undergroundmining
CrushingspentCFL
InstallingnewCFL
CollectingspentCFL
Packaging
Shipping(cargoship)
Selling
Repackaging
Buryinginalandfill
Shapingglasstubes
CleaningupbrokenCFLs
Recycling
Refiningore
Sources
Coal
Petroleum
Naturalgas
EnergyForm
Electricity
Heat
Light
Resources:
ImpactsofTechnologyontheEnvironment|Page14
●●Inventory of CFL’s ● ●
INPUTS→→→→→→PROCESSES→→→→→→OUTPUTS
Energy:
Materials:
Extracting&Refining
Energy:
Materials:
Production
Energy:
Materials:
Packaging&Distribution
Energy:
Materials:
Use&Maintenance
Energy:
Materials:
Disposal
ImpactsofTechnologyontheEnvironment|Page15
PHASE #2B Inventory Analysis Name _______________________
ThepurposeofyourLifeCycleAssessmentistohelpyoumakeadecisionaboutwhethertoadopt
compactfluorescentlamps.YourLifeCycleInventory(LCI)wouldnotbecompl e tewithoutcounting
thenumber,type,andpowerratingsoflampsyouhaveinyourhomeorapartment.Theunitof
power
forabulbistheWatt(W).CommonpowerratingsforCFLsare23Wand14W.Thisdata
wouldhelpdescribethe“UseandMaintenance”sectionoftheLCI.FortheDisposalsection,youwill
alsoneedinformationabouthowyouandyourparentsdisposeofspentbulbs.
Directions:Workingwithteammates,developaninventorysheetthatcouldbeusedtorecordthe
numberandtypesoflightbulbsinyourhomeorapartment.Onthissheet,youmightprovidea
columntorecordthetype,quantity,powerratingoflampsandinitialcostoflamps.After
yourteam
finalizestheinventorysheet,takethesheethomeandconductaninventoryofworkingbulbsinyour
homeorapartment.
● ● Inventory of Bulbs in a House ● ●
Address: Name:
TypeofBulb
(CFL,Fluorescent,
Incandescent)
PowerRating
(Watt)
NumberofBulbs InitialCost
TOTALNumberofBulbs
How does your family dispose of spent CFL and fluorescent lamps?
What does your family do if a CFL or fluorescent lamp breaks?
ImpactsofTechnologyontheEnvironment|Page16
PHASE #2C Inventory Analysis Name _______________________
Anecessarypartofalifecycleinventory(LCI)istoquantifytheenergyused duringeachpartofthe
lifecycle.Forthe“UseandMaintenance”partofthelifecycle,wecanuseyourhomeinventoryto
estimatethequantityofenergyconsumed.Beforewebegin,youshouldknow
that:
• a25‐WattCFLcreatesaboutthesamelightintensityasa100‐Wattincandescentlamp;
• 1000WattsusedinasinglehouriscalledakiloWatthour(kWh);
• MostoftheelectricitygeneratedintheU.S.isgeneratedthroughcoalcombustion;
• OnePoundofcoal
canproduceabout1.2kiloWatthours(kWh)ofelectricity.
Directions:Usingtheworksheetbelow,estimatethecoalrequiredtolightyourhouseforayear.
Let’sassumethat(1)allthebulbsinyourhouseareeither25‐WCFLsor100‐Wincandescent
lampsand(2)theyoperateforthesamenumberofhoursperday.Beginbyestimatingthe
numberofhoursyourlightsstayonasingleday.Then,recordthetotalnumberofbulbsinyour
houseorapartment.Usingtheformulasbelow,calculatetheelectricalpower,cost,andquantity
ofcoalthatisburnedtogenerateelectricity.
● ● Inventory Analysis: Energy Consumption ● ●
A B C D E F
TypeofBulb
Power
Rating
(Watt)
TimeBulbs
On
(Hoursper
year)
Total
Bulbsin
House
(#)
Power
Usedper
Year
(kWh)
Costof
Electricity
peryear
($)
Coal
Burned
peryear
(lb)
CFL
25W
Incandescent
100W
Difference
FormulasforCalculatingEnergyConsumption:
B=Hoursperyear=Hoursperdayx365daysperyear
D=ElectricalPowerusedperyear(kWh)=(AxBxC)÷1000
E=Costofelectricitytolightbulbsperyear=CostperkWhxD
F=Coal(lb)burnedtolightbulbsforoneyear=D÷1.2
ImpactsofTechnologyontheEnvironment|Page17
PHASE #2D Inventory Analysis Name _______________________
WhenreportingtheresultsofanInventoryAnalysis,assessorsmakeaflowdiagramwhichgraphically
showswhereinputsandoutputsflowinandoutofprocesses.
Directions:Workingwithateam,prepareaflowdiagramforonepartofthelifecycleofaCFL,i.e.,
extractingrawmaterials,producing,
transporting,usingandmaintainingordisposing.Asshownin
themodelbelow,showtheinputs,processes,andoutputsassociatedwiththispartthelifecycle.
Whenyouarefinished,connectyourflowdiagramtootherteamsintheclasstoformacomplete
flowdiagramofthelifecycleofa
CFL.
●●Inventory Analysis: Flow Diagram ● ●
Part of the CFL life cycle:
List information sources here.
●●●
ImpactsofTechnologyontheEnvironment|Page18
PHASE #2E Inventory Analysis Name ________________________
Alifecycleinventory(LCI)oftheinputsandoutputsofaproductalsoincludesinformationaboutthe
quantityorvolumeofenergy,materials,wastes,andemissions.Thesequantitiesmaybeperformance
measurements,manufacturerstandards,orgovernmentorindustry‐averagedreports.Thechallengeis
toselectthemostreliabledatasources
andmethodsthatwillyieldthebestestimateofthe
inputs/outputsofasystem.Thisdataiseventuallycompiledintoaspreadsheet ordatabaseand
representedinaflowdiagram.
Directions:Workingwithyourteam,examinetheflowdiagramofthemercuryreleasesfrom
fluorescentlamps(Figure4).Afterdiscussing
thefollowingquestionswithyourteam,recordyour
responsesbelow.
●●Inventory Analysis: Quantifying ● ●
Question Response
1. Whatunitisusedtoquantifymercuryreleases?
2. Whatdotherectanglesrepresent?
3. Whatsymbolrepresentsthedesiredflowpathof
mercury?
4. In2005,howmuchmercuryisbeingreleasedby
fluorescentlampsintheU.S.?
5. WhatdoesMSWmean?
6. Whatsingleprocessreleasesthemostmercuryinto
theland?Howmuch?Why?
7. Basedonthisflowdiagram,whatgroupofworkers
maybeexposedtothemostmercuryreleasesinthe
U.S.?
8. Howmuchmercuryisreclaimedfromfluorescent
lampsthroughrecyclingefforts?Ofthetotalmercury
releasesoccurring,whatpercentagedoesthis
represent?
9. Whyisthe“production”stageresponsibleforsuchas
smallpercentageofmercuryreleasesintheU.S.?
ImpactsofTechnologyontheEnvironment|Page19
Source: Cain, A., Disch, S., Twarski, C., Reindl, J.& Case, C.R. (2007). Substance flow analysis of mercury intentionally used in products in the United States.
Journal of Industrial Ecology, 11(3). Retrieved Janury 30, 2009, from />Figure 4. Flow diagram of the mercury releases from fluorescent lamps
in the United States in 2005.
ImpactsofTechnologyontheEnvironment|Page20
PHASE #3A Impact Assessment Name _______________________
ThegoalofImpactAssessmentistoevaluatewhetherthematerialsandenergyidentifiedintheLife
CycleInventorymightimpacttheenvironmentandhumanhealth.Theflowdiagramprovidedin
Figure3indicatesthatmercuryemissionsareacommonoutputofallstagesofthelifecycleofaCFL.
Thecommonnessofmercurysuggestsanimpact.Whatarethecharacteristicsofmercury?What
happenstoitwhenitisreleasedintotheenvironment?
AsshowninFigure4,mercurymovesandchangesformontheearththroughbiological,
geologicalandchemicalprocesses.Forexample,mercuryintheaireventuallyreturnstothe
earthinaprocessknownasmercurydeposition.Bacteriainthesoilandwatertransform
mercuryintomethylmercury.ThemercuryreleasesoccurringduringthelifecycleofaCFL
contributetothismercurycycle.
Figure 4. Mercury cycle.
Source:UniversityofWisconsin‐Extension.MercuryinSchoolsEducationTeam.(2002).Mercurycycle[Image].
Mercuryinschoolsandthecommunity:Anationalissue.UniversityofWisconsinSystemBoardofRegents.p.46.
RetrievedMarch29,2008,from />ImpactsofTechnologyontheEnvironment|Page21
Directions:Conductanimpactassessmentofmercurybyfollowingthesesteps:
1. InFigure4,drawaCFLtoindicateitscontributiontothemercurycycle.
2. Predictwhatorwhomightbeimpacted(harmed)bymercuryemissionstotheair,land,orwater.
RecordyourpredictionsintheImpact
Categorybelow.
3. Interviewaphysician,nurse,toxicologist,industrialhygienist,orecologisttodiscoverhowmercury
mightimpacttheenvironmentandhumanhealth.Or,reviewthefollowingsourcesofinformation:
ToxFAQs™forMercury
,AgencyforToxicSubstances&DiseaseRegistry
ScientificFactsonMercury,GreenFactsDigest
4. Duringyoursearchforinformation,lookforcluesaboutfoodchains,bioaccumulation,andtoxicity.
5. Asyoudiscoverpotentialimpacts,recordthemnexttotheappropriateImpactCategory.
6. TocompletetheImpactAssessmentrelatedtomercuryreleases,rankorderthepotentialimpacts
fromthemost
important(1)totheleast.
●●Impact Assessment: Mercury Releases ● ●
Impact Category Potential Impacts
Rank by
Importance
(1 = most important)
List information sources here.
●●●
ImpactsofTechnologyontheEnvironment|Page22
PHASE #3B Impact Assessment Name _______________________
ThepurposeofthisLifeCycleAssessmentistohelpyoumakeadecisionaboutwhethertoreplace
incandescentbulbswithCFLs.Toassesstheimpactofthisdecision,weshouldcomparealifecycle
assessmentofthesetwotypesofbulbsintermsofmercuryreleasesrelatedtotheelectrical
energy
theyconsumeandthemercuryinthebulbthatcouldbereleasedduringdisposal.
Tobegin,let’snotesomeimportantfacts.About50%oftheelectricitygeneratedintheU.S.isfrom
thecombustionofcoal.Coalcombustionreleasesmercuryintotheatmosphere.TheU.S.
DepartmentofEnergyreports
thatthemercuryemissions fromco al ‐firedelectricitygeneration
averagesto0.012milligramsperkiloWa tthour(0.012mg/kWh).
Directions:CalculateandcomparethemercuryemissionsrelatedtopoweringaCFLandan
incandescentbulb.Assumethatthesebulbswillbeusedfor8000hoursperyearandusethe
formulaslocated
below.
● ● Impact Assessment: CFL vs. Incandescent ● ●
A B C D E F
TypeofBulb
Power
Rating
(Watt)
Hoursof
Useper
year
(hours)
Power
usedper
year
(kWh)
Average
Mercury
Emissions
(mg/kWh)
Mercuryin
Bulb
(mg)
Mercury
Release
Potential
(mg)
CFL
25W8000
Incandescent
100W8000
Difference
FormulasforCalculatingtheMercuryReleasePotentialofUseandDisposal:
C=ElectricalPowerusedperyear(kWh)=(AxB)÷1000W/kWh
D=Averagemercuryemissionsfromcoal‐firedelectricitygeneration=0.12mg/kWh
E=Averagemercuryinabulb:CFL=4.0mg;Incandescent=0.00
F=Mercuryreleasepotentialfromuseanddisposalofbulbs(mg)=(CxD)+E
●●●
ImpactsofTechnologyontheEnvironment|Page23
PHASE #3C Impact Assessment Name _______________________
ToassesstheimpactofreplacingincandescentbulbswithCFLs,weshouldalsocomparehowof
thesetwotypesofbulbsaredisposedofwhentheyarenolongeruseful.BecauseCFLscontain
mercury,atoxicsubstance,theyareclassifiedasHouseholdHazardousWaste(HHW).Justasyou
woulddisposeof
batteries,paints,andpesticides,HHWshouldbetakentoahazardouswaste
collectionsite.Incontrast,incandescentbulbsareplacedinthehouseholdtrashandburiedina
landfill.
InFigure5,weseethatmostmaterialsinCFLsandotherfluorescentbulbsarerecyclable,including
themercury.Themercury
isseparatedfromthemetalsandglassthroughaheatinganddistillation
processknownasretorting.
So,ifconsumersresponsiblytaketheirspentCFLstoaHHWcollectionsite,theywillreducemercury
releasestotheenvironment.WhereisyourclosestHHWcollectionsite?Whendotheycollect
HHW?Whatpercent
ofhouseholdsinyourneighborhoodrecycleCFLandfluorescentbulbs?
LearnMore:Working withateam,developasurveythatwillallowyoutoesti matehowlikelyitis
thatspentCFLsandfluorescentbulbswillberecycled.Then,administerthesurveytopeopleinyour
neighborhoodandcompiletheresults.
Figure 5. Fluorescent lamp recycling.
Source:EcoLights.(2008).FluorescentLampRecycling.Retrieved
January16,2009,from />ImpactsofTechnologyontheEnvironment|Page24
PHASE #4 Interpretation Name _______________________
InthefinalphaseofaLifeCycleAssessment,itistimetoreviewyourgoals,combineallthe
information,drawconclusions,makerecommendationsandreportyourresultstoothers.
Directions:Discusstheinformationyouhavegatheredwithyourteammates.Whatconclusionscan
youreachabouttheimpactsof
CFLsontheenvironmentandhumanhealth?What
recommendationswouldyoumaketoyourfamily,neighbors,andgovernmentleaders?Inthespace
below,recordyourconclusionsandrecommenda tions.Then,sharethisinformationwithothers.
●●Interpretation ● ●
Goal:
Conclusions:
Recommendations:
• Mayfamilyshould….
• Peopleinmycommunityshould…
• Governmentleadersshould…
●●●
ImpactsofTechnologyontheEnvironment|Page25
SECTION 3: Worked Examples