How effective are European agri-environment schemes in conserving and promoting biodiversity? ppt
Bạn đang xem bản rút gọn của tài liệu. Xem và tải ngay bản đầy đủ của tài liệu tại đây (219.06 KB, 23 trang )
Journal of Applied
Ecology
2003
40
, 947–969
© 2003 British
Ecological Society
Blackwell Publishing Ltd.Oxford, UKJPEJournal of Applied Ecology0021-8901British Ecological Society, 200312 2003406
Essay ReviewEcological effectiveness of agri-environment schemesD. Kleijn & W.J. Sutherland
REVIEW
How effective are European agri-environment schemes in
conserving and promoting biodiversity?
DAVID KLEIJN* and WILLIAM J. SUTHERLAND†
Nature Conservation and Plant Ecology Group, Wageningen University, Bornsesteeg 69, 6708 PD Wageningen,
The Netherlands; and
†
Centre for Ecology, Evolution and Conservation, School of Biological Sciences, University of
East Anglia, Norwich NR4 7TJ, UK
Summary
1.
Increasing concern over the environmental impact of agriculture in Europe has led
to the introduction of agri-environment schemes. These schemes compensate farmers
financially for any loss of income associated with measures that aim to benefit the
environment or biodiversity. There are currently agri-environment schemes in 26 out of
44 European countries.
2.
Agri-environment schemes vary markedly between countries even within the Euro-
pean Union. The main objectives include reducing nutrient and pesticide emissions,
protecting biodiversity, restoring landscapes and preventing rural depopulation. In vir-
tually all countries the uptake of schemes is highest in areas of extensive agriculture
where biodiversity is still relatively high and lowest in intensively farmed areas where
biodiversity is low.
3.
Approximately
$
24·3 billion has been spent on agri-environment schemes in the Euro-
pean Union (EU) since 1994, an unknown proportion of it on schemes with biodiversity
conservation aims. We carried out a comprehensive search for studies that test the effec-
tiveness of agri-environment schemes in published papers or reports. Only 62 evaluation
studies were found originating from just five EU countries and Switzerland (5). Indeed
76% of the studies were from the Netherlands and the United Kingdom, where until
now only
c
. 6% of the EU agri-environmental budget has been spent. Other studies were
from Germany (6), Ireland (3) and Portugal (1).
4.
In the majority of studies, the research design was inadequate to assess reliably the
effectiveness of the schemes. Thirty-one percent did not contain a statistical analysis.
Where an experimental approach was used, designs were usually weak and biased
towards giving a favourable result. The commonest experimental design (37% of the
studies) was a comparison of biodiversity in agri-environment schemes and control
areas. However, there is a risk of bias if either farmers or scheme co-ordinators select the
sites for agri-environment schemes. In such cases the sites are likely to have a higher
biodiversity at the outset compared to the controls. This problem may be addressed by
collecting baseline data (34% of studies), comparing trends (32%) or changes (26%) in
biodiversity between areas with and without schemes or by pairing scheme and control
sites that experience similar environmental conditions (16%).
5.
Overall, 54% of the examined species (groups) demonstrated increases and 6%
decreases in species richness or abundance compared with controls. Seventeen percent
showed increases for some species and decreases for other species, while 23% showed no
change at all in response to agri-environment schemes. The response varied between
taxa. Of 19 studies examining the response of birds that included a statistical analysis,
four showed significant increases in species richness or abundance, two showed
decreases and nine showed both increases and decreases. Comparative figures for
20 arthropod studies yielded 11 studies that showed an increase in species richness
or abundance, no study showed a decrease and three showed both increases and
*Correspondence: David Kleijn. fax +31 317 484845. E-mail
948
D. Kleijn &
W. J. Sutherland
© 2003 British
Ecological Society,
Journal of Applied
Ecology
,
40
,
947–969
decreases. Fourteen plant studies yielded six studies that showed increases in species
richness or abundance, two showed decreases and no study showed both increases and
decreases.
6.
Synthesis and applications
. The lack of robust evaluation studies does not allow a
general judgement of the effectiveness of European agri-environment schemes. We sug-
gest that in the future, ecological evaluations must become an integral part of any
scheme, including the collection of baseline data, the random placement of scheme and
control sites in areas with similar initial conditions, and sufficient replication. Results of
these studies should be collected and disseminated more widely, in order to identify the
approaches and prescriptions that best deliver biodiversity enhancement and value for
money from community support.
Key-words
: EEC Regulation 2078/ 92, farmland, policy evaluation, wildlife conservation.
Journal of Applied Ecology
(2003)
40
, 947–969
Introduction
Post-war European agriculture can be considered a
success in that it has resulted in increased yields and an
enhanced capacity for self-sufficiency. For example, in
the UK the yields per hectare of wheat, barley, potatoes
and sugar beet have tripled since 1950, while over the
same time milk yields have more than doubled (Pretty
et al
. 2000). However, it is widely accepted that in-
creased agricultural productivity has associated costs
in economic, consumer perception and environmental
terms.
More recently, there has been a global shift towards
reducing subsidies. For example, in the UK, manufac-
turing subsidies have been virtually eliminated, yet
agriculture remains heavily subsidized at about 40%
of the income. The free trade talks of the World Trade
Organization have repeatedly identified agricultural sub-
sidies as an area badly needing reform, especially the
European Union (EU) Common Agricultural Policy
(Yu, Sutherland & Clark 2002). The
$
16 900 million
annual cost of the European Union Common Agricul-
tural Policy largely comprises direct payments to farmers,
price support, taxing imports from non-EU countries,
subsidizing exports and paying for storage when no
market is available. As a result, prices in the European
Union exceed those on the international market. The
external costs of agriculture were estimated by Pretty
et al
. (2001) to be about
$
180 per hectare of grassland
and arable, with external benefits equivalent to
$
17 to
$
50 per hectare. It is widely accepted that the expansion
of the European Union in 2004 to include Cyprus,
Czech Republic, Estonia, Hungary, Latvia, Lithuania,
Malta, Poland, Slovakia and Slovenia will make the
current agricultural support mechanisms financially
unviable (Donald
et al
. 2002).
Consumers are currently questioning the benefits of
intensive agriculture. While the concerns may not nec-
essarily always be rational (Beringer 2000), there is
clear public mistrust and distaste for some aspects of
modern agriculture.
The intensification of agriculture has resulted in
major environmental problems in recent decades, not-
ably declines in bird populations together with their
associated food resources (Donald, Green & Heath
2000; Benton
et al
. 2002; Robinson & Sutherland 2002)
and this is likely to continue (Tilman
et al
. 2001).
Future intensification, such as the use of genetically
modified crops, is likely to have further detrimental
consequences for biodiversity (Watkinson
et al
. 2000).
There are also implications for wider environmental
issues, such as flood risk and effects on water quality
(Sutherland 2002).
One response to concerns over biodiversity loss has
been the introduction of agri-environment schemes,
in which farmers are paid to modify their farming
practice to provide environmental benefits. The EU
agricultural policy first explicitly addressed the impact
of agriculture on the environment in a Green Paper
published in 1985 (CEC 1985). The reform of the EU
agricultural policy in that year (EEC Regulation 797/
85) included a novel set of measures for environmental
protection and Article 19 allowed Member States to
pay national aid in environmentally sensitive areas
(ESAs). In 1992 EEC Regulation 2078/92 was intro-
duced, requiring all EU member states to apply agri-
environment measures according to environmental
needs and potential. Between 50% and 75% of the costs
of approved agri-environment schemes are co-funded
by the EU, making this regulation a financially attract-
ive form of environmental protection. Concurrently,
extensive agri-environment programmes were developed
in Norway and Switzerland (both non-EU Member
States) and in Austria and Sweden before their entry into
the EU in 1995. Besides their intended positive effects
on biodiversity and the environment, agri-environment
schemes decouple payments from agricultural output.
Thus they continue to provide income transfers to farm-
ers, but in a way that does not distort world markets
(Potter & Goodwin 1998; Matthews 2002).
More than a decade after the introduction of regu-
lation 2078/92, little information is available on the
949
Ecological
effectiveness of
agri-environment
schemes
© 2003 British
Ecological Society,
Journal of Applied
Ecology
,
40
,
947–969
effects of agri-environment schemes on biodiversity
conservation. The limited number of studies that have
been published present contrasting results (e.g. Kleijn
et al
. 2001; Peach
et al
. 2001). Most EU countries
are currently implementing their second 5-year agri-
environment programme. National schemes have been
initiated in three, and there are plans for pilot incentive
schemes in another six Central and Eastern European
countries (Petersen & Feehan 2003). There is an obvi-
ous need for an overview that shows exactly what agri-
environment schemes achieve in terms of biodiversity
conservation. We attempt such a review here.
First, we briefly describe the differences in design
and implementation of agri-environment programmes
between countries in Europe. Subsequently, we review
the effectiveness of agri-environment schemes by
surveying all available literature, with the aim of integ-
rating the findings of various studies to produce recom-
mendations for improvement. We have restricted
ourselves to the effects of schemes on biodiversity. We
only consider schemes implemented until 2000, as the
new modified programmes are too recent for proper
evaluation. We do not consider set-aside schemes, as
these are not formally agri-environment schemes but a
means of reducing production, and their ecological
merits have been discussed elsewhere (Clarke 1992;
Buckingham
et al
. 1999). Likewise, although organic
farming is an agri-environment scheme and support is
co-funded by the EU under Regulation 2078/92, we do
not consider the effects of organic farming as this has
been discussed extensively elsewhere and the objectives
are not necessarily biodiversity conservation (Weibull,
Bengtsson & Nohlgren 2000; Mäder
et al
. 2002).
Design of agri-environment programmes across
Europe
For clarity, in this review we distinguish between agri-
environment programmes, schemes and measures. We
consider an agri-environment programme to be the
collection of schemes implemented in a country. Indi-
vidual schemes have different objectives (e.g. grassland
extensification or conservation of endangered livestock
breeds) and regularly consist of a set of measures. For
example, in the case of a grassland extensification
scheme, measures (also called prescriptions) may con-
sist of a reduction in stocking densities or a cessation of
fertilizer inputs.
Agri-environment programmes vary markedly be-
tween countries in Europe (Table 1). The objectives of
these programmes usually reflect a combination of the
main environmental, ecological and socio-economic
problems associated with agriculture, as well as the
political situation in each country. In Switzerland, the
Netherlands and the United Kingdom, schemes avail-
able to farmers concentrate on wildlife and habitat con-
servation. In Denmark and Germany most schemes
offered to farmers aim to reduce agrochemical emis-
sions, while in France the programme is geared towards
the prevention of land abandonment in agriculturally
marginal areas. In Ireland and Austria, the objectives
of programmes are balanced between environmental
protection, biodiversity conservation and landscape
maintenance (Table 1).
Schemes can be implemented either horizontally
throughout the country or zonally (also known as ‘tar-
geted’ or ‘vertically’) in certain areas that have been
identified as being particularly vulnerable or a local
biodiversity hotspot (e.g. environmentally sensitive
areas (ESAs)). The designation of areas where zonal
measures can be implemented is usually carried out by
governmental organizations. Most countries have a
combination of both approaches because a limited set
of zonal schemes exist that aim to conserve vulnerable
ecosystems. Switzerland and Finland are the only
countries that have entirely horizontal programmes,
although most schemes in the German, Irish and
Swedish programmes are applied horizontally. By
contrast, most schemes in the United Kingdom and
Spain are implemented in a zonal manner. A more
extensive discussion of the history and lay-out of the
agri-environment programmes in a range of European
countries is given in Buller, Wilson & Höll (2000).
Patterns of implementation of agri-environment
programmes
Differences in uptake rate of individual schemes largely
determine whether and where the overall objectives of
agri-environment programmes can be met. In most
countries uptake is very unequally divided over the
available schemes, with a single scheme usually com-
prising more than 40% of the total area covered by agri-
environment schemes (Table 1). Furthermore, schemes
are often unequally distributed geographically across
countries, with high uptake rates in areas with extensive
agriculture and low uptake rates in areas where agri-
culture is more intensive (Emerson & Gillmor 1999;
Buller & Brives 2000; Grafen & Schramek 2000). The
mechanism resulting in this pattern is illustrated in
Fig. 1(a), which shows that for extensive farmers par-
ticipation in an agri-environment programme is asso-
ciated with comparatively low costs of adaptation. Few
changes are required to meet the requirements of the
schemes (Osterburg 2001). Thus, when uniform pay-
ments per hectare (calculated on an average base) are
offered for voluntary measures, most uptake will occur
in less favoured areas. The same mechanism probably
explains why in most countries (especially France and
Austria) the low impact/low compensation schemes
are those with the highest uptake.
The effects of agri-environment schemes on
biodiversity
EU members are obliged to evaluate their agri-
environment programme with respect to their socio-
economic, agricultural and environmental aspects (Article
950
D. Kleijn &
W. J. Sutherland
© 2003 British
Ecological Society,
Journal of Applied
Ecology
,
40
,
947–969
Table 1.
Characteristics of agri-environment programmes in European countries until the year 2000. Pilot agri-environment
schemes currently applied in CEE countries are not included. UAA, Utilized Agricultural Area; AEP, agri-environment
programme; AES, agri-environment scheme; ECA, ecological compensation area
Austria.
(UAA
’95
3 425 100 ha; area with AES
’97
2 500 000 ha; AEP since 1995, previous programme outside the EU-context since
1972). The Austrian programme (ÖPUL) consists of 25 schemes. Eight horizontal schemes address extensification and reduction
of the negative impact of agriculture on the environment, the other zonal schemes address specific farming practices, biodiversity
conservation and the creation or conservation of landscape elements. ÖPUL aims to promote farming with reduced
environmental impact, maintain farming in agriculturally marginal areas (Alps) and conserve biodiversity and landscape.
However, in 1996 83% of the budget was spent on the horizontal schemes and only 17% on schemes aimed at biodiversity and
landscape conservation.
Schemes with the highest uptake
: crop rotation stabilization (18% of AEP budget) and the basic subsidy
(17%). Source: Groier & Loibl (2000).
Belgium
. (UAA
’95
1 354 400 ha; area with AES
’97
17 000 ha; AEP since 1994). In Flanders no AEP existed before 2000 (Reheul &
van Huylenbroeck 2000). The Walloon programme consists of five horizontal schemes and six zonal schemes. The programme
addresses environmental and biodiversity aspects more or less equally but in 1997 only 25% of the AEP area was under some
scheme addressing biodiversity or landscape conservation issues.
Highest uptake
: planting a cover-crop between two crops (41%)
and restricting stocking densities to between 0·6 and 1·4 lifestock units (26% of AEP area). Source: Walot (2002).
Denmark
. (UAA
’95
2 726 600 ha; area with AES
’97
94 000 ha; AEP since 1992, previous schemes under regulation 797/85 since
1990). The majority of the schemes of the Danish AEP are applied zonally (ESA approach). Schemes aimed at the reduction of
nitrogen use, promotion of rygrass as ground cover and organic farming can be implemented throughout the country. The main
objective of the Danish AEP is to achieve a reduction in nitrogen inputs. Landscape and nature protection has been of minor
importance so far.
Highest uptake
: maintenance of extensive grasland (52% of AEP area) and organic farming (37%). Source:
Andersen, Henningsen & Primdahl (2000).
Finland
. (UAA
’95
2 191 700 ha; area with AES
’97
2 000 000 ha; AEP since 1995). Finland has a strictly horizontal ‘General
Protection Scheme’ (GPS) with six compulsory basic measures and five additional measures of which one has to be selected.
Furthermore, a ‘Special Protection Scheme’ (SPS, 12 measures) exists that is optional but participation is available only in
combination with the GPS. The emphasis of the Finnish programme is on environmental aspects: one of six compulsory measures
and one of five additional measures of the GPS address biodiversity and landscape maintenance. Three of the 12 measures of the
SPS address promotion of biodiversity and landscape. Source: M. Kaljonen (unpublished paper).
France
. (UAA
’95
28 267 200 ha; area with AES
’97
5 725 000 ha; AEP since 1992, previous schemes under regulation 797/85 since 1989).
In France, national and regional schemes exist alongside ‘local operations’. As regional schemes are the same in each region, both
the national and the regional schemes can be considered horizontal whereas the local operations are zonal. Main goal of the AEP
is to maintain agricultural activities in areas with a high risk of agricultural land abandonment and rural depopulation.
Highest
uptak
e: the national scheme – maintenance of extensive animal husbandry (70% of the total AEP budget) and local operations
(
c
. 15% of AEP budget). By 1997 some 67% of the local operations addressed wildlife and ecosystem protection. Source: Buller
& Brives (2000).
Germany
. (UAA
’95
17 156 900 ha; area with AES
’97
6 353 000 ha; AEP since 1992, previous schemes under regulation 797/85 since 1985).
The German AEP is difficult to summarize as each federal state (‘Land’) has its own AEP. Almost all schemes are horizontal
within each federal state with the exception of schemes aimed at the protection of environment, natural resources, countryside and
landscape, which are zonal in some of the states. German agri-environment schemes can be divided in two main types. First,
schemes aimed at changing farming practices and second, schemes aimed at the preservation of specific environmentally
vulnerable areas, biotopes or species. The latter schemes contribute only 9% of the total AEP area (Osterburg 2001), however, in
some federal states these schemes operate outside the framework of regulation 2078/92 and are therefore not co-funded by the EU.
c
. 70% of the German AEP budget between 1993 and 1996 was spent by the agriculturally extensive German states Bayern, Baden-
Würtemberg and Sachsen.
Highest uptak
e: environmentally orientated basic payment – only in Bayern and Sachsen (57% of total
German AEP budget) and grassland schemes – extensification, conversion to arable land, preservation of specific biotopes (23%).
Source: Grafen & Schramek (2000).
Greece
. (UAA
’95
3 464 800 ha; area with AES
’00
c
. 49 500 ha; AEP since 1995, previous schemes under regulation 797/85 since 1986).
So far, five of a projected 13 schemes have been implemented. The schemes address organic plant production, organic livestock
production, 20-year set aside, reduction of nitrogen pollution and conservation of endangered breeds.
Highest uptak
e: reduction
of nitrogen pollution (29·500 ha). Source: Louloudis, Beopoulos & Vlahos (2000), Louloudis & Dimopoulos (2001).
Ireland
. (UAA
’95
4 324 500 ha; area with AES
’99
1 575 000 ha; AEP since 1994). The Irish Rural Environmental Protection Scheme
(REPS) consists of one scheme only with 11 compulsory measures and a further six ‘Supplementary Measures’. The basic scheme
is very comprehensive and addresses biodiversity and environmental protection, training courses and keeping of farm and
environmental records. The REPS aims to conserve wildlife habitats and endangered species of flora and fauna as well as to
address environmental problems. Five compulsory measures are particularly relevant to biodiversity conservation. All
Supplementary Measures are primarily aimed at conservation aspects and only apply in designated areas. Source: Emerson &
Gillmor (1999).
Italy
. (UAA
’95
14 685 500 ha; area with AES
’97
1 608 000 ha; AEP since 1994/1995). Italy is divided into 21 regions, each having
their own agri-environmental programme. Within regions most schemes are implemented horizontally. The AEP is primarily used
as an instrument to reduce the negative impact of agriculture on the environment. Biodiversity conservation is only addressed
indirectly through the maintenance of the countryside and the landscape scheme. However, 94% of this scheme is implemented
in the provinces of Bolzano, Trento and Valle d’Aosta, and is therefore virtually restricted to the alpine region. Highest uptake:
reduction of fertilizer and pesticides inputs (37% of AEP area) and maintenance of countryside and landscape (32%). Source:
INEA (1999).
951
Ecological
effectiveness of
agri-environment
schemes
© 2003 British
Ecological Society,
Journal of Applied
Ecology
,
40
,
947–969
Luxembourg
. (UAA
’95
126 900 ha; area with AES
’97
97 000 ha; AEP since 1996). Only one scheme, available to all farmers in
Luxembourg, had been implemented in 1997. This scheme addressed maintenance of the countryside and landscape. Source:
Anonymous (1998).
Norway
. (UAA 980 000 ha; area with AES unknown). Norway has two major agri-environment schemes. The Acreage and Cultural
Landscape Scheme is mainly aimed at maintaining agricultural practices in marginal areas and has general prescriptions that are
easy to adapt to. The Special Measures for the Cultural Landscape Scheme consists of much more detailed prescriptions, many
having objectives aimed at nature conservation.
Highest uptak
e: unknown. Source: Rønningen (2001).
Portugal
. (UAA
’95
3 924 600 ha; area with AES
’97
606 000 ha; AEP since 1994). Only schemes addressing the reduction of
agricultural pollution and training courses and demonstration projects are applied horizontally, all other schemes are zonal and
most of them address specific farming systems. Emphasis of the Portugese AEP is on the maintenance of extensive farming
systems. The schemes with the
expected
highest uptake rates are those aimed at the maintenance of extensive grazing systems and
Holm Oak landscapes (‘montados’)
. Highest uptak
e: not available yet. Source: Eden & Vieira (2000).
Spain
. (UAA
’95
25 230 300 ha; area with AES
’97
532 000 ha; AEP since 1993). The Spanish AEP is implemented by the individual
regions but a set of mandatory horizontal and zonal schemes is prescribed by the national government. The implementation of
the Spanish scheme has met with considerable delay and data on uptake are only preliminary. Estimated budget allocation
suggests that the emphasis of the Spanish AEP lies on landscape protection (48% of AEP budget) and extensification (30%).
Highest uptak
e: preliminary data indicate that landscape conservation and fire prevention in extensive grasslands are the two
schemes with the highest uptake rates followed by schemes aimed at wildlife protection in extensive croplands. Source: Peco
et al
.
(2000).
Sweden
. (UAA
’95
3 059 700 ha; area with AES
’97
2 449 990 ha; AEP since 1995, previous schemes outside the EU-context since
1986). The Swedish AEP consists of four clusters of schemes each having a different objective. The ‘environmentally sensitive area’
cluster is zonal, the others are basically horizontal. The AEP objectives are to maintain a naturally and culturally valuable and
varied landscape, to conserve biodiversity and to minimize nutrient leaching and pesticide use. Uptake figures indicate that
schemes aimed at the maintenance of open landscapes and conservation of cultural-historical remains are very popular, whereas
uptake of schemes aimed at biodiversity conservation remain far below the targeted areas.
Highest uptak
e: maintenance of open
landscape in forest and northern regions (30% of AEP area) and perennial ley farming (29%). Source: Carlsen & Hasund (2000).
Switzerland
. (UAA
’99
985 000 ha; area with ECA
’99
82 700 ha; ECA since 1993). The Swiss AEP differs considerably from that of
EU-member countries. Farmers throughout Switzerland may manage at least 7% of their UAA as so-called Ecological
Compensation Areas (ECAs) in order to obtain a basic direct payment. The 7% ECA may consist of a variety of biotopes such
as extensive grasslands, traditional orchards, hedges, field margin strips, conservation headlands, ditches, stone walls or unpaved
roads. Farmers can receive additional management subsidies for some of these biotopes, such as extensive grasslands. Some types
of biotopes, such as again extensive grasslands, that meet a certain quality level and/or are located in ecological corridors between
important habitats qualify for additional subsidies. The overall aim of ECAs is halting the agriculturally induced loss of
biodiversity by conserving valuable biotopes, restoring degraded biotopes and creating new biotopes.
Highest uptak
e: low-
intensity meadows (49% of ECA area) and extensively used meadows (41%). Source: Günter
et al
. (2002).
The Netherlands
. (UAA
’95
1 998 900 ha; area with AES
’99
c
. 70 000 ha; AEP since 1992, previous schemes partly under regulation
797/85 and partly outside the EU-context since 1981). The Dutch AEP consists of seven schemes. One scheme (management
agreements) specifically addresses the maintenance and conservation of biodiversity and landscape and is applied zonally. All
other schemes address a variety of topics including demonstration projects, training courses and public access to farmland. In
budgetary terms the zonal scheme is by far the most important.
Highest uptake
: management agreements (90% of AEP area).
Source: Anonymous (2000).
The United Kingdom
. (UAA
’95
16 446 600 ha; area with AES
’97
1 322 000 ha; AEP since 1992, previous schemes under regulation
797/85 since 1987). The AEP varies somewhat between England, Wales, Scotland and Northern Ireland but the basic outline is
the same. For the whole of the UK nine different schemes exist of which only one, the ‘Organic Aid Scheme’ is truly horizontal.
Others can either be applied in certain regions or address certain biotopes. There is a strong emphasis in the UK AEP on wildlife
conservation. The concept of Environmentally Sensitive Areas (ESA) was originally developed in the UK and first implemented
here under regulation 797/85 and still forms the backbone of the UK AEP. Wildlife conservation in the wider countryside is
addressed by the Countryside Stewardship Scheme. Environmental issues play a minor role (Nitrate Sensitive Areas scheme and
Organic Aid Scheme).
Highest uptake
: ESA scheme (58% of AEP budget and 74% of area) and Countryside Stewardship Scheme
(21% of budget and 7% of area). Source: Hart & Wilson (2000).
Table 1.
Continued
16, EC Regulation 746/96). Currently, most evaluation
studies simply examine uptake patterns of different
schemes within programmes. However, implementation
of schemes does not guarantee that the stated object-
ives of the scheme will actually be met. Furthermore,
the biodiversity and environmental objectives are rarely
defined clearly at the outset, which hampers proper
evaluation in a number of countries (Schramek 2001).
Table 2 summarizes all those studies that we have
been able to locate that evaluate the effects of agri-
environment schemes on the abundance or species rich-
ness of organisms. Initially, we performed an extensive
literature review. However, as most evaluation studies
are published outside the mainstream scientific jour-
nals, we also searched the internet and approached
some 40 key people outside the Netherlands and the
United Kingdom to ascertain whether they knew of
any evaluation studies in their country or of any person
who might have more information. Many studies
claimed to evaluate the effects of schemes but simply
952
D. Kleijn &
W. J. Sutherland
© 2003 British
Ecological Society,
Journal of Applied
Ecology
,
40
,
947–969
described the status or trends of species of interest in
the scheme site without any reference or control data.
These studies cannot be used to infer effects of the
changes in management due to the agri-environment
schemes, hence we did not consider them further in this
review. Although we may have missed some studies,
we are confident that we have conducted a thorough
search for studies throughout Europe. We located 62
studies from just six countries, of which 76% were from
just two countries (18 from the Netherlands and 29
from the United Kingdom). Only 27% (17) of the stud-
ies were published in international peer-reviewed jour-
nals. Excluding the United Kingdom and Ireland, 83%
of the studies were published in the national language
and remain therefore largely inaccessible to people out-
side that country (Table 2, Table 3).
The approaches to evaluation varied enormously, even
within individual countries, making it very difficult to
ascribe a specific study design (Table 2). For example,
the most common approach (37% of the studies) com-
pared biodiversity in the agri-environment scheme and
control areas at one point in time. However, some stud-
ies compared entire areas with a mosaic of schemes,
nature reserves and conventional management with
areas that were managed conventionally throughout
and usually were located outside ESAs. Other studies
compared the pooled species diversity of all fields with
agri-environment schemes with the pooled species
diversity of all conventionally managed fields in a sin-
gle area that consisted of a mosaic of scheme and con-
ventional fields. The same difficulties apply to the two
other common study design, examining changes in bio-
diversity (26% of the studies) or trends in time in areas
with and without schemes (32%). Only 34% of the stud-
ies included baseline data, and 16% used a paired study
approach to reduce environmental noise (Table 3).
The number of replicates varied from 1 to 398. The
number of controls was often similar to the number of
replicates but in some cases far larger or smaller (161
controls for 26 experimental replicates and, of greater
concern, 2 controls for 82 experimental replicates).
Two Swiss studies compared the spatial distribution of
birds over the landscape and analysed whether sites
with schemes were used by birds more than would be
expected based on a random distribution. These stud-
ies did not contain formal control areas. The data from
31% of the studies were not analysed statistically. Some
reports divided the analysis into a number of groups,
such as common vs. Red List plant species. To avoid
replication and information overload we selected the
measure (usually species richness) that seemed to best
represent the results. We checked that this was not dis-
torting the conclusions.
Twenty studies (32%) assessed the effects of schemes
on plants, 20 (32%) on various insect groups and
spiders, one (2%) on mammals (brown hare
Lepus euro-
paeus
Pallas) while 29 (47%) studies investigated the
response of birds.
Our results show that plant diversity may be difficult
to enhance with agri-environment schemes (Table 2).
Eleven of the 20 studies addressing botanical diversity
found positive effects of schemes whereas two studies
reported negative effects. Considering the subsample
of 14 studies that subjected the data to some form of
statistical analysis, six studies demonstrated positive
and two studies demonstrated negative effects of
schemes, the remaining seven studies finding no effect
at all. The poor performance of the evaluated agri-
environment schemes with botanical objectives is in
accordance with results of experimental studies. These
generally show that it is extremely difficult to enhance the
botanical diversity of intensively farmed agricultural
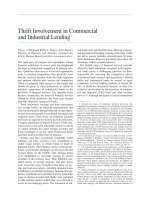
Fig. 1. Conceptual models describing (a) the relationship between farming intensity and the impact of schemes on a farmer’s
activities (solid line) as well as the uptake of those schemes (dashed line), and illustrating (b) the potential effects of schemes
addressing ‘improvement effects’ and ‘protection effects’ (sensu Primdahl et al. 2003). An equal shift in land-use intensity
may result in a more pronounced effect on biodiversity (shaded area) in extensive areas compared with intensive areas.
953
Ecological
effectiveness of
agri-environment
schemes
© 2003 British
Ecological Society,
Journal of Applied
Ecology
,
40
,
947–969
Table 2.
Summary of characteristics of studies that evaluate the effectiveness of agri-environment schemes. Number of replicates and controls in numbers unless other units are given. For abbreviations see Table 1.
Studies that just report status or changes within schemes were excluded
Country Scheme
Investigated
species (group) Design
Number
of
replicates
Number
of
controls
Statistical
analysis
Base-line
data
Duration
study Results Notes Reference
CH ECA –
wildflower
strips
Skylark Relative biotope
use within skylark
territories
24
territories
–Yes No 1995 Skylarks foraged more
frequently and longer
in wildflower strips than in
any other biotope
Weibel
(1998)
CH ECA –
extensive
grasslands
Carabid beetles Comparison ECA
and control sites
16, 7† 7 No No 1997 Higher number of species
and red list species on
extensive and low-intensity
grasslands compared
to control
Pfiffner
et al
.
(2000)*
CH ECA Grass-hoppers Species richness and
abundance on target
sites and wider
countryside before
and after schemes
62 398 Yes Yes 1990 &
2000
Proportion of ECA area
relative to total area
occupied by grasshoppers
increased significantly for
seven species from 1990 to
2000
ECA sites
were perennial
biotopes only
whereas controls
included
arable fields
Hunziker
(2001)
CH ECA –
extensive
grasslands
Grass-hoppers Species richness and
abundance on target
and control sites
before and
after schemes
152 152 Yes Yes 1990 &
2000
Species richness and
abundance of individual
species increased more
on fields with ECA
Peter &
Walter
(2001)*
CH ECA Birds Spatial distribution
of territories
relative to
that of ECA sites
23 – Yes No 1998 &
1999
Five species (mostly
hedgerow species) more
abundant, one species
less abundant on/near
ECAs than expected
Spatial
autocorrelation
between ECA
and vertical
structures.
Explains part
of the
observed effects
Hofer
et al
.
(2002)*,
Spiess,
Marfurt
& Birrer
(2002)*
D Conservation
headlands for
arable weeds
Hoverflies and
carabid beetles
Comparison AES
and control sites
22No No 1988 Species richness and
abundance of hoverflies
and carabid beetles
higher on AES sites
Raskin
(1994)*
(
Cont’d
)
954
D. Kleijn &
W. J. Sutherland
© 2003 British
Ecological Society,
Journal of Applied
Ecology, 40,
947–969
D Conservation of
wet meadows
Black-tailed
godwit, curlew,
snipe
Population trends
inside/outside
AES area
22No No 1989–98 Number of pairs inside
stable and outside declining
or inside declining less
rapidly than outside
AES area
Scheme areas
include fields
of nature
conservation
organization
Weiss
et al.
(1999)*
D Conservation of
wet meadows
Waders Population trends
inside/outside
AES area
2292 ha 437 ha No No 1988–98 Number of pairs inside
stable and outside declining
or inside declining less
rapidly than outside AES
area
Scheme areas
include fields
of nature
conservation
organization
Ikemeyer
& Krüger
(1999)*
D ‘Mittelgebirgs-
programm’ –
grassland
extensification
Plants Changes in species
richness on fields with
and without AES
29 53 No Yes 1986 &
1997
Plant species richness
increases on fields with
AES and remains stable
on control fields
Weis
(2001)*
D ‘Mittelgebirgs-
programm’ –
Resumed grazing
on abandoned
pastures
Plants Trends in species
richness on grazed
AES fields and
exclosures that
serve as controls
86No Yes 1987–90,
1994,
1996 &
1999
Plant species richness
increases slightly in grazed
plots on AES fields and
decreases sharply in
exclosures
Weis
(2001)*
DGrazing
extensification
Plants, various
insect groups
Species richness
and abundance
in a randomized
block design
66Ye sNo1996 Plant diversity not different,
insect richness and
abundance significantly
higher on scheme sites
relative to control sites
Kruess &
Tscharntke
(2002a,b)
EI REPS scheme Plants and
carabid beetles
in grasslands
Species richness
in field boundaries
on farms with
and without REPS
15 15 Yes No 1999 Plant species richness lower;
carabid beetle richness
similar to control farms
Feehan,
Gillmor &
Culleton
(2002)
EI REPS scheme Plants and
carabid beetles
in tillage land
Species richness
in field boundaries
on farms with
and without REPS
15 15 Yes No 2000 Species richness of plants
and carabid beetles similar
on REPS and control
farms
Feehan
et al.
(2002)
Country Scheme
Investigated
species (group) Design
Number
of
replicates
Number
of
controls
Statistical
analysis
Base-line
data
Duration
study Results Notes Reference
Table 2. Continued
955
Ecological
effectiveness of
agri-environment
schemes
© 2003 British
Ecological Society,
Journal of Applied
Ecology, 40,
947–969
EI REPS scheme Farmland birds Species richness
on farms with
and without REPS
55Ye sNo2000 Bird species richness
similar on REPS and
control farms
Flynn
et al. (2002)
NL Botanical
management
agreements
Plants Comparison of
changes on fields
with and
without AES
35 9 No No 1984/85
& 1990
Changes in species
richness/cover similar
on AES fields and
controls
Most of the
control fields
located outside
the ESA
Altenburg
&
Wymenga
(1991)*
NL Meadow bird
agreements
Meadow birds Comparison of
changes on fields
with and
without AES
23 ha 81 ha No Yes 1988 &
1991
Trends in settlement
densities similar on fields
with and without AES
Terlouw
(1992)*
NL Meadow bird
agreements
Meadow birds Comparison of
trends (1) in ESAs
and control
areas and (2) inside
ESAs on fields with
and without schemes
1 : 11
2 : 90
1 :7
2 : 276
Ye sPartially 1986− 90 1. Trends of two species
more positive and one
species more negative in
ESAs relative to outside
ESAs
2. Trends of lapwing more
positive on AES fields
than control fields
1. ESAs
include
reserves
2. Prior to
the scheme
higher densities
of three and
lower densities
of two species
were present
on AES fields
relative to control
fields
Van den
Brink &
Fijn
(1992)*
NL Botanical
management
agreements
Plants Comparison of
trends (1) in
ESAs and control
areas and (2) inside
ESAs on fields with
and without schemes
45–169† 29–35† Yes Partially 1986−90 1. In ESAs more positive
vegetation development
than outside ESAs in
both ditch banks and
grasslands
2. Trends more positive
on AES fields than control
fields in both ditch banks
and grasslands
1. ESAs
include reserves
2. Prior to
scheme ditch
banks contain
less and grasslands
more species on
AES fields
relative to controls
Van den
Brink
& Fijn
(1992)*
Country Scheme
Investigated
species (group) Design
Number
of
replicates
Number
of
controls
Statistical
analysis
Base-line
data
Duration
study Results Notes Reference
Table 2. Continued
(Cont’d)
956
D. Kleijn &
W. J. Sutherland
© 2003 British
Ecological Society,
Journal of Applied
Ecology, 40,
947–969
NL Meadow bird
agreements
Meadow birds Comparison of
population trends
on fields with and
without AES
119 ha 144 ha No No 1987−91 Population trends more
positive on AES fields for
three species
Brandsma
(1993)*
NL Meadow bird
agreements
Meadow birds Comparison of
population trends
on fields with and
without AES
122 ha 702 ha No No 1983,
1986,
1989,
1992 &
1995
Population trends more
positive on AES fields
for six species
Altenburg,
Rebergen &
Wymenga
(1993)*,
Uilhoorn
(1996)*
NL Botanical
management
agreements
Vegetation Comparison of
shifts in vegetation
classes on fields
with and
without AES
255 ha 117 ha No No 1987 &
1993
Shift towards qualitatively
better vegetation classes
between 1987 and 1993
more pronounced on
fields with AES
Vegetation
broadly classified,
significance of
results difficult
to interpret
Wymenga,
Jalving &
Jansen
(1994)*
NL Meadow bird
agreements
Meadow birds Comparison of
population trends
on fields with and
without AES
388 ha 420 ha No No 1985,
1987,
1990 &
1993
Population trends less
negative on AES fields
for two species
Most control
fields outside
ESA in area with
woodlots
Altenburg
& Griffioen
(1994)*
NL Botanical
management
agreements
Vegetation Comparison of
changes in
‘Nature Value
Index’s’ in edges
of fields with
and without AES
26 161 Yes Yes 1990 &
1994
Nature Value Index
decreases significantly
in edges of fields
without but stays stable
in edges of fields with
AES
Dijkstra
(1994)*
NL Botanical
management
agreements
Vegetation Comparison of shifts
in vegetation classes
on fields with and
without AES
86 ha 500 ha No No 1988 &
1994
Shift towards qualitatively
better vegetation classes
between 1988 and 1994
more pronounced on
fields with AES
Vegetation
broadly classified,
significance of
results difficult
to interpret
Ter Stege,
Jalving &
Wymenga
(1995)*
NL Meadow bird
agreements
Meadow birds Comparison of
population trends
on fields with and
without AES
115 ha 49 ha Yes No 1987,
1990
& 1993
No significant differences
between fields with and
without AES
Van Buel
& Vergeer
(1995)*
Country Scheme
Investigated
species (group) Design
Number
of
replicates
Number
of
controls
Statistical
analysis
Base-line
data
Duration
study Results Notes Reference
Table 2. Continued
957
Ecological
effectiveness of
agri-environment
schemes
© 2003 British
Ecological Society,
Journal of Applied
Ecology, 40,
947–969
NL Botanical
management
agreements
Plants Comparison of
changes on fields
with and
without AES
14 14 No Yes 1989 &
1995
Trends in species richness/
cover of (hay meadow)
plant species more positive
on fields with AES
Brongers
& Kolkman
(1996)*
NL Meadow bird
agreements
Meadow birds Comparison of
densities on fields
with and
without AES
189 ha 462 ha No No 1995 Higher settlement densities
of five species on
AES fields
Van Buel
(1996)*
NL Field margin
strips and
conservation
headlands
Insects Comparison of
paired field margin
strip/conservation
headland with
conventional
crop edge
12, 13† 12, 13† Yes No 1995 Higher number of insect taxa,
and higher abundance of lady
bugs (Coccinellidae), dragon
flies (Odonata), bumblebees
(Bombus spp.) and hover flies
(Syrphidae) on AES strips
Analysis makes
no distinction
between
conservation
headlands and
field margin strips
Canters
(1996)*
NL Botanical
management
agreements
Fritillary
(Fritillaria
meleagris)
Trends in abundance
on fields with and
without AES
71 32 Yes Yes 1990,
1994
& 1998
Significant increase in
juvenile plants on AES
fields relative to controls
Brongers
(1999)*
NL Meadow bird
agreements
and botanical
management
agreements
Birds, plants,
bees, hover
flies, butterflies,
carabids
Abundance and
species richness
on paired AES
and control fields
77Ye sNo1998 One carabid beetle species
more abundant on fields
with AES
relative to control sites
Within ESAs
two fields within
a pair in
environmentally
similar areas
Kleijn
et al.
(1999)*
NL Meadow bird
agreements
and botanical
management
agreements
Birds, plants,
bees, hover flies
Abundance and
species richness
on paired AES
and control fields
39 39 Yes No 2000 Diversity and abundance of
plants equal, that of insects
higher on fields with AES.
One bird species less
abundant on AES fields
Within ESAs two
fields within a
pair in
environmentally
similar areas
Kleijn
et al.
(2001,
in press)
NL Meadow bird
agreements
Meadow birds Population trends
on paired AES
and control fields
17 17 Yes partially 1989,
1992
& 1995
Population trends similar
on AES and control fields
Within ESAs
two fields within
a pair in
environmentally
similar areas
Kleijn &
Van Zuijlen
(in press)
Country Scheme
Investigated
species (group) Design
Number
of
replicates
Number
of
controls
Statistical
analysis
Base-line
data
Duration
study Results Notes Reference
Table 2. Continued
(Cont’d)
958
D. Kleijn &
W. J. Sutherland
© 2003 British
Ecological Society,
Journal of Applied
Ecology, 40,
947–969
P Castro Verde
Zonal Plan
Steppe birds Changes in abundance
of species in target and
control sites
16 17 Yes Yes 1995 &
1997
Higher numbers of great
bustard, lesser kestrel and
little bustard in fields with AES
Borralho
et al.
(1999)*
UK North Peaks
ESA
Birds Comparison of AES
and control sites
11Ye sNo1994–1996 Similar densities for eight
species but twite and
lapwing much lower
in ESA
ESA & control
in different regions
and surveyed in
different years
ADAS
(1997a)
UK Breckland ESA
– conservation
headlands
Invertebrates,
plants
Comparison of
AES and control
sites
27 9 Yes No 1993 No significant differences
for a range of variables
ADAS
(1997b)
UK Radnor ESA –
hay meadows
Plants Changes in target
and control plots
16 19 Yes Yes 1994 &
1997
Significant increase
in species richness in
higher tier sites but
not in control or
lower tier
ADAS
(1999b)
UK Radnor ESA –
wetlands
Plants Changes in target
and control plots
15 20 Yes Yes 1994 &
1997
Significant increase in
species richness in higher
tier sites but not in
control or lower tier
ADAS
(1999b)
UK Ynys Môn
ESA – coastal
habitats
Plants Changes in target
and control plots
21 25 Yes Yes 1994–1997 Significant increases in
species suited to grazing
in AES stands contradicts
target but increase
in maritime species is
as required
ADAS
(1999c)
UK Ynys Môn ESA Birds Comparison of
population trends
with those in wider
countryside
20 – Yes No 1995–1998 13 out of 15 wintering
waders and waterfowl
decreased. Five of five
‘target’ passerines
increased. Two of six
breeding waders and
waterfowl increased
Sample sizes
small for
breeding wader
and waterfowl
(mean 2·5
territories in total)
ADAS
(1999a)
Country Scheme
Investigated
species (group) Design
Number
of
replicates
Number
of
controls
Statistical
analysis
Base-line
data
Duration
study Results Notes Reference
Table 2. Continued
959
Ecological
effectiveness of
agri-environment
schemes
© 2003 British
Ecological Society,
Journal of Applied
Ecology, 40,
947–969
UK Lleyn Peninsula
ESA – coastal
grasslands
Plants Changes in target
and control plots
16 4 Yes Yes 1995 &
1998
Significant increase in
species richness in controls
but not in AES
ADAS
(2001b)
UK Clwydian Range
ESA – calcareous
grasslands
Plants Changes in target
and control plots
82 2 Yes Yes 1995 &
1998
No significant difference
in species richness
between years
or treatments
ADAS
(2001a)
UK Clwydian Range
ESA
Butterflies in
calcareous
grassland
Changes in target
and control plots
41No Yes 1995 &
1998
Numbers decreased by
58% on sole control
transect but
increased by 13% on
AES sites
ADAS
(2001a)
UK ESA – arable
reversion
Grey partridge Population trends
in target and
control areas
11Ye sYes 1970–1995 Greater declines on
area with AES
Aebischer
& Potts
(1998)
UK Countryside
Stewardship
Scheme
Stone curlew Population trends
before and after
AES scheme
10No Yes 1991–1999 Increase from 150 pairs
in 1991 to 233 in 1999
after AES introduced.
Rapid decline between
1940s and 1980s
Wardens also
find nests of
and ensure
they are not
damaged by
farming operations
Aebischer
et al.
(2000)
UK ESA – corncrake
initiative
Corncrake Population trends
before and after
AES scheme
10No Yes 1993–1998 4.2% annual increase
after introduction scheme
(1992–98) compared to
3·5% annual decline
in reference period
(1988–93)
Includes purchase
of nature reserves
mainly for
corncrake
Aebischer
et al.
(2000)
UK Pilot Arable
Stewardship
Bumblebees Comparison of
paired sites and
controls. Carried
out for
various schemes
84 84 Yes No 1999–2000 For four schemes higher
numbers in AES than
controls. For one
scheme none on AES.
Numbers generally low
Allen,
Gundrey
& Gardner
(2001)
Country Scheme
Investigated
species (group) Design
Number
of
replicates
Number
of
controls
Statistical
analysis
Base-line
data
Duration
study Results Notes Reference
Table 2. Continued
(Cont’d)
960
D. Kleijn &
W. J. Sutherland
© 2003 British
Ecological Society,
Journal of Applied
Ecology, 40,
947–969
UK Regenerating
heather moors
Moorland birds Abundance and
trends in areas
with and
without AES
12
(1176 ha)
12
(1032 ha)
Ye sNo1996–2000 Black grouse increased
4·6% p.a. with AES but
declined 1·7% p.a. in
controls. Significantly
more females retained
broods in AES. Eight of
11 species rarer in AES
(two significantly)
including black grouse.
Waders and other
gamebirds declined
faster in areas with AES
Baines
et al.
(2002),
Calladine
Baines &
Warren
(2002)
UK Pilot Arable
stewardship
Winter birds Farms with AES
and controls
54 48 Yes No 1998–2000 Of 56 tests of groups
and areas four
significant positive
effects and five
negative
Bradbury
(2001),
Bradbury
& Allen
(2003)
UK Pilot Arable
Stewardship
Breeding birds Farms with AES
and controls
25 24 Yes No 1999–2000 Of 16 comparisons seven
showed positive effect of
AES (one, lapwing
significant) and nine
negative effects
(three, woodpigeon,
sedge warbler and
rook significant)
Bradbury
& Allen
(2003)
UK ESA and
Countryside
Stewardship
Scheme
Butterflies Abundance and
trends in AES
and control sites
85 160 Yes No 1994–2000 Equl numbers increased
and decreased. Lower,
but non significant decline
(12% v 15·5%) on AES
sites. 10 of 13 specialist
species increased
(five significantly)
Over 50% sites
owned by
conservation
organizations
Brereton,
Stewart &
Warren
(2002)
Country Scheme
Investigated
species (group) Design
Number
of
replicates
Number
of
controls
Statistical
analysis
Base-line
data
Duration
study Results Notes Reference
Table 2. Continued
961
Ecological
effectiveness of
agri-environment
schemes
© 2003 British
Ecological Society,
Journal of Applied
Ecology, 40,
947–969
UK Barnacle Goose
Management
Scheme
Barnacle goose Trends in abundance
on reserve and areas
without disturbance
or limited
disturbance
before and after
start scheme
16 0 Yes Yes 1990–2000 Numbers increased at a
proportionately higher
rate on AES sites than
on reserve. No
difference in change
between undisturbed and
limited disturbance sites
Authors suggests
numbers on
reserve reached
capacity thus
increases elsewhere
could be due to
buffer effect
Cope
et al.
(2003)
UK Pilot Arable
Stewardship
True bugs Comparison AES
sites and paired
controls
93 44 Yes No 1999–2000 Higher numbers on six
region/treatment
combinations
(4 significant). Lower
(not significant) in
remaining combination
Gardener
et al.
(2001b)
UK Pilot Arable
stewardship
Carabid beetles Comparison
various AES
options and
controls
82–103† 31–34† Yes No 1999–2000 Of 29 region/treatment/date
combinations higher numbers
in AES for 14 (nine
significant) and lower in five
(two significant). For carabid
larvae of 24 region/higher
treatment/date comparisons
15 higher in AES and nine
lower but none were significant
Gardener
et al.
(2001a)
UK ESA – cereal
headlands
Carabid beetles Comparison of
paired cereal
headlands with
or without AES
22Ye sNo1991 Of three carabids, two more
abundant in AES, one more
abundant in control
Hawthorne,
Hassall &
Sotherton
(1998)
UK Countryside
Stewardship
Scheme
Cirl bunting Trends in bird
numbers inside
scheme or outside
within 47 tetrads
47 47 Yes Yes 1992–1998 Increased by 82% on
land in scheme but by
2% on controls
Peach
et al.
(2001)
UK Pilot Arable
Stewardship
Sawflies Comparison of sites
with AES and
adjacent controls
224 188 Yes No 1999–2000 No obvious effect on
sawfly abundance but
diversity higher
on AES
No distinction
made between
seven different
scheme options
Reynolds
(2001)
Country Scheme
Investigated
species (group) Design
Number
of
replicates
Number
of
controls
Statistical
analysis
Base-line
data
Duration
study Results Notes Reference
Table 2. Continued
(Cont’d)
962
D. Kleijn &
W. J. Sutherland
© 2003 British
Ecological Society,
Journal of Applied
Ecology, 40,
947–969
UK ESAs – raised
water levels
Waders Comparison of
trends in AES
and control sites
84No Yes 1992–1997 Wader numbers increased
in three AES sites, stable
in four AES sites,
decreased in three AES
sites and in four controls
Monitored since
1989, schemes
started 1992
Chown
(1998)
UK Breckland
ESA – cereal
headland
management
Carabid beetles,
spiders,
Heteroptera
Comparison of
uncropped
headlands
and cereal
headlands
with reduced
pesticide input
with controls
32Ye sNo1988 For all groups higher
abundance and more
species than control in
uncropped AES headlands
but only for Heteroptera
in AES with reduced
pesticide inputs
Cardwell,
Hassall &
White
(1994);
Hassall
et al.
(1992);
White
& Hassall
(1994)
UK Breckland
ESA – cereal
headland
management
Carabid beetles Comparison of
paired cereal
headlands with
or without AES
42Ye sNo1991 More species and
diversity than control
in uncropped
AES headlands but not
in AES with reduced
pesticide inputs
Hawthorne
& Hassall
(1995)
UK Pilot Arable
Stewardship
Brown hare Comparison of
farms with AES
and controls
41 38 Yes No 1999–2000 No difference detected
in numbers
Tapper
(2001)
UK ESA Breeding skylark Comparison of
AES and controls
in two ESAs
25–227† 41–49† Yes No 1994–1996 For downland reversion
scheme 3–6 times as
many skylarks on AES
as on controls. For
permanent
grassland reversion AES
had significantly fewer
skylarks for one but
significantly more for
another time period
Wakeham-
Dawson
et al. (1998)
Country Scheme
Investigated
species (group) Design
Number
of
replicates
Number
of
controls
Statistical
analysis
Base-line
data
Duration
study Results Notes Reference
Table 2. Continued
963
Ecological
effectiveness of
agri-environment
schemes
© 2003 British
Ecological Society,
Journal of Applied
Ecology, 40,
947–969
UK ESA Wintering skylarks Comparison on
AES and controls
in two ESAs
113–117† 40–47† Yes No 1994/5–
1996/7
Highest number on
cereal stubbles, then
AES of reverted
downland, then far
fewer on AES of
permanent grassland
reversion and fewest
on winter wheat
Wakeham-
Dawson &
Aebischer
(1998)
*Published in the national language.
†Numbers of replicates differ depending on type of scheme or sampling date.
Country Scheme
Investigated
species (group) Design
Number
of
replicates
Number
of
controls
Statistical
analysis
Base-line
data
Duration
study Results Notes Reference
Table 2. Continued
fields (Berendse et al. 1992), particularly when the
period of intensive use has been long enough to deplete
the local seed bank (Bekker et al. 1997).
The diversity of arthropods appears to be much
easier to enhance through implementation of agri-
environment schemes than other groups. Fourteen of
20 studies reported significant increases in the number
of species and three reported significant increases for
some and decreases for other species in response to
agri-environment schemes. Considering only those
studies that included statistical tests yielded similar
results. Of 17 studies, 11 found positive effects, three
both positive and negative effects, and the remaining
three studies did not find any effects of schemes. Kleijn
et al. (2001) and Kruess & Tscharntke (2002a,b) found
no increase in plant species richness, but nevertheless
reported significant increases in insect diversity on
fields with agri-environment schemes. This positive
effect may be due to reduced levels of disturbance on
less intensively used fields, allowing organisms to com-
plete their life cycle before the vegetation is removed by
mowing or grazing (Kruess & Tscharntke 2002a). As
with plants, increased diversity is usually due to more
common species. However, Hunziker (2001) and Peter
& Walter (2001) found that Ecological Compensation
Areas in Switzerland significantly enhanced the number
and abundance of endangered grasshopper species.
Their studies furthermore indicated the importance
of nearby source populations, for instance in nature
conservation areas, for achieving positive effects of
conservation management on farmland (see also
Duelli & Obrist 2003).
The studies investigating the effects of agri-environment
schemes on birds show no consistent pattern. Thirteen of
29 studies reported positive effects of agri-environment
schemes on bird species richness or abundance, two reported
Table 3. Summary of all studies that were published, in
congress proceedings or in reports. Percentages are given in
relation to the total of 62 studies
Total studies 100%
Published in peer reviewed journals 27%
In national language* 83%
Have control sites 90%
Have replication 77%
Use statistical tests of significance 69%
Analyse changes between two points in time 26%
Analyse trends in time 32%
Have paired scheme and control sites 16%
Have baseline data 34%
Controls, replication and statistical analysis 58%†
Controls, replication, statistical analysis
and reduced bias§
39%‡
*Excluding 32 studies from UK and Ireland.
†Including four studies with just two replicates.
‡Including three studies with just two replicates.
§Bias resulting from scheme sites likely to be placed in better
habitat reduced by use of baseline data, comparing trends/
changes in time or pairing of scheme and control sites.
964
D. Kleijn &
W. J. Sutherland
© 2003 British
Ecological Society,
Journal of Applied
Ecology, 40,
947–969
negative effects and nine reported both positive and
negative effects. Taking the subsample of 19 studies with
statistical tests, only four reported positive effects, two
reported negative effects and nine reported both positive
and negative effects of agri-environment schemes on birds.
The best known agri-environment scheme success is
the cirl bunting Emberiza cirlus (Peach et al. 2001).
This species declined massively in abundance and
range in the 20th century, so that it became restricted to
a small region in Devon and Jersey, UK (Wooton et al.
2000). The species became the target of an intensive
research and management programme by the Royal
Society for the Protection of Birds, English Nature and
the National Trust in the UK. The Country Steward-
ship Scheme offered a standard payment for maintain-
ing low intensity grassland and, in Devon, a special cirl
bunting project was set up to promote weedy spring
sown barley stubble in the species range. Between 1992
and 1998, cirl buntings increased by 83% on land enter-
ing the Countryside Stewardship Scheme, but only by
2% on adjacent land not in the scheme. The population
increased from 118 pairs in 1989 to 450 pairs in 1998.
Similar successful programmes in the United King-
dom for the black grouse Tetrao tetrix (Baines, Warren
& Calladine 2002), stone curlew Burhinus oedicnemus
(Aebischer, Green & Evans 2000) and corncrake Crex
crex (Aebischer et al. 2000) suggest that agri-environment
schemes can work well as part of a closely supervised,
integrated programme. However, it is unreasonable to
extrapolate from such studies to those without inten-
sive support and additional management activities.
Our impression from the literature, discussions
with researchers, extension officers and farmers, and
from visiting a wide range of schemes is that agri-
environment schemes are most effective when they pro-
vide the finances that enable farmers or conservationists
to carry out measures that they feel positive about.
Schemes that are considered financially beneficial but
an inconvenience and with little support, feedback,
encouragement or inspection are much less likely to
provide gains. Thus, we have observed many situations
where the land managers care about the outcome and
tune their management of the agri-environment scheme
to benefit biodiversity. Conversely, we have observed
many other situations where an agri-environment
scheme is clearly considered a financially beneficial
inconvenience and carried out in the minimal manner
possible, without regard to the outcome. It would be
useful to test whether these impressions are correct.
Discussion
-
We are unable to say how effective agri-environment
schemes are in protecting and promoting biodiversity
on farmland. A limited number of well-designed and
thoroughly analysed studies demonstrate convincing
positive effects measured in terms of increased species
diversity or abundance, while other studies show no
effects, negative effects, or positive effects on some
species and negative effects on others. A number of
schemes do not achieve the expected effect or even have
negative side-effects. This suggests that the prescribed
management may require modification. However, modifi-
cations and improvements can only result from a regular
evaluation of all agri-environment schemes.
The most striking conclusion from this review is
that there is a lack of research examining whether
agri-environment schemes are effective. Only the Nether-
lands and the United Kingdom have made any signi-
ficant effort to evaluate the effects of agri-environment
programmes on biodiversity (Table 2). Nevertheless, in
the Netherlands, the usefulness of these studies in evalu-
ating the effectiveness of the main agri-environment
scheme is limited. The studies were contracted out to
a range of different ecological consulting agencies and
the methodology differed between most of the studies,
thereby making an integrated analysis impossible
(Wymenga, Jalving & Ter Stege 1996). Currently, agri-
environment incentive schemes are being initiated in
the Central and Eastern European (CEE) countries that
will join the EU in 2004, but, as far as we know, no
evaluation studies are integrated into these programmes.
The implementation of nation-wide schemes, without
learning from the mistakes made by their predecessors
in other parts of Europe, represents a missed opportunity
to make agri-environment programmes as effective as
possible from the outset.
This review has revealed a considerable bias towards
studies in intensively farmed areas. Uptake of schemes
is higher in areas farmed under extensive systems, but
we found very few evaluation studies in extensive areas.
Currently, biodiversity levels are low in most intens-
ively farmed areas (Kleijn & Van der Voort 1997; Kleijn
et al. 2001). Agri-environment schemes targeted at
these areas are expected to enhance species diversity
over time (Fig. 1b; improvement effects). Generally,
biodiversity levels are higher in extensively farmed
areas (Wolff et al. 2001; Dullinger et al. in press). Agri-
environment schemes are expected to maintain this
diversity by protecting areas from intensification or
abandonment (Fig. 1b; protection effects). Changes in
land-use intensity will have a greater impact on bio-
diversity in extensively farmed land than on intensively
used farmland (Fig. 1b, see also Potter & Goodwin
1998). Agri-environment schemes that aim to protect
biodiversity in extensively farmed areas may therefore
be more effective than those aiming to improve bio-
diversity in intensively farmed areas. Most studies
detailed in Table 2 are from intensively farmed areas in
Western Europe; studies are lacking completely from
the Mediterranean countries. It is unlikely that results
from the studies carried out so far (Table 2) can be
extrapolated at all to southern European countries,
hence there is a need for more research in these countries.
965
Ecological
effectiveness of
agri-environment
schemes
© 2003 British
Ecological Society,
Journal of Applied
Ecology, 40,
947–969
We conclude that the experimental designs of a large
proportion of the evaluation studies are weak. The
main approach was to compare areas of land under
existing agri-environment schemes with control areas
not covered by schemes. If sites qualifying for agri-
environment schemes are located preferentially in the
most diverse areas, comparisons between these and
control sites will be biased towards giving favourable
results. Bias is unavoidable if study sites in designated
areas (for instance Environmentally Sensitive Areas
selected on the basis of their conservation interest) are
compared with control areas outside designated areas.
Furthermore, farmers that volunteer to enter agri-
environment schemes may already farm in a more
environmentally sensitive manner. In the Netherlands
this is compounded when farmers locate schemes on
the more inaccessible or marginal fields within a farm
(Kleijn et al., in press), and in the UK agri-environment
schemes are often located in habitats of greater conser-
vation interest (Carey et al. 2002). Kleijn & Van Zuijlen
(in press) reanalysed data of Van Buel (1996) and found
significantly higher densities of meadow birds on fields
managed under agri-environment schemes relative to
conventionally managed fields. They showed that the
higher meadow bird densities were primarily due to the
higher quality of fields within schemes (higher ground-
water table). Between 1989 and 1995 population trends
were similar on fields within schemes and on control
fields. It was shown that the difference observed by Van
Buel (1996) in 1995 was caused primarily by differences
in initial site conditions.
Bias can be avoided by randomly assigning half of
a subset of farmers that sign up for schemes to the
control treatment (continue farming as they had done
prior to the scheme) and the other half to the scheme
treatment. For small-scale measures, it may be more
practical to ask farmers to identify a pair of sites and
then allocate one at random to be managed under the
agri-environment scheme and the other to be managed
conventionally. This would neutralize any influence of
farmer or agri-environment scheme officer on the ini-
tial quality of scheme and control sites. Baseline data
should be collected prior to the start of the scheme and
repeated biodiversity surveys should be carried out in
subsequent years, or in the final year of the scheme.
This would then give a fair estimate of the effects of the
scheme. This method has been adopted in the UK
study of the environmental consequences of genetically
modified (GM) herbicide tolerant crops. Individual
fields were divided in two and one half was randomly
allocated to the GM treatment while the other half
contained the control with conventional crops (Firbank
et al. 2003; Perry et al. 2003). Clearly, it is essential
that allocation of a site to experimental or control
must be random and cannot be influenced by local
decisions.
Where the ideal situation is not possible, for example
when a scheme that is already in place needs to be evalu-
ated (which will be the rule rather then the exception),
the best possible alternatives are (i) to collect baseline
data, (ii) to examine trends in time, and (iii) to try to
reduce systematic differences in initial conditions
between scheme and control sites as far as possible.
Great care should be taken to pair scheme areas with
nearby control areas that are similar in most respects
(e.g. soil type, groundwater table and landscape struc-
ture) so that these are eliminated as confounding
factors. However, it will remain difficult to interpret
positive results with confidence. None of the studies
reviewed here met standards set in the previous section
and only a few complied with the ‘best alternatives’
described above. For instance, only 36 studies had
controls, sufficient replication and rigorous statistical
analysis (Table 3). Just 24 studies from five countries
additionally made use of baseline data, and/or trend
analysis, and/or pairing of control and scheme sites.
-
What is the efficiency of agri-environment schemes (the
benefits per unit costs)? None of the studies listed in
Table 2 addressed this aspect. Up to 2003, $24 300 mil-
lion has been spent in the 15 EU countries alone (EEA
2002). Most of this money was spent on measures
whose objectives were not biodiversity conservation. It
is impossible to estimate the amount spent on biodi-
versity conservation schemes and no estimates of bene-
fits are available either. Hanley, Whitby & Simpson
(1999) compared costs and benefits of the United
Kindom ESA scheme and found that benefits greatly
outweighed the costs. Benefits were estimated by means
of the Contingent Valuation Method, a survey-based
approach that directly elicits preferences for environ-
mental goods from individuals. However, it is import-
ant to point out that ‘respondents were shown pictures
of the landscape “with” and “without” the ESA, but were
not given any information on the probability of suc-
cessful restoration of the “with scenario”, nor how long
it would take’ (Hanley et al. 1999). Thus, individuals
valued agri-environment schemes on the assumption
that they would result in increased diversity. Our review
shows that this is not always the case. Thus, there is a
need for studies that directly link the costs of schemes
with their biodiversity benefits. To our knowledge,
the only study that has attempted this correlated the
amount of agri-environmental subsidy received for the
management of grassland fields in Austria with plant
species richness of those fields (Zechmeister et al.
2003). They found no positive relationship between
amount of subsidy and botanical diversity.
Some agri-environment schemes have other objectives
besides biodiversity conservation. The environmental
and economic benefits of these other objectives may be
substantial, particularly when their impact extends
966
D. Kleijn &
W. J. Sutherland
© 2003 British
Ecological Society,
Journal of Applied
Ecology, 40,
947–969
outside the area targeted for the schemes (Daily &
Ellison 2002). For example, in Germany the conversion
of 6% of permanent grassland to arable land resulted in
the release of 10 tonnes nitrogen ha
−1
(as NO
3
) and
100 tonnes of carbon (as CO
2
) as well as enhanced
winter water runoff. This has been suggested as a con-
tribution towards the greater flooding frequencies
along the major German rivers (Van der Ploeg, Ehlers
& Sieker 1999). Agri-environment schemes that revert
arable land to permanent grassland should result in
reduced emissions and flooding frequencies in the
wider countryside, as well as enhancing biodiversity.
In the UK, creating a 80-m wide salt marsh along an
eroding coast can result in the annual cost of coastal
defence dropping from c. $7200 m
−1
to c. $600 m
−1
(House of Commons Select Committee on Agriculture
1998). Economic analysis showed that ecological pro-
tection and restoration of the Catskill-Delaware water-
shed was a more cost effective means of protecting the
water quality for New York than improving the technology
for water treatment (Ashendorff et al. 1997).
The outcome of this review does not allow for a general
judgement of the effectiveness of agri-environment
schemes because of a lack of sufficiently rigorous
studies. There is a particularly urgent need for studies
evaluating the effects of schemes in extensively farmed
areas and in Mediterranean countries. The fact that a
number of studies found no change or even negative
effects of agri-environment schemes on biodiversity
highlights the importance of regular evaluations of all
major agri-environment schemes. To do this, it is nec-
essary to formulate clear and unambiguous biodivers-
ity objectives for each scheme, if they have not been
formulated already. Furthermore, the design of evalu-
ation studies deserves more attention. Studies should
include the collection of baseline data, should incor-
porate control sites that are similar to scheme sites in
every respect but the change in management, and both
control sites and scheme sites should be sufficiently
replicated. This can be achieved most effectively by
making evaluation programmes an integral part of
each agri-environment programme. The results of these
studies need to be disseminated to the international sci-
entific community, preferably through publication in
international peer-reviewed journals, or by making an
institution responsible for collating and distribut-
ing this type of research. Only then will we be able to (i)
find out why some schemes are effective and others
not, (ii) determine how existing schemes can be made
more effective, and (iii) decide what schemes may be
abandoned and how new schemes should be formulated.
Acknowledgements
We thank Jon Marshall for suggesting this review and
the following for providing useful information: Jacques
Baudry, Harriet Bennett, Nigel Boatman, Anne Bonis,
Pierre-Yves Bontemps, Richard Bradbury, Val Brown,
Pierre Burghart, Nigel Critchley, Nicola Crockford,
Mario Diaz, Jane Feehan, John Feehan, Maeve Flynn,
Aldina Franco, Gary Fry, Des Gillmor, Phil Grice,
Knut Per Hasund, Johnny Kahlert, Mikko Kuussaari,
Anders Larsson, Leonidas Louloudis, Bernhard
Osterburg, Jørgen Primdahl, Katrina Rønningen,
Norbert Sauberer, Wolfgang Schumacher, Riccardo
Simoncini, Franz Sinabell, Patrick Steyaert and Anki
Weibull. The constructive comments of three anonym-
ous referees and Gillian Kerby are much appreciated.
The work of D.K. was done within the framework of the
EU-funded project ‘EASY’ (QLK5-CT-2002–01495).
References
ADAS (1997a) Monitoring of Breeding Birds in the North Peak
ESA 1994–96. ADAS report to Ministry of Agriculture,
Fisheries and Food, London.
ADAS (1997b) Biology Monitoring of Arable Field Margins in
the Breckland ESA 1989–96. ADAS report to Ministry of
Agriculture, Fisheries and Food, London.
ADAS (1999a) Bird Monitoring in the Ynys Môn ESA 1995–
98. ADAS report to Welsh Office Agriculture Department,
Cardiff.
ADAS (1999b) Environmental Monitoring in the Radnor ESA
1993–97. Report to Welsh Office Agriculture Department,
Cardiff.
ADAS (1999c) Environmental Monitoring in the Ynys Môn
ESA 1993– 97. ADAS report to the Welsh Office Agriculture
Department, Cardiff.
ADAS (2001a) Environmental Monitoring in the Clwydian
Range ESA 1994–98. Report to Welsh Office Agriculture
Department, Cardiff.
ADAS (2001b) Environmental Monitoring in the Lleyn Penin-
sula ESA 1989–98. Report to Welsh Office Agriculture
Department, Cardiff.
Aebischer, N.J., Green, R.E. & Evans, A.D. (2000) From
science to recovery: four case studies of how research has
been translated into conservation action in the UK.
Ecology and Conservation of Lowland Farmland Birds (eds
N.J. Aebischer, A.D. Evans, P.V. Grice & J.A. Vickery),
pp. 43–54. British Ornithologists Union, Tring, UK.
Aebischer, N.J. & Potts, G.R. (1998) Spatial changes in grey
partridge (Perdix perdix) distribution in relation to 25 years
of changing agriculture in Sussex, U.K. Gibier Faune Sau-
vage, 15, 293–308.
Allen, D.S., Gundrey, A.L. & Gardner, S.M. (2001) Bumble-
bees. Technical appendix to ecological evaluation of the
arable stewardship pilot scheme 1998–2000. ADAS,
Wolverhampton, UK.
Altenburg, W. & Griffioen, R. (1994) Evaluatie van het
beheersplan Midden-Opsterland VI. Weidevogels in Midden-
Opsterland in 1985–93 resp. in Henswoude in 1993. Publicatie
no. 73. Altenburg & Wymenga Veenwouden/Directie Beheer
Landbouwgronden, Utrecht.
Altenburg, W., Rebergen, B. & Wymenga, E. (1993) Weidevo-
gels in de Terschellingerpolder in 1983–92. Publicatie no. 65.
Altenburg & Wymenga, Veenwouden/Directie Beheer Land-
bouwgronden, Utrecht.
Altenburg, W. & Wymenga, E. (1991) Evaluatie van het
beheersplan Midden-Opsterland V. Weidevogels en vegetatie
in 1984/85–1990. Publicatie no. 46. Altenburg & Wymenga,
Veenwouden/Directie Beheer Landbouwgronden, Utrecht.
Andersen, E., Henningsen, A. & Primdahl, J. (2000) Den-
mark: implementation of new agri-environmental policy
based on Regulation 2078. Agri-Environmental Policy in the
967
Ecological
effectiveness of
agri-environment
schemes
© 2003 British
Ecological Society,
Journal of Applied
Ecology, 40,
947–969
European Union (eds H. Buller, G.A. Wilson & A. Höll),
pp. 31–50. Ashgate, Aldershot, UK.
Anonymous (1998) Working Document, ‘State of application of
regulation (EEC) no. 2078/92: Evaluation of agri-environment
programmes’, VI/7655/98, 9·11·1998 available at http://
europa.eu.International/comm/agriculture/envir/programs/
evalrep/text_en.pdf.
Anonymous (2000) Natuurbalans 2000. Rijksinstituut voor
Volksgezondheid en Milieuhygiene, Bilthoven/Alterra,
Wageningen/ Landbouw-Economisch Instituut’s-Gravenhage.
Ashendorff, A., Principe, M.A., Seeley, A., LaDuca, J.,
Beckhardt, L., Faber, W. & Mantus, J. (1997) Watershed
protection for New York City’s supply. Journal of American
Water Works Assessment, 89, 75–88.
Baines, D., Warren, P. & Calladine, J. (2002) Spatial and
temporal differences in the abundance of black grouse and
other moorland birds in relation to reductions in sheep
grazing. Aspects of Applied Biology, 67, 245–252.
Bekker, R.M., Verweij, G.L., Smith, R.E.N., Reine, R.,
Bakker, J.P. & Schneider, S. (1997) Soil seed banks in Euro-
pean grasslands: does land use affect regeneration perspect-
ives? Journal of Applied Ecology, 34, 1293–1310.
Benton, T.G., Bryant, D.M., Cole, L. & Crick, H.Q.P. (2002)
Linking agricultural practice to insect and bird populations:
a historical study over three decades. Journal of Applied
Ecology, 39, 673–687.
Berendse, F., Oomes, M.J.M., Altena, H.J. & Elberse, W. Th
(1992) Experiments on the restoration of species-rich
meadows in The Netherlands. Biological Conservation, 62,
59–65.
Beringer, J.E. (2000) Releasing genetically modified organ-
isms: will any harm outweight any advantage? Journal of
Applied Ecology, 37, 207–214.
Borralho, R., Rio Carvalho, C., Stoate, C., Araújo, M. &
Reino, L.M. (1999) Avaliação intermédia do impacte do
Plano Zonal de Castro Verde na avifauna. Actas do II Con-
gresso de Ornitologia da Sociedade Portuguesa para o
Estudo das Aves (eds P. Beja, P. Catry & F. Moreira), pp. 52–
54. SPEA, Faro.
Bradbury, R. (2001) Winter Birds. Technical Appendix to eco-
logical evaluation of the arable stewardship pilot scheme
1998–2000. ADAS, Wolverhampton, UK.
Bradbury, R.B. & Allen, D.S. (2003) Evaluation of the impact
of the pilot UK arable stewardship scheme on breeding and
wintering birds. Bird Study, 50, 131–141.
Brandsma, O.H. (1993) Weidevogels in het onderzoeksgebied
Giethoorn-Wanneperveen 1987–91. Publicatie no. 63. De Veren-
iging tot Behoud van Natuurmonumenten’s-Graveland/
Directie Beheer Landbouwgronden, Utrecht.
Brereton, T., Stewart, K.S. & Warren, M.S. (2002) Developing
a System for Assessing the Effect of Agri-Environment
Schemes on Butterfly Populations. Report to Department of
Farming and Rural Affairs, London, UK.
Brongers, M. (1999) Kievitsbloemen in de oeverlanden van
het Zwarte Water bij verschillende typen graslandgebruik.
III. Ontwikkelingen in de Periode 1990–98. DLG rapport
no. 116. Altenburg and Wymenga, Veenwoude/Dienst Lan-
delijk Gebied, Utrecht.
Brongers, M. & Kolkman, S. (1996) De vegetatie van het
relatienotagebied vechtdal in de periode 1989–95. LBL Pub-
licatie No. 91. Altenburg & Wymenga, Veenwoude/Dienst
Landinrichting en Beheer Landbouwgronden, Utrecht.
Buckingham, D.L., Evans, A.D., Morris, A.J., Orsman, C.J.
& Yaxley, R. (1999) Use of set-aside land in winter by
declining farmland bird species in the UK. Bird Study, 46,
157–169.
Buller, H. & Brives, H. (2000) France: farm production and
rural product as key factors influencing agri-environmental
policy. Agri-Environmental Policy in the European Union
(eds H. Buller, G.A. Wilson & A. Höll), pp. 9–30. Ashgate,
Aldershot, UK.
Buller, H., Wilson, G.A. & Höll, A., eds (2000) Agri-Environmental
Policy in the European Union. Ashgate, Aldershot, UK.
Calladine, J., Baines, D. & Warren, P. (2002) Effects of
reduced grazing on population density and breeding
success of black grouse in northern England. Journal of
Applied Ecology, 39, 772–780.
Canters, K.J., ed. (1996) Een oriënterend onderzoek naar de
effecten van akkerrandenbeheer op ziekten, plagen en biodi-
versiteit. LBL publicatie no. 88. Centrum voor Milieukunde,
Rijksuniversiteit Leiden, Leiden/Dienst Landinrichting en
Beheer Landbouwgronden, Utrecht.
Cardwell, C., Hassall, M. & White, P. (1994) Effects of head-
land management on carabid beetle communities in Breck-
land cereal fields. Pedobiologia, 38, 50–62.
Carey, P.D., Barnett, C.L., Greensdale, P.D., Garbutt, R.A.,
Warman, E.A., Myhill, D., Scott, R.J., Smart, R.J.,
Manchester, S.J., Robinson, J., Walker, K.J., Howard, D.C. &
Firbank, L.G.A. (2002) Comparison of the ecological quality
of land between an English agri-environment scheme and the
countryside as a whole. Biological Conservation, 108, 183–197.
Carlsen, H. & Hasund, K.P. (2000) Sweden: agri-environmental
policy and the production of landscape qualities. Agri-
Environmental Policy in the European Union (eds H. Buller,
G.A. Wilson & A. Höll), pp. 51–70. Ashgate, Aldershot, UK.
CEC − Commission of the European Communities (1985)
Perspectives for the Common Agricultural Policy. Brussels,
COM, 85, 333.
Chown, D.J. (1998) Somerset Levels and Moors Breeding
Wader Survey 1997. Unpublished Report. Royal Society for
the Protection of Birds, Sandy, Beds, UK.
Clarke, J., ed. (1992) Set-Aside. BCPC Monograph 50. The
British Crop Protection Council, Farnham, UK.
Cope, D.R., Pettifor, R.A., Griffin, L.R. & Rowcliffe, J.M.
(2003) Integrating farming and wildlife conservation: the
barnacle goose management scheme. Biological Conserva-
tion, 110, 113–122.
Daily, G. & Ellison, K. (2002) The Economy of Nature. Island
Press, Washington DC.
Dijkstra, A.A. (1994) Vegetatie-onderzoek Relatienotagebied
Nieuwkoop 1990–94. Publicatie no. 76. Provincie Zuid-
Holland/Consulentschap Natuur, Bos, Landschap en
Fauna/Directie Beheer Landbouwgronden, Utrecht.
Donald, P.F. Green, R.E. & Heath, M.F. (2000) Agricultural
intensification and the collapse of Europe’s farmland bird
populations. Proceedings of the Royal Society London
Series B, 268, 25–29.
Donald, P.F., Pisano, G., Rayment, M.D. & Pain, D.J. (2002)
The common agricultural policy, EU enlargement and
the conservation of Europe’s farmland birds. Agriculture,
Ecosystems and Environment, 89, 167–182.
Duelli, P. & Obrist, M.K. (2003) Regional biodiversity in an
agricultural landscape: the contribution of seminatural
habitat islands. Basic and Applied Ecology, 4, 129–138.
Dullinger, S., Dirnböck, T., Greimler, J. & Grabherr, G.
(2003) A resampling approach for evaluating effects of
pasture abandonment on subalpine plant species diversity.
Journal of Vegetation Science, 14, 243–252.
Eden, P. & Vieira, M. (2000) Portugal: agri-environmental
policy and the maintenance of biodiversity-rich extensive
farming systems. Agri-Environmental Policy in the Euro-
pean Union (eds H. Buller, G. A. Wilson & A. Höll), pp. 203 –
217. Ashgate, Aldershot, UK.
EEA- European Environmental Agency (2002) Environ-
mental Signals 2002. Environmental Assessment Report
No. 9. European Environmental Agency, Copenhagen.
Emerson, H.J. & Gillmor, D.A. (1999) The Rural Environ-
ment Protection Scheme of the Republic of Ireland. Land
Use Policy, 16, 235–245.
Feehan, J., Gillmor, D.A. & Culleton, N.E. (2002) The impact
of the Rural Environment Protection Scheme (REPS) on
plant and insect diversity. Tearmann, 2, 15–28.
968
D. Kleijn &
W. J. Sutherland
© 2003 British
Ecological Society,
Journal of Applied
Ecology, 40,
947–969
Firbank, L.G., Heard, M.S., Woiwod, I.P., Hawes, C.,
Haughton, A.J., Champion, G.T., Scott, R.J., Hill, M.O.,
Dewar, A.M., Squire, G.R., May, M.J., Brooks, D.R.,
Bohan, D.A., Daniels, R.E., Osborne, J.L., Roy, D.B.,
Black, H.I.J., Rothery, P. & Perry, J.N. (2003) An introduc-
tion to the Farm-Scale Evaluations of genetically modified
herbicide-tolerant crops. Journal of Applied Ecology, 40, 2–16.
Flynn, M., Kavanagh, B., Culleton, N. & Carton, O. (2002) An
evaluation of the impact of the Rural Environmental Protec-
tion Scheme on biodiversity using birds as bio-indicators.
Conservation pays? – Reconciling environmental benefits with
profitable grassland systems (ed. J. Frame), pp. 111–114.
Occasional Symposium No. 36, British Grassland Society.
Gardener, S.M., Allen, D.S., Gundrey, A.L., Luff, M.L. &
Mole, A.C. (2001a) Ground Beetles. Technical appendix to
ecological evaluation of the arable stewardship pilot scheme
1998–2000. ADAS, Wolverhampton, UK.
Gardener, S.M., Allen, D.S., Woodward, J., Mole, A.C. &
Gundrey, A.L. (2001b) True Bugs. Technical appendix to
ecological evaluation of the arable stewardship pilot
scheme 1998–2000. ADAS, Wolverhampton, UK.
Grafen, A. & Schramek, J. (2000) Germany: complex agri-
environmental policy in a federal system. Agri-Environmental
Policy in the European Union (eds H. Buller, G.A. Wilson &
A. Höll), pp. 119–143. Ashgate, Aldershot, UK.
Groier, M. & Loibl, E. (2000) Austria: towards an environ-
mentally sound agriculture. Agri-Environmental Policy in
the European Union (eds H. Buller, G.A. Wilson & A. Höll),
pp. 169–184. Ashgate, Aldershot, UK.
Günter, M., Schläpfer, F., Walter, T. & Herzog, F. (2002)
Direct Payments for Biodiversity Provided by Swiss Farmers:
An Economic Interpretation of Direct Democratic Decision.
Report. OECD, Paris.
Hanley, N., Whitby, M. & Simpson, I. (1999) Assessing the
success of agri-environmental policy in the UK. Land Use
Policy, 16, 67–80.
Hart, K. & Wilson, G.A. (2000) United Kingdom: from agri-
environmental policy shaper to policy receiver? Agri-
Environmental Policy in the European Union (eds H. Buller,
G.A. Wilson & A. Höll), pp. 169–184. Ashgate, Aldershot, UK.
Hassall, M., Hawthorne, A., Maudsley, M., White, P. &
Cardwell, C. (1992) Effects of headland management on
invertebrate communities in cereal fields. Agriculture, Eco-
systems and Environment, 40, 155–178.
Hawthorne, A. & Hassall, M. (1995) The effect of cereal head-
land treatments on carabid communities. Acta Jutlandica,
70, 185–198.
Hawthorne, A.J., Hassall, M. & Sotherton, N.W. (1998)
Effects of cereal headland treatments on the abundance and
movements of three species of carabid beetles. Applied Soil
Ecology, 9, 417–422.
Hofer, G., Herzog, F., Spiess, M. & Birrer, S. (2002) Vegeta-
tion und Brutvögel als Öko-Indikatoren im Mittelland.
Agrarforschung, 9, 152–157.
House of Commons Select Committee on Agriculture (1998)
House of Commons Select Committee on Agriculture. Sixth
Report: Flood and Coastal Defence, London, UK.
Hunziker, M. (2001) Grasshoppers and bush-crickets in an
agricultural landscape: the effects of ecological compensa-
tion areas and nature reserves. MSc Thesis, University
Zürich, Switzerland.
Ikemeyer, D. & Krüger, B. (1999) Bestandsmonitoring bei
‘Wiesenvögeln’ in Feuchtwiesenschutzgebieten. LÖBF-
Mitteilungen, 3, 42–46.
INEA − Istituto Nazionale di Economia Agraria (1999) Agri-
Environmental Measures in Italy. State of Application of Reg.
(EEC) 2078/92. Istituto Nazionale di Economia Agraria,
Roma.
Kleijn, D., Berendse, F., Smit, R. & Gilissen, N. (2001) Agri-
environment schemes do not effectively protect biodiversity
in Dutch agricultural landscapes. Nature, 413, 723–725.
Kleijn, D., Berendse, F., Smit, R. & Gilissen, N., Smit, J.,
Bark, B. & Groeneveld, R. (in press) The ecological effec-
tiveness of agri-environment schemes in different agricul-
tural landscapes in The Netherlands. Conservation Biology.
Kleijn, D., Boekhoff, M., Ottburg, F., Gleichman, M. &
Berendse, F. (1999) De effectiviteit van agrarisch natuurbe-
heer. Landschap, 16, 227–235.
Kleijn, D. & Van der Voort, L.A.C. (1997) Conservation
headlands for rare arable weeds: the effects of fertilizer
application and light penetration on plant growth. Biolog-
ical Conservation, 81, 57–67.
Kleijn, D. & Van Zuijlen, G. (in press) The conservation
effects of meadow bird agreements on farmland in Zeeland,
The Netherlands, in the period 1989–95. Biological Conser-
vation, in press.
Kruess, A. & Tscharntke, T. (2002a) Contrasting responses of
plant and insect diversity to variation in grazing intensity.
Biological Conservation, 106, 293–302.
Kruess, A. & Tscharntke, T. (2002b) Grazing intensity and the
diversity of grasshoppers, butterflies, and trap-nesting bees
and wasps. Conservation Biology, 16, 1570–1580.
Louloudis, L., Beopoulos, N. & Vlahos, G. (2000) Greece:
late implementation of agri-environmental policies. Agri-
Environmental Policy in the European Union (eds H. Buller,
G.A. Wilson & A. Höll), pp. 71–93. Ashgate, Aldershot, UK.
Louloudis, L. & Dimopoulos, D. (2001) The experience of
agri-environment schemes in Greece. Examples of Eur-
opean Agri-Environment Schemes and Livestock Systems
and Their Influence on Spanish Cultural Landscapes (eds
R.G.H. Bunce, M. Pérez-Soba, B.S. Elbersen, M.J. Prados,
E. Andersen, M. Bell & P.J.A.M. Smeets), pp. 59 –62. Alterra-
Report 309, Alterra, Green World Research, Wageningen.
Mäder, P., Flieβbach, A., Dubois, D., Gunst, L., Fried, P. &
Niggli, U. (2002) Soil fertility and biodiversity in organic
farming. Science, 296, 1694–1697.
Matthews, A. (2002) Has agricultural policy responded to the
Rio challenge? Achievements and Challenge – Rio+10 and
Ireland (eds F. Convery & J. Feehan), pp. 73–82. The Envir-
onmental Institute, UCD, Dublin.
Osterburg, B. (2001) Agri-environmental programs and
the use of soil conservation measures in Germany. Sus-
taining the Global Farm (eds D.E. Stot, R.H. Mohtar &
G.C. Steinhardt), pp. 112–118. Selected papers from the
10th International Soil Organization Meeting at Purdue
University. West Lafayette, USA.
Peach, W.J., Lovett, L.J., Wotton, S.R. & Jeffs, C. (2001)
Countryside stewardship delivers cirl buntings (Emberiza
cirlus) in Devon, UK. Biological Conservation, 101, 361–373.
Peco, B., Suárez, F., Oñate, J.J., Malo, J.E. & Aguirre, J. (2000)
Spain: first tentative steps towards an agri-environmental
programe. Agri-Environmental Policy in the European
Union (eds H. Buller, G.A. Wilson & A. Höll), pp. 145–168.
Ashgate, Aldershot, UK.
Perry, J.N., Rothery, P., Clark, S.J., Heard, M.S. & Hawes, C.
(2003) Design, analysis and statistical power of the Farm-
Scale Evaluations of genetically modified herbicide-
resistant crops. Journal of Applied Ecology, 40, 17–32.
Peter, B. & Walter, T. (2001) Heuschrecken brauchen ökolo-
gische Ausgleichsflächen. Agrarforschung, 8, 452–457.
Petersen, J.E. & Feehan, J. (2003) Agri-environmental pro-
grammes and the Accession countries. Paper of Conference
EU: CAP and Enlargement – An Opportunity for Nature and
Environment? 19–21 February 2003, Potsdam, Germany.
Available at />documents/Petersen2_en_000.pdf.
Pfiffner, L., Luka, H., Jeanneret, P. & Schüpbach, B. (2000)
Effekte ökologischer Ausgleichsflächen auf die Laufkäfer-
fauna. Agrarforschung, 7, 212–217.
Potter, C. & Goodwin, P. (1998) Agricultural liberalization in
the European Union: an analysis of the implications for
nature conservation. Journal of Rural Studies, 14, 287–298.
969
Ecological
effectiveness of
agri-environment
schemes
© 2003 British
Ecological Society,
Journal of Applied
Ecology, 40,
947–969
Pretty, J.N., Brett, C., Gee, D., Hine, R.E., Mason, C.F.,
Morison, J.I.L., Raven, H., Rayment, M.D. & van der Bijl,
G. (2000) An assessment of the total external costs of UK
agriculture. Agricultural Systems, 65, 113–136.
Pretty, J., Brett, C., Gee, D., Hine, R., Mason, C., Morison, J.,
Rayment, M., Van der Bijl, G. & Dobbs, T. (2001) Policy
challenges and priorities for internalizing the externalities
of modern agriculture. Journal of Environmental Planning
and Management, 44, 263–283.
Primdahl, J., Peco, B., Schramek, J., Andersen, E. & Oñate,
J.J. (2003) Environmental effects of agri-environmental
schemes in Western Europe. Journal of Environmental Man-
agement, 67, 129–138.
Raskin, R. (1994) Das Ackerrandstreifenprogramm: tierökolo-
gische und agrarökonomische Aspekte. Aus Liebe zur Natur
(eds W. Schumacher, B. Röhlinger-Nord & M. Mangold),
pp. 150–157. Stiftung Naturschutz Hamburg/Stiftung zum
Schutz gefährdeter Pflanzen, Hamburg, Germany.
Reheul, D. & van Huylenbroeck, G. (2000) Beheersover-
eenkomsten op grasland: Eindrapport. Vakgroepen Plan-
taardige Produktie en Landbouweconomie. Universiteit
Gent, Gent.
Reynolds, C. (2001) Sawflies. Technical appendix to ecological
evaluation of the arable stewardship pilot scheme 1998–
2000. ADAS, Wolverhampton, UK.
Robinson, R.A. & Sutherland, W.J. (2002) Changes in arable
farming and biodiversity in Great Britain. Journal of
Applied Ecology, 39, 157–176.
Rønningen, K. (2001) The Meaning of Farming and Land-
scape within Agricultural Policies and Strategies. Paper No.
6/01. Centre for Rural Research, University Centre, Trond-
heim, Norway.
Schramek, J. (2001) Agrarumweltprogramme in der EU –
Ergebnisse aus 22 Fallstudienregionen. Agrarumweltpro-
gramme – Konzepte, Entwicklungen, Künftige Ausgestaltung
(eds B. Osterburg & H. Nieberg), pp. 65–76. Landbaufor-
schung Völkenrode, Sonderheft 231, FAL, Braunschweig.
Spiess, M., Marfurt, C. & Birrer, S. (2002) Evaluation der
Ökomassnahmen mit Hilfe von Brutvögeln. 2, 9, 158–
163.
Sutherland, W.J. (2002) Restoring a sustainable countryside.
Trends in Ecology and Evolution, 17, 148–150.
Tapper, S. (2001) Brown Hare. Technical appendix to ecolog-
ical evaluation of the arable stewardship pilot scheme 1998–
2000. ADAS, Wolverhampton, UK.
Ter Stege, E.A., Jalving, R. & Wymenga, E. (1995) De vege-
tatie in de relatienotagebieden Mars- en Westerstroom en
Zuidwolde in de periode 1988–94. LBL Publicatie No. 83.
Altenburg & Wymenga, Veenwouden/Dienst Landinricht-
ing en Beheer Landbouwgronden, Utrecht.
Terlouw, R.J.S. (1992) Weidevogelonderzoek voor de evaluatie
van de beheersplannen Bethunepolder en Polder Mijnden
1991. Publicatie No. 50. Bureau Te r louw, Gouderak/Direc-
tie Beheer Landbouwgronden, Utrecht.
Tilman, D., Fargione, J., Wolff, B., D’Antonio, C., Dobson, A.,
Howarth, R., Schindler, D., Schlesinger, W.H., Simberloff, D.
& Swackhamer, D. (2001) Forecasting agriculturally driven
global environmental change. Science, 292, 281–284.
Uilhoorn, H.M.G. (1996) Weidevogelinventarisatie in de Ter-
schellingerpolder in 1995. LBL Publikatie No. 92. Dienst
Landinrichting en Beheer Landbouwgronden, Utrecht.
Van Buel, H. (1996) Weidevogels binnen en buiten relatieno-
tagebieden in Zeeland in 1995. LBL Publicatie No. 90. De
Horst, Gilze/Dienst Landinrichting en Beheer Landbouw-
gronden, Utrecht.
Van Buel, H. & Vergeer, J.W. (1995) Weidevogels van de rela-
tienotagebieden waterland en Zeevang in 1993. LBL Publicatie
No. 78. Bureau van Buel, Wouwse Plantage/Dienst Land-
inrichting en Beheer Landbouwgronden, Utrecht.
Van den Brink, H.J. & Fijn, R. (1992) Weidevogels en vegetatie
in relatienotagebieden in het Zuidelijk Westerkwartier en
Sauwerd (Groningen). Eindrapport van het evaluatieonder-
zoek 1986–1991. DBL Publicatie No. 52. Consulentschap
Natuur, Bos, Landschap en Fauna Groningen/Dienst
Beheer Landbouwgronden, Utrecht.
Van der Ploeg, R.R., Ehlers, W. & Sieker, F. (1999) Floods
and other possible adverse effects of meadowland area
decline in the former West Germany. Naturwissenschaften,
86, 313–319.
Wakeham-Dawson, A. & Aebischer, N.J. (1998) Factors
affecting winter densities of birds on Environmentally
Sensitive Area arable reversion grassland in southern
England with special reference to skylarks (Alauda arvensis).
Agriculture, Ecosystems and Environment, 70, 189–201.
Wakeham-Dawson, A., Szoszkiewicz, K., Stern, K. &
Aebischer, N.J. (1998) Breeding skylarks Alauda arvensis on
Environmentally Sensitive Area reversion grass in southern
England: survey-based and experimental determination of
density. Journal of Applied Ecology, 35, 635–648.
Walot, Th (2002) Évaluation des mesures agri-environnementales
en Wallonie (EVAGRI 1997–99)
−
synthèse générale. Groupe
Interuniversitaire de Recherches en Écologie Appliquée –
GIREA, Louvain/Liège.
Watkinson, A.R., Freckleton, R.P., Robinson, R.A. &
Sutherland, W.J. (2000) Predictions of biodiversity response
to genetically modified herbicide-tolerant crops. Science,
289, 1554–1557.
Weibel, U. (1998) Habitat use by foraging skylarks (Alauda
arvensis L.) in an arable landscape with wild flower strips.
Bulletin of the Geobotanical Institute ETH, 64, 37–45.
Weibull, A C., Bengtsson, J. & Nohlgren, E. (2000) Diversity
of butterflies in the agricultural landscape: the role of farming
system and landscape heterogeneity. Ecography, 23, 743–750.
Weis, J. (2001) Naturschutzfachliche Erfolgskontrolle des
Ve rtragsnaturschutzes am Beispiel der Nördlichen Eifel. PhD
thesis, University Bonn. Shaker Verlag, Aachen, Germany.
Weiss, J., Michels, C., Jöbges, M. & Kettrup, M. (1999) Zum
Erfolg im Feuchtwiesenschutzprogramm NRW – das
Beispiel Wiesenvögel. LÖBF-Mitteilungen, 3, 14–26.
White, P.C.L. & Hassall, M. (1994) Effects of management on
spider communities of headlands in cereal fields. Pedobio-
logia, 38, 169–184.
Wolff, A., Paul, J.P., Martin, J.L. & Bretagnolle, V. (2001) The
benefits of extensive agriculture to birds: the case of the
little bustard. Journal of Applied Ecology, 38, 963–975.
Wooton, S.R., Landston, R.H.W., Gibbons, D.W. & Pierce, A.J.
(2000) The status of the cirl bunting Emberiza cirlus in the
UK and the Channel Islands in 1998. Bird Study, 47, 139–146.
Wymenga, E., Jalving, R. & Jansen, H. (1994) De Vegetatie
van het Relatienotagebied Reestdal in de Periode 1987–93.
DBL Publicatie No. 72. Altenburg & Wymenga, Veenwouden/
Directie Beheer Landbouwgronden, Utrecht.
Wymenga, E., Jalving, R. & Ter Stege, E. (1996) Vegetatie en
Weidevogels in Relatienotagebieden in Nederland: een Tus-
sentijdse Analyse van de Natuurwetenschappelijke Resultaten
van Beheersovereenkomsten in Nederlandse Relatienotage-
bieden. LBL Publicatie No. 89. Altenburg & Wymenga,
Veenwouden/Dienst Landinrichting en Beheer Landbouw-
gronden, Utrecht.
Yu, D.W., Sutherland, W.J. & Clark, C. (2002) Trade versus
environment. Trends in Ecology and Evolution, 17, 341–344.
Zechmeister, H.G., Schmitzberger, I., Steuerer, B., Peterseil, J.
& Wrbka, T. (2003) The influence of land-use practices and
economics on plant species richness in meadows. Biological
Conservation, 114, 165–177.
Received 24 February 2003; final copy received 23 September
2003