Chemistry and the Environment potx
Bạn đang xem bản rút gọn của tài liệu. Xem và tải ngay bản đầy đủ của tài liệu tại đây (365.38 KB, 58 trang )
Published and distributed by the Royal Society of Chemistry
Chemistry and the Environment
Curriculum materials on
environmental chemistry
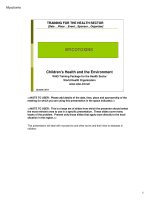
Radon-222 (gas)
α
Polonium-218
Lead-214
Bismuth-214
Polonium-214
Lead-210
α
β
β
α
β
RADON IN HOMES
Increased interest in the environment has highlighted the practical importance
of chemistry. This book contains 26 activities aimed at students who have
studied science up to the age of 16. The activities are grouped into three
themes that emphasize the value of chemical knowledge and techniques to
society:
• air quality • water quality • radon
The book includes information on experiments, data interpretation exercises
and stimulus material that can support both field and laboratory work. The
activities are designed to be used together, but can also work as free standing
tasks. However they are used, the activities provide extra material for teachers
on topics of fundamental importance to environmental issues.
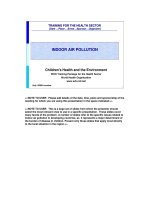
Metabolic
disturbance
occurs above
0.2 ppm
0.36 ppm
(children)
0.5 ppm
0.8 ppm
Proposed toxic threshold
3.1%
14.1%
43.4%
34.0%
5.6%
0.1 0.2 0.3 0.4 0.5 0.6 0.7 0.8 0.9
LEAD IN BLOOD
Percentage of Philadelphia residents with
the specified levels of lead in their blooo
City
Suburbs
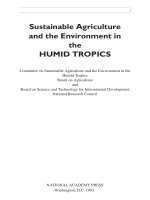
1600
1200
800
400
0
2 4 6 8 10 12
pH
Aluminium solubility
Chemistry and the Environment
Compiled by Justin Dillon, Rod Watson and Canan Tosunoglu
Centre for Educational Studies, King’s College, London
Chemistry and the Environment
Compiled by Justin Dillon, Rod Watson and Canan Tosunoglu,
Centre for Educational Studies, King’s College, London
Edited by John Johnston, Neville Reed, and Ben Faust
Designed by Imogen Bertin
Published by the Education Division, The Royal Society of Chemistry
Copyright The Royal Society of Chemistry 1993
The material in this book may be reproduced without infringing copyright providing
reproduction is for use in the purchasing institution only. The permission of the
publisher must be obtained before reproducing the material for any other purpose.
For further information on other educational activities undertaken by
the Royal Society of Chemistry write to:
The Education Department
The Royal Society of Chemistry
Burlington House
Piccadilly
London W1V 0BN
British Library Cataloguing in Publication Data
Dillon, J
Chemistry and the Environment
I. Title II Faust, C.B.
ISBN 1–870343–24–7
THE ROYAL
SOCIETY OF
CHEMISTRY
ii Chemistry and the Environment
Contents
Introduction iii
The activities iv
Acknowledgements vi
References vii
Addresses of organisations mentioned in the text ix
1 Air quality
1
1.1 Acid rain: the background 1
1.2 Sulphur(IV) oxide, SO
2
3
1.3 Acid rain and tree damage 5
1.4 Investigating rain 6
(a) Monitoring acid rain 6
(b) pH determination 8
(c) Nitrate(V) determination 8
(d) Sulphate(VI) determination 9
1.5 From Siberia to suburbia 11
1.6 Lead 15
(a) Sources of lead pollution 15
(b) Lead in the blood 16
(c) Lead determination 17
2 Water quality 18
2.1 The response of water to carbon dioxide 18
2.2 Aluminium in the water supply 19
2.3 Oxygen in water 20
2.4 Aluminium and Alzheimer’s disease 22
2.5 Aluminium determination 23
3 Radon 24
3.1 Radon and leukaemia 24
3.2 What is radon? 25
3.3 Why is radon dangerous? 26
3.4 Radon in the UK 27
(a) Radon, health and homes 27
(b) Where in the country is radon found? 27
3.5 Geochemistry 29
3.6 Factors affecting the emission of radon 30
3.7 Where in the home is radon found? 31
3.8 How much radon is there? 32
(a) Detecting radon 32
(b) Interpreting the results 34
Teachers’ guide to the activities 35
THE ROYAL
SOCIETY OF
CHEMISTRY
iii
Introduction
The increased concern for, and interest in, the environment has highlighted the role
of chemists and the value of chemical knowledge and techniques to society. This
pack is aimed at developing knowledge and techniques in students who have studied
science up to the age of 16. The activities will support work outside the laboratory
either in the immediate environment or further afield. Some of the material goes
beyond the bounds of some post-16 syllabuses: we make no apology for this. We
believe that the topics looked at here are fundamentally important to citizens of the
present and the future.
The pack contains 26 activities: experiments, data interpretation exercises and
stimulus material that is relevant to chemistry and the environment. The activities are
grouped into three themes: air quality; water quality; and radon.
The activities are designed to be used together and as free standing tasks to
supplement existing resources.
THE ROYAL
SOCIETY OF
CHEMISTRY
iv Chemistry and the Environment
The activities
RISK ASSESSMENT
IT IS VITAL THAT A RISK ASSESSMENT IS COMPLETED FOR ANY PRACTICAL
EXERCISE DESCRIBED HERE THAT IS TO BE ATTEMPTED.
The following is a list of the activities included in this pack. They include data
analysis, comprehension exercises, and practical activities. Students should realise
that in some cases they will have to use other sources of reference to find the answers
to the problems raised –
eg
a data book.
1. Air quality
This group of activities enables students to develop an understanding of the chemistry
of acid rain. Students can collect and analyse a sample of rain water for nitrate(V),
sulphate(VI) and pH. They can work out the approximate proportion of the acidity
due to SO
2
and NO
x
pollution. Some of the analytical methods can also be used to
test for water quality.
1.1 Acid rain: the background
1.2 Sulphur(IV) oxide, SO
2
1.3 Acid rain and tree damage
1.4 Investigating rain
(a) Monitoring acid rain
(b) pH determination
(c) Nitrate(V) determination
(d) Sulphate(VI) determination
1.5 From Siberia to suburbia
1.6 Lead
(a) Sources of lead pollution
(b) Lead in the blood
(c) Lead determination
2. Water quality
Water quality has become an area of intense interest in the past few years. By using
this group of activities, students can analyse water samples for lead, aluminium, and
oxygen; and these activities can be supplemented by using the nitrate(V),
sulphate(VI), and pH activities from the air quality theme.
2.1 The response of water to carbon dioxide
2.2 Aluminium in the water supply
2.3 Oxygen in water
2.4 Aluminium and Alzheimer’s disease
2.5 Aluminium determination
3. Radon
This group of activities focuses on the indoor radon problem. The element radon, a
noble gas, accounts for the death of thousands of people in the world each year.
Interest in the problems posed by radon in the environment is relatively recent and is
still growing. An understanding of the problems requires knowledge from chemistry,
physics, biology, geology and geochemistry.
Factors affecting the distribution of radon such as the distribution of minerals in
the UK, house construction and climatic influences, are considered. Students detect
THE ROYAL
SOCIETY OF
CHEMISTRY
v
radon in the home using a solid state detector and approximate concentrations of the
gas are calculated.
Note that ideally, activities 3.4b and 3.5 should be done before activity 3.6.
3.1 Radon and leukaemia
3.2 What is radon?
3.3 Why is radon dangerous?
3.4 Radon in the UK
(a) Radon, health and homes
(b) Where in the country is radon found?
3.5 Geochemistry
3.6 Factors affecting the emission of radon
3.7 Where in the home is radon found?
3.8 How much radon is there?
(a) Detecting radon
(b) Interpreting the results
THE ROYAL
SOCIETY OF
CHEMISTRY
vi Chemistry and the Environment
Acknowledgements
The development of this pack involved chemistry teachers, PGCE students, and
school students. It was coordinated by Justin Dillon, Rod Watson and Canan
Tosunoglu at the Centre for Educational Studies, King’s College, London.
The compilers of the book thank the following people for their help:
PGCE Students: Paul Buxton, Indira Ghatak, Ross Gillett, Eric Hill, Andrew Howard,
Gul Jockoo, Paula Kennedy, Ann Lavery, Kelvin O’Malley, Robert Pascoe, Eileen
Perrin, Clare Powles, Veveika Sampat, Chris Shaw, John Skinner, Stephen Taylor.
Lynn Jarvis for providing the technical assistance.
Professor Martin Hughes, department of chemistry, King’s College, London; Dr Keith
Ball and Dr Ian Basham, the British Geological Survey; Matthew Gaines, Liz Francis,
Jon Miles and Anita Sharma of the National Radiological Protection Board; Nature
Conservancy Council Data Support for Education Service (Simon Albrecht); Pershore
Mouldings, Worcestershire; Rod Mather of AKZO Chemicals, Walton-on-Thames;
Sue Bouchier and pupils at Notre Dame School, London, SE1; Dr Ian Poots and his
students at St Paul’s School, London, SW15; Dr Barbara Wilson and Terry Armstrong
of Selhurst Tertiary Centre, Croydon College; Ann Willcocks, GEMS Monitoring and
Assessment Research Centre, King’s College, London
THE ROYAL
SOCIETY OF
CHEMISTRY
vii
References
Ball T K, 1988,
The Geological Contribution to the Total Radioactive Dose
,
Proceedings of the Third National Conference on the Health Risks of Low-level
Radiation, Grantham, Lincolnshire, pp 11-19
Ball T K, Cameron D G, Colman T B, and Roberts P D, 1991,
Behaviour of Radon in
the Geological Environment: a Review
, Quarterly Journal of Engineering Geology,
24, pp 169-82
Bateman D, Dillon J S, Figg M, Hill A, Payne G, Smith C, Watson J R, 1990,
National
Environmental Database Project
, King’s College, London
Bockris J O’M (ed), 1978,
Environmental Chemistry
, Plenum Press, New York
Brookins D G, 1990,
The Indoor Radon problem
, Columbia University Press, Oxford
Camplin G C, Henshaw D L, Lock S, and Simmons Z, 1988,
A National Survey of
Background Alpha-Particle Radioactivity
, Physics Education, 23, pp 212-217
Cole H A, 1988,
Understanding Nuclear Power
, Gower Technical Press, pp 75
Cowburn J D, Farrar G, and Blair A, 1990,
Alzheimer’s Disease – Some Biochemical
Clues
, Chemistry in Britain, December, pp 1169-1173
Dee Snell F, Encyclopedia of Industrial Chemical Analysis, volume 16, 1972, Wiley
Interscience, London
Department of the Environment/Welsh Office, 1987,
River Quality in England and
Wales,1985
, HMSO, London
Elsom D, 1987,
Atmospheric Pollution
, Basil Blackwell, Oxford
Fleischer R L, Mogro-Campero A, and Turner L G, 1981,
Radon Levels in Homes in
the North-eastern United States: Energy-Efficient Homes
, Vohra K G, Pillai K C,
Mishra U C, and Sadasivan S, (eds), 1981, pp 497-502
Fleischer R L, Price P B, and Walker R M, 1975,
Nuclear Tracks in Solids
, Berkeley,
University of California Press
Forestry Commission, 1987,
Air Pollution and Forestry
, Forestry Commission Report
No 70, HMSO
Gerusky T M, 1987,
Protecting the Homefront
, Environment, 29, 1, pp 12-39,
Washington DC
Gill J, and Gill E, 1989,
Acid Rain in the Laboratory
, School Science Review, 70,
254, pp 71-72
Hammil J, 1980,
Water, Chemistry and Ecology
, John Murray (Publishers) Ltd,
London
HMSO, 1990,
This Common Inheritance
, pp 157-158
Innes J L, and Boswell R C, 1987,
Forest Health Surveys 1987 part 1: Results
, Bulletin
74, Forestry Commission
Institution of Environmental Health Officers, 1988,
Radon: Report of the I.E.H.O.
Survey on Radon in Homes, 1987
, I.E.H.O.
IOP, 1988,
TASTRAK – A New Plastic Detector for Teaching Radioactivity
, Institute
of Physics, London
Longhurst J S, Lee D S and Green S E, 1987,
Acid Deposition in the Northern
Hemisphere
, Acid Rain Information Centre, Manchester
Mackereth F J H, Heron J, and Talling J F, 1978,
Water Analysis
, Fresh Water
Biological Association, Scientific Publication No. 36
Marr I L, and Cresser M S, 1983,
Environmental Chemical Analysis
, Blackie and Son,
London
Martyn C N, 1989,
Alzheimer’s Disease and Aluminium in Drinking Water
, Medical
Research Council News, 43, 29
Monitoring and Assessment Research Centre, 1987,
United Nations Environment
Programme Environmental Data Report
, United Nations Environment Programme,
Basil Blackwell
THE ROYAL
SOCIETY OF
CHEMISTRY
viii Chemistry and the Environment
Murozumi M, Chow T J and Patterson C C, 1969, Geochim. Cosmachim Acta, 33,
p 1247, Bockris, J O’M (ed), 1978
NRPB, 1989a,
Living with Radiation
, National Radiological Protection Board
NRPB, 1989b,
Radiation Protection
, National Radiological Protection Board
NRPB, 1990a,
Documents of the NRPB
, National Radiological Protection Board, 1, 1,
p 22
NRPB, 1990b,
Radon
, National Radiological Protection Board
Openshaw P, 1987,
Acid Rain
, School Science Review, 68, 245, pp 654-666
Phillips P S, and Simpson K, 1990,
Radon
, School Science Review, 72, 258, pp 77-80
Price B, 1983,
Friends of the Earth Guide to Pollution
, Maurice Temple Smith Ltd,
Middlesex
Raiswell R W, Brimblecombe P, Dent D L, and Liss P S, 1980,
Environmental
Chemistry
, Edward Arnold, London
Read C, 1990, New Scientist, 5th May, p 32
Review group on acid rain, 1987,
Acid Deposition in the United Kingdom 1981-
1985 a second report of the United Kingdom
, Warren Springs Laboratory
Sanderson P L and Newton G, 1986,
The Pollution Detectives
, School Science
Review, 68, 243, pp 224-235
Sanderson P L, 1988,
The Pollution Detectives: Part II. Lead and Zinc Mining
, School
Science Review, 69, 249, pp 721-728
Sanderson P L, 1989,
The Pollution Detectives: Part III. Roadside Lead Pollution
,
School Science Review, 71, 255, pp 59-64
Scottish Schools Science Equipment Centre, 1988,
Radon in Buildings – a Simple
Detection Method
, Bulletin 161, October, pp 9-12
Sutton C, 1988,
Inside Science: Radioactivity
, New Scientist, 11th February, pp 1-4
Vohra K G, Pillai K C, Mishra U C, and Sadasivan S, (eds), 1981,
Natural Radiation
Environment
, Proceedings of the Second Special Symposium on Natural Radiation
Environment, Bombay, India 1981, Wiley Eastern Limited, New Delhi
Wellburn A, 1988,
Air Pollution and Acid Rain: The Biological Impact
, Longman
THE ROYAL
SOCIETY OF
CHEMISTRY
ix
Addresses of organisations mentioned in
the text
Acid Rain Information Centre, Department of Environmental and Geographical
Studies, Manchester Metropolitan University, Chester Street, Manchester M1 5GD;
Institution of Environmental Health Officers, Chadwick House, 48 Rushworth Street,
London SE1 0QT;
National Radiological Protection Board, Chilton, Didcot, Oxon OX11 0RQ;
Pershore Mouldings, Trading Estate, Pershore, Worcestershire WR10 2DH;
United Kingdom Atomic Energy Authority Education Service, Room 9a, Building
354W, Harwell Laboratory, Oxfordshire OX11 0RA.
1. Food
1
THE ROYAL
SOCIETY OF
CHEMISTRY
1
1. Air quality
Activity 1.1 Acid rain: the background
Acid rain is used loosely to describe both acidic gases in the atmosphere and, more
precisely, rain, mist or snow containing acid compounds of sulphur and nitrogen.
Two main gases contribute to the formation of acid rain: sulphur(IV) oxide (SO
2
),
produced by burning fossil fuels which contain sulphur, such as coal and oil; and
oxides of nitrogen (NO
x
), which are formed when anything is burnt. The formation of
acids from these gases and the way in which they move through the atmosphere are
also affected by other pollutants, including ozone. The main sources of sulphur
dioxide and oxides of nitrogen are power stations which burn fossil fuels, other large
industrial combustion plants and motor vehicles.
This Common Inheritance, Britain’s Environmental Strategy
The extract comes from the government’s white paper on the environment. The
Earth’s atmosphere contains about 0.03 per cent of carbon dioxide, some of which
dissolves in water to form an acidic solution of pH 5.6.
H
2
O (l) + CO
2
(g) → H
+
(aq) + HCO
3
–
(aq)
However, rain water with a pH around 3 is not uncommon. More typical data is
shown in table 1, which compares rain water compositions from similar sites in
inland Scandinavia during the 1950s and 1970s. Data from a similar site in the US is
also included.
Site pH H
+
SO
4
2–
NO
3
–
HCO
3
–
Scandinavia (1956) 5.4 4 15 0 6
Scandinavia (1974) 4.3 50 26 26 0
North-eastern US (1974) 3.9 126 55 50 0
Table 1 Comparison of rain water composition for three sites in mmol dm
-3
ie 10
-6
mol dm
-3
Questions
(i) Why has the acidity of Scandinavian rain water increased so significantly in
the period 1956-74?
(ii) What have been the greatest effects of the increased acidity of rain water in
Scandinavia?
(iii) Use the data given below to explain why the HCO
3
–
concentration in
Scandinavia (1974) and north-eastern US (1974) was zero:
THE ROYAL
SOCIETY OF
CHEMISTRY
2 Chemistry and the Environment
Acid or ion Equilibrium K
a
/mol dm
-3
Sulphuric(VI) acid H
2
SO
4
H
+
+ HSO
4
–
very large
Nitric(V) acid HNO
3
H
+
+ NO
3
–
40
Hydrogensulphate(VI) ion HSO
4
–
H
+
+ SO
4
2–
1.0 x 10
-2
Carbonic acid H
2
CO
3
H
+
+ HCO
3
–
2.0 x 10
-4
Carbon dioxide/water H
2
O + CO
2
H
+
+ HCO
3
–
4.5 x 10
-7
Hydrogencarbonate ion HCO
3
–
H
+
+ CO
3
2–
4.8 x 10
-11
1. Food
3
THE ROYAL
SOCIETY OF
CHEMISTRY
3
Activity 1.2Sulphur(IV) oxide, SO
2
Sulphur(IV) oxide, SO
2
, is formed by the combustion of sulphur compounds in coal
and oil. Sulphur(IV) oxide reacts with water to form a weak acid, sulphuric(IV) acid
(pKa = 1.8):
H
2
O(l) + SO
2
(g) 2H
+
(aq) + SO
3
2-
(aq)
Sulphur compounds can react with other atmospheric gases to form compounds with
higher oxidation states, whose solutions are more acidic. Sulphuric(IV) acid can be
oxidised in the atmosphere to sulphuric(VI) acid, H
2
SO
4
, a strong acid:
4H
+
(aq) + 2SO
3
2-
(aq) + O
2
(g) 4H
+
(aq) + 2SO
4
2-
(aq)
On a global basis, the amount of sulphur(IV) oxide released by human activity has
increased rapidly over the past 100 years. In 1985 the total release of sulphur (as SO
2
)
from human activity was 90 million tonnes as compared with an estimated natural
global release of 70 million tonnes of sulphur per year. In some countries, emissions
from power stations are being reduced by flue-gas desulphurisation systems. The
results of this have yet to be seen in the global figures for sulphur(IV) oxide emissions,
as
Fig. 1
illustrates.
90
80
70
60
50
40
30
20
10
1860m 1880m 1900m 1920m 1940m 1965m 1985
1975
1950
1930
1910
1890
1870
Year
Emissions (10
6
tonnes sulphur)
Other
Copper production
Lignite
Oil
Coal
Figure 1 Global sulphur dioxide emissions (excluding natural sources)
THE ROYAL
SOCIETY OF
CHEMISTRY
4 Chemistry and the Environment
In the decade 1974 to 1984 emissions of sulphur(IV) oxide fell by about 30 per
cent in the UK, and this is shown by the decrease in concentrations of sulphur(IV)
oxide in the air in London. Concentrations also fell in most major European cities
over a similar period.
Figure 2
shows the concentration of sulphur(IV) oxide in some
major European cities in recent years.
Concentration (µg m
-3
)
200
180
160
140
120
100
80
60
40
20
1973 1975 1977 1979 1981
Milan
Paris
Madrid
London
Zagreb
Stockholm
Amsterdam
Year
Figure 2 Concentration of SO
2
in some major European cities
The guide-line range suggested by the World Health Organisation, to limit human
health effects of SO
2
in urban areas, is 40–60 g m
-3
.
Question
(i) Are there any parts of Europe where pollution from sulphur(IV) oxide is
significantly lower or higher than other parts of Europe? If so, can you suggest
any reasons why these differences might exist?
1. Food
5
THE ROYAL
SOCIETY OF
CHEMISTRY
5
Activity 1.3 Acid rain and tree damage
In recent years there have been reports from all over Europe of widespread damage to
trees. The damage is not confined to other countries.
Figure 1
summarises the
damage to a range of tree species surveyed in Britain in 1987.
100
80
60
40
20
Trees (per cent)
Species
Class 3 and 4
61–100 per cent
Class 2
26–60 per cent
Class 1
11–25 per cent
Class 1
0–10 per cent
Sitke spruce Norway spruce Scots pine Oak Beech
<50 >50 <50 >50 <50 >50
<50 = less than 50 years old >50 = more than 50 years old
Figure 1 Distribution of crown thinning for five tree species surveyed in Britain in
1987 by the Forestry Commission (Class 4 is the most damaged)
There is general agreement that the damage is widespread but there is much
discussion about the causes. One possible factor is that acid rain leaches aluminium
out of the soil and that this change in the soil chemistry damages the trees. Harmless
substances in the soil such as aluminium silicate dissolve in the acidic solution. This
can disturb the soil chemistry and impair root growth.
Investigating the effect of pH on the amount of aluminium ions
leached from the soil
Design an experiment to investigate the effectiveness of acid rain in leaching
aluminium ions out of soil. You could investigate:
▼ the effect of different acids (acid rain contains sulphuric(VI) and nitric(V)
acids);
▼ the effect of different concentrations of the acids; and
▼ the effect on different types of soil.
You can assume that strips are available to test for aluminium ions.
THE ROYAL
SOCIETY OF
CHEMISTRY
6 Chemistry and the Environment
Activity 1.4 Investigating rain
Activity 1.4a Monitoring acid rain
It is possible to detect the extent of acidification of the rain water and to find out
something about the nature of the acidification. To do this, a relatively simple
analysis of rain water is made and weather data recorded. Three chemical analyses:
measuring of pH, sulphate(VI) ion concentration and nitrate(V) ion concentration
enable you to learn more about the nature of the pollution.
Aims
It is important at the beginning of the experiment to decide the questions that you
would like to try to answer. Formulating your questions at the beginning will help
you to decide what data you need to collect and where from. Some
possible
questions are:
▼ What is the origin of any pollution detected?
▼ What weather conditions are associated with high levels of pollution?
▼ What types of rainfall are associated with high levels of acidity?
Setting up the experiment
Select a suitable collection vessel and measure the surface area open to the rain (you
will need this to calculate the total amount of acid deposited each day). To avoid
contamination by splashing, fix your container to a post, about 1.5 m from the
ground, well away from buildings and trees.
At the same time every day, the collection vessel should be lined with a clean
plastic bag and any rain
etc
measured and analysed. Avoid handling the inside of the
bag when putting it in your collection vessel by wearing a second plastic bag over
your hand as a glove. The bag should be changed each day, even if it does not rain,
as dry deposition can deposit acids in the bag too. You should also note down any
contaminants that you find in the bag –
eg
bird droppings!
Collecting data
A recording table is provided. You may, however, wish to devise your own if you
wish to answer different questions. For example, atmospheric pressure, which is
related to cyclonic and anticyclonic weather is not included on the form. As well as
collecting local weather data, it is useful to contact the meteorological office to
obtain a better picture of where the air masses affecting the rain originated.
1. Food
7
THE ROYAL
SOCIETY OF
CHEMISTRY
7
Key
Wind direction: N North; S South; E East; W West; NE North east; SE South east; SW South west; NW North west
Wind strength: A None; B Light; C High
Weather data: A Showers; B Intermittent rain; C Continuous rain; D Night rain; E Clear sky; F Overcast; G Bright spells
Rain type: A Heavy; B Light; C Hail; D Snow; E Mist; F Thunder
Contaminant: A None; B Insect; C Dust; D Plant material; E Droppings
Date Wind Wind Weather Rain Contam- Daily pH Daily vol
Year Month Day direction strength data type inant (to 1 dp) (cm
3
)
DATA COLLECTION SHEET
THE ROYAL
SOCIETY OF
CHEMISTRY
8 Chemistry and the Environment
Activity 1.4b pH determination
To measure the pH of the rain water you can use short range indicator paper with
increments of 0.3 pH units between pH 2.0 and pH 7.0. This paper is accurate to
within about 0.3 pH units. Theoretically, pH meters are more accurate but the
electrodes can deteriorate with use. Each time you measure the pH of the rain water
you need to:
1 convert your pH reading into the hydrogen ion concentration;
2 estimate the error in your pH readings. Your teacher may provide you with
buffer solutions of a pH unknown to you, for you to test; and
3 work out the error in your hydrogen ion concentrations from the error in the
pH readings.
Recently, in a rainstorm at Pitlochry in Scotland, a pH of 2.4 was recorded. This
was claimed to be more acidic than vinegar.
Question
(i) Is rain water with a pH of 2.4, really as acidic as vinegar? Remember, pH is
calculated from the hydrogen ion concentration of a solution. This is not
necessarily the same as the concentration of acid present. In a weak acid only
a small proportion of the acid will be ionised to form H
+
. The equation
showing the dissociation of ethanoic acid is:
CH
3
COOH (aq) CH
3
COO
–
(aq) + H
+
(aq) K
a
= 1.7 x 10
-5
mol dm
-3
(a) Calculate the hydrogen ion concentration of a solution of vinegar which
has a pH of 2.4.
(b) Calculate the concentration of a solution of ethanoic acid that would
have a pH of 2.4.
(c) What volume of 0.1 mol dm
-3
NaOH(aq) would be required to
neutralise 100 cm
3
of the vinegar?
(d) Assuming that the acid rain consists entirely of a mixture of strong acids
such as nitric(V) acid or sulphuric(VI) acid, what volume of 0.1 mol dm
-3
NaOH(aq) would be required to neutralise 100 cm
3
of the acid rain?
(e) Comment on the statement ‘rain water with a pH of 2.4, is as acidic as
vinegar’.
Activity 1.4c Nitrate(V) determination
The spark temperatures in car engines can exceed 2000 °C, and at these
temperatures, some atmospheric nitrogen can combine with oxygen to form
nitrogen(II) oxide, NO:
N
2
(g) + O
2
(g) 2NO(g)
Up to 0.4 per cent of the exhaust gases from an accelerating motor car can consist
of nitrogen(II) oxide. Industrial processes involving the combustion of fossil fuels are
also sources of nitrogen oxides.
Nitrogen oxides can react with other atmospheric gases to form compounds with
higher oxidation states, whose solutions contribute to acid rain. There are a number
1. Food
9
THE ROYAL
SOCIETY OF
CHEMISTRY
9
of steps involved, and other chemicals such as ozone and certain peroxides are
produced and consumed. However, the net results are relatively easy to describe.
Nitrogen(II) oxide can be converted into nitric(V) acid, HNO
3
, a strong acid:
4NO(g) + 3O
2
(g) + 2H
2
O(l) 4H
+
(aq) + 4NO
3
–
(aq)
About 30 per cent of the acidity in acid rain consists of nitric(V) acid. The figure
varies from place to place depending on the source of the acid rain, but as a general
trend the proportion of nitric(V) acid in acid rain is increasing. It is estimated that
non-natural emissions now account for about half the global total. In industrialised
countries, vehicle emissions constitute the greatest individual source, other sources
are nitrogenous fertilisers and industrial processes.
Nitrate(V) ion concentrations can be measured using a Merckoquant nitrate test
strip. Concentrations as low as 10 mg dm
-3
can be detected. First the strip reduces
nitrate(V) ions to nitrate(III) (nitrite) ions. In the presence of an acid buffer the
nitrate(III) is converted to nitric(III) acid which diazotizes an aromatic amine in the
strip. This couples with N-(1-naphthyl) ethylenediamine to form a red-violet azo dye.
Questions
(i) What is the concentration of 10 mg dm
-3
of nitrate(V) ions in mol dm
-3
?
(ii) Work out the nitrate(V) ion concentration of your sample in mol dm
-3
.
(iii) If you have done activity 1.4d what proportion of the acidity of the rain is due
to nitric(V) acid? Comment on your answer in the light of the introduction.
Activity 1.4d Sulphate(VI) determination
This technique compares the cloudiness of a mixture of rain water and barium
chloride solution with mixtures of solutions containing known concentrations of
sulphate(VI) ions.
1 Immediately before you do your test on the rain water, place 2 cm
3
of 1 mol
dm
–3
barium chloride solution in each of five clean test-tubes. Make up five
comparator tubes by adding equal volumes of 0.01, 0.005, 0.001, 0.0005, and
0.0001 mol dm
-3
solutions of sodium sulphate(VI) to the different tubes. Shake
each tube.
2 Add equal volumes of the barium chloride and the rain water together. If no
precipitate appears immediately, stopper the tube and wait a few minutes
before making the comparison.
3 Match your rain water tube with a comparator tube. If you are unsure whether
there is a precipitate, compare the tube with one containing water. Estimate
the sulphate(VI) ion concentration.
This test enables you to detect the presence of the sulphate(VI) ion and to estimate
its concentration. The solubility product of barium sulphate is 1.0 x 10
-10
mol
2
dm
-6
and so at equilibrium there will be a precipitate down to concentrations of about 10
-8
mol dm
-3
sulphate(VI). Equilibrium is not reached immediately. During trials of this
activity, the following observations were made:
THE ROYAL
SOCIETY OF
CHEMISTRY
10 Chemistry and the Environment
Concentration Immediate observations Observations after 5 minutes
10
-2
mol dm
-3
cloudy/milky milky ppt beginning to settle
10
-3
mol dm
-3
cloudy cloudy
10
-4
mol dm
-3
no effect very faint cloudiness
Table 1
Questions
(i) What concentration of hydrogen ions would have to be present with the
sulphate(VI) to make sulphuric(VI) acid?
(ii) If you have done activities 1.4b and 1.4c on this sample, how does your
answer to question (i) compare with the answers for hydrogen ion
concentration in activity 1.4b and nitrate ion concentration in activity 1.4c?
1. Food
11
THE ROYAL
SOCIETY OF
CHEMISTRY
11
Activity 1.5 From Siberia to suburbia
The data shown on the record sheet, headed ‘Camberley data 1991’, were collected
in January and February of 1991. Use the information given below, together with the
record sheet, to answer the questions.
Camberley is a town in Surrey situated about 55 kilometres west-south-west of
London. The data collection period started with about two weeks during which there
was an anticyclone over the British Isles with almost stationary air sitting over the
country. This air mass was slowly replaced by very cold air from Siberia, which
started arriving over south east England on 5th February. This cold air brought snow
and slowly pushed back weather fronts which had been starting to come into the
west of the British Isles. The winds from 7th February until 11th February were very
light and somewhat variable giving rise to an almost stationary air mass over south
east England again. On 12th February slightly less cold air from the north west
arrived carrying first snow and later rain. Warmer air arrived with a weather front
from the south west on 20th February, and it rained heavily during the next two days.
The wind direction stayed south westerly for about two weeks to be replaced by a
strong wind from the south on 5th March. This wind betrayed its Saharan origins by
the brown dust that was deposited with the rain.
THE ROYAL
SOCIETY OF
CHEMISTRY
12 Chemistry and the Environment
Key
Wind direction: N North; S South; E East; W West; NE North east; SE South east; SW South west; NW North west
Wind strength: A None; B Light; C High
Weather data: A Showers; B Intermittent rain; C Continuous rain; D Night rain; E Clear sky; F Overcast; G Bright spells
Rain type: A Heavy; B Light; C Hail; D Snow; E Mist; F Thunder
Contaminant: A None; B Insect; C Dust; D Plant material; E Droppings
Date Wind Wind Weather Rain Contam- Daily pH Daily vol
Year Month Day direction strength data type inant (to 1 dp) (cm
3
)
CAMBERLEY DATA 1991
1991 1 22 NE B F – – – –
123– A F – – – –
124– A F – – – –
125– A F – – – –
1 26 NE B BF E – 2.9 1.0
1 27 – A AF E – 3.0 0.3
1 28 – A AF E – 3.6 0.01
1 29 – A AF E – 3.2 0.01
1 30 – A AF B – 3.0 0.1
1 31 NE B ADF BD – 3.0 3.1
2 1 – A AF BD – 3.5 3.4
22NBF–– – –
23–AFG–– – –
24EBFG–– – –
2 5 SE B AFG D – 6.0 0.1
2 6 E B AF D – 5.0 1.9
2 7 NE B CDF D – 3.5 17.7
2 8 NE B AF D – 3.2 6.8
2 9 NE B AF D – 3.2 2.1
2 10 N B AF D – 3.2 0.7
211NWB E – – – –
2 12 NW B AFG AD C 3.8 32.3
2 13 NW B AF D – 4.3 0.5
2 14 W B DE A – 4.3 14.6
2 15 W B AF B – 2.5 0.1
216NWB E – – – –
217NEBEF– – – –
1. Food
13
THE ROYAL
SOCIETY OF
CHEMISTRY
13
Key
Wind direction: N North; S South; E East; W West; NE North east; SE South east; SW South west; NW North west
Wind strength: A None; B Light; C High
Weather data: A Showers; B Intermittent rain; C Continuous rain; D Night rain; E Clear sky; F Overcast; G Bright spells
Rain type: A Heavy; B Light; C Hail; D Snow; E Mist; F Thunder
Contaminant: A None; B Insect; C Dust; D Plant material; E Droppings
CAMBERLEY DATA 1991 continued
Date Wind Wind Weather Rain Contam- Daily pH Daily vol
Year Month Day direction strength data type inant (to 1 dp) (cm
3
)
1991 2 18 – – FG E – 5.5 0.1
219– –EF– – – –
2 20 S B AF B – 3.0 1.5
2 21 S B F B – 4.0 14.6
2 22 SW C CDFG A – 4.3 15.3
223SWCF – – – –
2 24 SW C AF B – 3.7 4.6
225SBEF– – – –
2 26 – A BF A – 3.5 3.5
2 27 SW B CF A B 4.3 32.0
228– A F – – – –
31SWBF–– – –
3 2 SW B BF BD D 3.0 2.7
33WCE–– – –
3 4 SW B AF B – 3.4 3.2
3 5 S C BF A C 5.7 10.2
3 6 S C BF A C 5.7 11.6