PLANET EARTH 2011 – GLOBAL WARMING CHALLENGES AND OPPORTUNITIES FOR POLICY AND PRACTICE_2 potx
Bạn đang xem bản rút gọn của tài liệu. Xem và tải ngay bản đầy đủ của tài liệu tại đây (19.32 MB, 336 trang )
14
The Choice of Biofuels to Mitigate
Greenhouse Gas Emissions
Rogério Cezar de Cerqueira Leite
1
, Manoel Regis Lima Verde Leal
2
and Luís Augusto Barbosa Cortez
3
1
Interdisciplinary Center of Energy Planning / University of Campinas
2
Brazilian Bioethanol Science and Technology Laboratory
3
Faculty of Agricultural Engineering / University of Campinas
Brazil
1. Introduction
The tentatives to use biofuels can be traced back to the years around 1900 when Henry Ford
and Rudolf Diesel used ethanol and vegetable oil in their Otto cycle and Diesel cycle
engines, respectively. With the introduction of oil in the energy scenario as a very cheap
option, the interest in biofuels dwindled down rapidly and the transport sector was fully
dominated by gasoline and diesel. However, the idea did not die and biofuels came and
went a few times; in the mid 1920s ethanol fuel was used in Brazil and in 1931 a Federal Law
mandated the blending of 5% ethanol in all imported gasoline used in the country. Since
then, several biofuels options have been produced and tentatively used in some countries:
ethanol, methanol, higher alcohols, vegetable oils, fat acid methyl/ethyl esters, biogas and
dimethyl ether (DME) just to mention the main ones.
The driving forces behind the use of biofuels are many, but can be separated in four
groups: environmental benefits (local and global), high oil prices, energy security and
support to local agriculture. Different countries in different times were drawn by different
motivations that changed in time in each case. Looking into the main biofuel programs
today it can be seen that USA alcohol program was originally intended to mitigate local
pollution problems due to vehicle tail pipe emissions but today is driven by the support
to local agriculture, energy security and only very recently, with the Energy
Independence and Security Act of 2007 (EISA 2007), it has shown some interest in global
warming mitigation, with the introduction of minimum greenhouse gas (GHG) emission
reduction limits for different alternative of biofuels (Renewable Fuel Standard – RFS2);
ethanol dominates the first generation technologies (1G) with biodiesel playing a minor
but important role. The Brazilian Alcohol Program launched in 1975 was aimed at
reducing the oil imports (due to high oil prices and energy security), but also at
improving the sugarcane industry conditions, badly hit by the low sugar prices and
overproduction; after the decline in oil prices in the mid 1980s the focus became the
reduction of local pollution in the large cities resulting from vehicle tail pipe emissions;
more recently, in 2004,the National Biodiesel Production and Use Program was initiated
in Brazil with a strong focus on social inclusion and support to small producers, but also
Planet Earth 2011 – Global Warming Challenges and Opportunities for Policy and Practice
312
with the justification to eliminate diesel imports. Some countries in the European Union
(EU), notably Germany, introduced biodiesel to support local agriculture with surplus
production problems, however, the Renewable Energy Directive (RED) introduced in
April 2009 and the revision of Fuel Quality Directive (FQD) present some sustainability
requirements, including GHG emission reduction minimum threshold values, tightening
along the time, and fuel quality standards. Since the motivations are many and variable in
time, with the changes in context both in local and global scale, it is critically important
that a biofuels program, to be launched by any country, should have very clear objectives
and a long term view to reduce the risk of supporting inadequate alternatives that will
prove unsustainable, or at least inefficient, in the future.
Besides meeting the objectives of the main driving forces, the biofuel alternative to be
sustainable and come to represent a meaningful positive impact on the performance of the
transport sector it must have some characteristics such as environmental benefits (both local
and global), be able to be produced in large quantities without negatively impacting food
and feed production, have a good positive energy balance and, last but not least, be
competitive in the long run with fossil fuels and other renewable energy alternatives.
Although there were many alternatives studied and developed in the past decades, today
ethanol and biodiesel from first generation technologies (1G) dominate the biofuels scene
and the escalating oil prices have demonstrated to be a very strong driver, as can be seen in
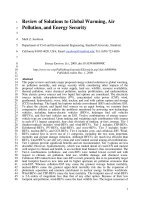
Figure 1 for the case of Brazil. The low oil prices between 1986 and 2001 are responsible for
the stagnation of the ethanol use in Brazil and the escalating oil prices after 2002 (that
peaked above US$ 140/barrel in 2008) can be blamed for the very fast growth in biofuels
production and use in the world seen after 2004, when the global biofuel production
increased from 32 billion liters (30 billion liters of ethanol and 2 billion liters of biodiesel) in
2004 to 93 billion liters (76 billion liters of ethanol and 17 billion liters of biodiesel) in 2009
(REN21, 2010); fortunately the major players have noticed the danger of embarking in
wrong options and introduced legislations establishing some requirements to differentiate
the alternatives in terms of feedstocks, local producing conditions, processing paths and,
most importantly, GHG emission reduction potential.
The global energy market is several times larger than the agricultural commodities market
and, therefore, the question is how much the world in general, and each country in
particular, can or should produce before the demand for natural resources for biofuels
becomes a problem. The International Energy Agency (IEA, 2009) forecasts in the Low
Carbon Scenario (Scenario 450, to keep the temperature increase at no more than 2 ºC above
the pre-industrial age values) that biofuels will represent some 11% of world transport fuel
consumption by 2030; this means around 278 Mtoe of biofuels by 2030. Second generation
technologies (2G) will start to be significant around 2020 and will dominate after 2030. IEA
also points out that, although 2G technologies will dominate after 2030, sugarcane ethanol
will be the only 1G biofuel to survive in the long term (IEA, 2008). In comparison the
Reference Scenario estimates the biofuels global production in 2030 as 132 Mtoe
representing 4% of the transport fuel demand. To play an important role in GHG mitigation,
biofuels should come to represent at least 10% in the world transport fuel pool, with 20%
representing a more ambitious, but probably achievable, target for the long term. Setting a
tentative target the question now is if can we do it, in terms of resources availability,
investments required and how much would cost with respect to GHG mitigation effect
(US$/tCO
2
). It is quite clear that the options should be carefully chosen and that only a
handful of countries can play a significant role in this endeavor; this does not rule out the
The Choice of Biofuels to Mitigate Greenhouse Gas Emissions
313
use of biofuel alternatives for niche and specific applications and the participation of several
countries in the global biofuel production.
Source: BP, 2009 and EIA, 2010 (oil prices); Energy Research Company (EPE, 2010) and Brazilian
Ministry of Agriculture, Livestock and Food Supply (MAPA, 2009) (Brazilian ethanol production)
Fig. 1. Evolution of Brazilian ethanol production and real world oil prices
Therefore, the aim of this chapter is to analyze several options of the most promising
biofuels in terms of GHG mitigation potential, taking into consideration the demand for
natural resources, GHG emission reduction, and technology availability in time.
The state of the art of lifecycle analysis (LCA) methodology to estimate de GHG emissions
in the production chain of the biofuels are evaluated based on a selected literature review,
aiming at the identification of the key issues in terms of reliability and reproducibility of the
results, unresolved problems and comparing the biofuel alternatives with respect to their
GHG emission reduction potential. The two major legislations related to biofuels (European
Renewable Energy Directive and US Renewable Fuel Standard) are analyzed to identify the
main points relative to GHG emission reduction requirements and the listed default values
for the various alternatives; this is a key issue in this chapter as it offers a good indication on
which ones are likely to survive in the long run.
Considered by many to be the most important unresolved problem, the determination of the
GHG emissions derived from land use changes, both direct and indirect (LUC and ILUC),
the theme is discussed based on the most recent works in this area that are or have already
been submitted to public consultation process. The impacts estimated are analyzed to
supplement the data presented in the previous section, indicating that they can be
significant and that more work is certainly required to improve the confidence of the results
to an acceptable level and to bring them to a broader range.
0
20
40
60
80
100
120
0
5
10
15
20
25
30
1972 1976 1980 1984 1988 1992 1996 2000 2004 2008
Real world oil prices
(US$ per barrel 2009)
Brazilian ethanol production
(billion litres)
Year
Evolution of Brazilian ethanol production and
real world oil prices
Ethanol production
Yearly real world oil prices
Planet Earth 2011 – Global Warming Challenges and Opportunities for Policy and Practice
314
The land requirement to produce biofuels is discussed with respect to the potential
availability, possible long term biofuels targets and the importance on the sustainability; it is
stressed the importance of biofuel yields in all aspects of sustainability.
To be able to produce practical data, the work will concentrate in a case study, taking
sugarcane ethanol produced in Brazil as an alternative to displace significant amounts of
gasoline worldwide as transport fuel. In this way, the impacts of resource demand, energy
balance and GHG lifecycle analysis, including LUC and ILUC effects, can be assessed. The
introduction of 2G technologies after 2020 using the sugarcane fiber as feedstock is also
investigated as well as the introduction of improvements in the 1G technology of sugarcane
ethanol production in the future.
2. Characteristics of biofuels
There are some important characteristics of the biofuels that indicate how well they will
perform in terms of meeting the objectives of mitigating the GHG emissions, improving
energy security and strengthening the rural economy, without causing meaningful negative
impacts on the local environment, food/feed production and prices, biodiversity, social-
economic conditions of the local community and, probably the most important of all, be
economically viable in the long term without subsidies. For the sake of maintaining the
focus on the main issues, only the aspects of GHG mitigation potential and land demand
will be considered.
2.1 GHG mitigation potential
The technical and scientific literature is rich in articles and reports dealing with biofuels
GHG Life Cycle Analysis (LCA). Larson (2006) reviewed more than 30 publications on this
subject covering a broad spectrum of biofuels such as first generation (1G) ethanol,
biodiesel, pure vegetable oil, esters, ethers from different feedstocks and second generation
(2G) ones including lignocellulosic ethanol and ETBE, Fischer-Tropsch diesel and dimethyl
ether (DME) from crop residues and woody crops and grasses; a wide variation in the
results was observed in terms of net energy balances and GHG mitigation potentials, even
for the same type of biofuel. The reasons for this high uncertainty were attributed to
possible range of the input values and variability of the assumptions related to GHG
included, N
2
O emissions, soil carbon dynamics and allocation method used to give credit to
co-products. All but two of the works reviewed were related to developed countries
conditions and the two exceptions referred to Brazil and India. In this work it is stressed the
importance to refer the GHG emissions and net energy balances to the land used in the
feedstock production (tonnes of CO
2
eq/ha) and not only to the energy content of the biofuel
(gCO
2
eq/MJ). Another review of biofuels energy balances and GHG LCA covering 30
relevant papers and reports (Manichetti and Otto, 2008), screened from a set of 60 works,
has also indicated a wide variation in the results for the different types of biofuels and
feedstocks, even among analyses of the same biofuel and feedstock. First generation (1G)
ethanol from maize, wheat, sugarcane and sugar beet and biodiesel from rapeseed, soy
beans, sunflower and palm oil, as well as second generation (2G) cellulosic ethanol and
Biomass to Liquid (BtL) biofuels, were included in the works reviewed. The agricultural
phase is appointed as responsible for most of the GHG emissions and for the adverse local
environmental impacts, while the processing phase had the largest contribution to energy
The Choice of Biofuels to Mitigate Greenhouse Gas Emissions
315
use, with the exception of sugarcane ethanol. The main uncertainties are related to N
2
O
emissions, due to its complex process and dependence on site specificities, agricultural
inputs and co-products allocation methodology with its many alternatives. The emissions
due to land use change, both direct and indirect (LUC and ILUC), were not included in the
analyses but their importance was emphasized. Among other causes of uncertainties and
variation in the results it was mentioned the temporal, geographical and technological
representativeness of the life cycle inventory data, derived mainly from the use of different
data sources for the same unit process. The use of best values or average values for a specific
production path, differences in yields and inputs have a strong impact on the final results.
The integration of different inputs to produce different products (the biorefinery concept)
and the technological evolution impacts were suggested as topic to be considered in future
work in this area. Once again, the data and results were mainly related to developed
countries pointing to the necessity to know better the performance of biofuels in terms of
GHG LCA and energy balance in developing countries.
There are many more publications dealing with this theme, but they generally lead to the
same conclusions of the two works discussed above:
To be able to compare biofuels in terms of energy balance and GHG emissions, more
precise procedures and methods need to be developed and reliable data from the same
or similar sources should be used. System boundaries, GHG species considered, co-
product impact allocation methods, yields and inputs data, non energy GHG emissions
calculation procedures and assumptions are the key issues.
The agricultural phase is the key area in terms of GHG emissions; non energy related
GHG emissions, such as soil emissions due to fertilizer use and soil carbon stock
dynamics, result from very complex processes that depend on the local soil and climate
conditions and agricultural practices and even the past history of land use.
The processing path is very important in terms of energy balance, especially for ethanol,
and can be critical also with respect to GHG emissions if high carbon footprint fuels
(such as coal) are chosen.
Land use change derived emissions, both direct and indirect (LUC and ILUC), need to
be considered, but the methodology and tools necessary for this task are not yet
established properly; the dynamics of LUC and ILUC evaluated using econometric
models need to evolve a lot more to be widely accepted, and soil emission data from
world wide data basis that does take into account the local conditions in many countries
and regions need to be produced and properly organized.
Recently, two major biofuels programs were launched supported by specific legislation in
USA (Renewable Fuel Standard – RFS2, defined in the Energy Independence and Security
Act of 2007) and in the EU (the 10% share of renewable energy in transport by 2020
mandated by the Directive 2009/28/EC Of the European Parliament and of the Council of
23 April 2009). Both legislations establish requirements to qualify the biofuels to be counted
to meet the targets and the potential GHG emission reduction is a key parameter in this
qualification process.
The EU Directive requires a minimum threshold limit for GHG emission reduction
compared with the replaced fossil fuel of 35% starting in 2013 (biofuels produced in new
installations are already required to meet this limit); this limit will be increased to 50% by
2017 and to 60% by 2018 (in this last case it applies to biofuels produced in new plants).
Second generation biofuels (2G) and those produced from wastes and residues will count
Planet Earth 2011 – Global Warming Challenges and Opportunities for Policy and Practice
316
twice toward the targets; biofuels produced from feedstocks cultivated in restored degraded
land will receive a bonus of 29 gCO
2
eq/MJ to be discounted from the biofuel LCA
emissions. To facilitate the qualification of the biofuels according to this criterion the rules to
calculate the GHG impacts of biofuels are presented in the Directive (Annex V) and default
values (without LUC and ILUC effects) are included to be optionally used instead of values
obtained from a formal calculation procedure. Table 1 presents some of these typical and
default values for different biofuels and production pathway.
Biofuel production pathway
Typical GHG
emission saving (%)
Default GHG
emission saving (%)
Wheat ethanol (lignite as process fuel in CHP
plant)
32 16
Wheat ethanol (natural gas as process fuel in
CHP plant)
53 47
Wheat ethanol (straw as process fuel in CHP
plant)
69 69
Corn ethanol , Community produced (NG in
CHP plant)
56 49
Sugar beet ethanol 61 52
Sugarcane ethanol 71 71
Rapeseed biodiesel 45 38
Sunflower biodiesel 58 51
Soybean biodiesel 40 31
Palm oil biodiesel (process not specified) 36 19
Waste vegetable oil or animal oil 88 83
Pure vegetable oil from rapeseed 58 57
Wheat straw ethanol (2G) 87 85
Farmed wood ethanol (2G) 76 70
Waste wood Fischer-Tropsch diesel (2G) 95 95
Farmed wood Fischer-Tropsch diesel (2G) 93 93
Source: Directive 2009/28/EC
Table 1. Typical and default values for GHG emission reduction for biofuels not including
LUC/ILUC derived emissions
The Choice of Biofuels to Mitigate Greenhouse Gas Emissions
317
From the Table 1 above some conclusions can be drawn:
The GHG emission reduction performances of the biofuels are very much
dependent on the feedstock and production pathway, especially on the process fuel
used.
Waste materials, either as feedstock or process fuel, offer superior performance in terms
of GHG abatement potential.
Second generation biofuels (2G) promise the highest GHG emission reductions but the
production technologies have yet to be demonstrated at commercial scale.
Among the first generation alternatives (1G), sugarcane ethanol has the highest impact
on GHG emission reduction, even considering the emissions derived from the transport
of the biofuel from the producing country to EU.
Some biofuel alternatives will not meet the Directive GHG emission reduction
threshold limits, but nevertheless are widely used today and their productions are still
expanding.
The inclusion of the GHG emissions derived from LUC and ILUC will bring several
biofuel alternatives, that seems to meet the Directive limits, to the non attainment area,
especially those that exhibit lower yields such as grain ethanol and oil seed biodiesel
(except palm oil).
In the USA, the Renewable Fuel Standard (RFS2) has taken a slightly different approach in
the sense that it established four different types of biofuels with different GHG emission
reduction threshold values, minimum volume to be used in 2022 and phase in time
schedule: renewable fuel (essentially corn starch ethanol), cellulosic biofuels, biomass
based biodiesel (excludes vegetable oil and animal fat co-processed with petroleum) and
other advanced biofuels (including co-processed biodiesel). The minimum annual
volumes in 2022 and minimum threshold limits for the life cycle GHG emission reduction
compared with the fossil fuel displaced are: corn starch ethanol – maximum volume of 15
billion gallons (56.8 billion liters) to be reached in 2015 and minimum GHG emissions
reduction of 20% (for the new plants); cellulosic biofuels – 16 billion gallons (60.6 billion
liters) and minimum GHG emission reduction of 60%; biomass-based biodiesel – 1 billion
gallons (3.8 billion liters) and minimum GHG emission reduction of 50%; and other
advanced biofuels – 4 billion gallons (15.1 billion liters) and GHG emission reduction of
50% (EPA, 2010).
Likewise the EU Directive, EPA presents default values for lifecycle GHG emissions
reduction for different biofuels and production pathway; in the EPA case the LUC and ILUC
derived emissions are included. Some of these default values are shown in Table 2.
Here also, there are significant differences among biofuels production pathways and fuel
used in the process. When the LUC and ILUC effects are included, corn ethanol does not
qualify as an advanced biofuel even in the case where biomass is used as fuel; with
natural gas as the fuel it barely qualifies as a renewable biofuel and with coal fueled
plants there is practically no GHG emission reduction in the lifecycle. Sugarcane ethanol
qualifies nicely as an advanced biofuel even in the case where the residues are not
collected and used; when this is done, there is a considerable benefit for GHG emission
reduction. Second generation ethanol offer a considerable advantage in terms of GHG
reductions. The values above 100% are the result of co-product credits allocated in favor
of the biofuel.
Planet Earth 2011 – Global Warming Challenges and Opportunities for Policy and Practice
318
Biofuel Production pathway
GHG emission reduction
(%)
Corn ethanol Dry mill with NG 21
Corn ethanol Dry mill with coal 1
Corn ethanol Dry mill with biomass 38
Sugarcane ethanol No residue collection 61
Sugarcane ethanol With residues collection and
surplus power generation
91
Cellulosic ethanol Switchgrass – biochemical 110
Cellulosic ethanol Switchgrass – thermochemical 72
Cellulosic ethanol Corn stover – biochemical 129
Cellulosic ethanol Corn stover – thermochemical 92
Corn butanol Dry mill with NG 31
Soy bean biodiesel FAME 57
Waste grease biodiesel FAME 86
Source: EPA, 2010
Table 2. Lifecycle GHG emissions reduction default values for different biofuels and
production pathways in 2022 (LUC and ILUC derived GHG emissions are included)
In a quick comparison between the two major pieces of biofuels legislation some
observations can be made:
The amount of biofuels required in the next 10 years will be considerable, but looking
only at the additional volumes needed above today’s production the goals seem
achievable in the total. However, the expectations on second generation (2G) biofuels
may not materialize in such a short time. The USA ethanol and biodiesel productions in
2009 were 41 billion liters and 2.1 billion liters, respectively, and in EU these volumes
were 3.6 and 8.9, respectively (REN21, 2010).
The installed capacity in USA was already 12 billion gallons/year of ethanol (EPA,
2010). In the EU, the 10% renewable energy participation in transport is estimated to be
divided in 5.6% for biofuels (in 2008 biofuels already represented 3.3% of transport fuel
use) and 4.4% for other renewable alternatives, mainly electricity, what will demand a
significant improvement in the electric vehicle (EV) technologies to reduce the costs
from the present values.
The threshold limit of 50% for the GHG emission reduction, including the LUC/ILUC
impacts, will not be easily satisfied by most grain ethanol and oil seed biodiesel with
pathways using fossil fuels. Biomass fuel will help to improve the GHG performance
of the biofuels, but it is constrained by cost and availability in large scale and there
will be competition for feedstock for 2G plants. Sugarcane has a tremendous benefit
in this respect since there are large amounts of residues in the distillery (bagasse that
is the residue from the juice extraction operation) quite enough to supply all the
energy needed to operate the distillery and to generate surplus electricity for sale;
with the collection of the agricultural residues (trash: sugarcane tops and leaves) and
the surplus bagasse it is possible to have a 2G plant operating integrated with the 1G
distillery with synergies that will result in lower investment and operating costs as
well as higher GHG emission reduction.
The Choice of Biofuels to Mitigate Greenhouse Gas Emissions
319
Some type of biofuel sustainability certification criteria will be formally introduced in
the two regions including other aspects beyond GHG emission reduction capabilities
such as local environmental impact (air, soil and water), protection of biodiversity,
avoided use of land with high carbon stock, social impacts and others.
3. LUC/ILUC impacts
An important component of the total lifecycle emission of GHG of biofuel production/use
chain is likely to come from the impacts of LUC and ILUC. To put the subject under a right
perspective the differences between the two effects must be made clear: direct land use
change is the change in land use that occurs within the system boundary when the feedstock
is planted replacing an existing land use (pasture, other crop, forest, etc.); indirect land use
change takes place when agricultural production displaced by the biofuel feedstock crop
will take place in other area, or even in other country, in its turn, displacing an existing land
use. This concept exists for many years but it came to the spotlights with two articles
published in 2008 in Science (Searchinger and al. and Fargione and al., 2008); these articles
had the merit to bring the concept to a broader discussion, but on the negative side they
presented results for LUC/ILUC GHG emissions that were unreasonably high as a
consequence of inadequate data and assumptions used (see Table 4 at the end of this
section). It was a case similar to the famous publication of Thomas Malthus in 1798 An Essay
on the Principle of Population where he predicted that the world population would starve in
the future because it increased in a geometric rate while the food supply grows according to
an arithmetic rate; his calculations were corrected, but his hypotheses were not, since he did
not considered the agricultural yield growth and other technological improvements.
GHG emissions resulting from land use change are related to soil carbon stocks loss (or gain
when the impact is positive) and N
2
O soil emissions due to fertilizer decomposition, change
in soil carbon stock, residues decomposition and other. There are emission factors suggested
by the IPCC, but real values are difficult to estimate because they depend on soil and
climate conditions, agricultural practices (type of fertilizer and way it is applied) and
previous use of the soil, since soil carbon stocks change slowly. The modeling of land use
change uses normally economic based model of the computable general equilibrium or
partial equilibrium concepts, sometimes coupled with optimization models, but several
other types of model are available for this application in spite the fact that they were
developed for other uses and have to be adapted to analyze the land use dynamics (CBES,
2009). A literature review concerning the impact of land use change on greenhouse gas
emissions from biofuels was prepared by the DG Energy for the European Commission (DG
Energy, 2010) and has shown that, although scientific progress has been made, consensus is
still far from being reached. Some of the critical issues identified are: land use data, a
fundamental part of the LUC modeling, is very poor and unreliable; there are some
confusion with respect to handling crop yields variation and multi-cropping intensity;
elasticities between increase in demand and improving yields are difficult to quantify
empirically; rotation of land in and out of crop production leads to erroneous classification
of land use type; how the biofuel feedstock is determined and the co-products credits are
allocated and the corresponding impacts on land demand are not clearly explained; and, last
but not least, it is not only how much land will be converted that matters, but also what type
of land since this has a strong implication on the emissions due to the fact the carbon stock
(above and below the ground) vary with the type and location of soil and present land use.
Planet Earth 2011 – Global Warming Challenges and Opportunities for Policy and Practice
320
In this last issue, it is critical the share of forest/woodland converted to crops, considering
the high carbon stocks and the impacts on biodiversity and other environmental services. It
was also observed from the review that carbon stocks had significant variation among the
studies, even for the same type of land (sometimes by a factor of 15) and the dynamics of
pasture use for livestock production is poorly understood.
Considering the complexity of the land use impacts and the lack of consensus on how they can
be estimated, the US Department of Energy (USDOE) Biomass Program sponsored a
workshop on May 11 to 14, 2009, with more than 50 experts from around the world, to review
the state of science, identify opportunities for collaboration, prioritize the next steps for
research and discuss the data needed in terms of availability and quality. The focus was
selected to be the interface between land use changes and global economic models; the main
finding was that there was a need to improve current generation of land use change models
and the central limiting problems were the historical data on land use (not land cover) that are
frequently nonexistent or available only in a very coarse scale, and the poor understanding of
the driving factors of LUC. Initial land use change drivers (cultural, technical, biophysical,
political, economic and demographic) usually change in time and location, a condition not
handled by the models; data from different sources with varying quality and high level of
aggregation just add more uncertainties to the modeling. Other important drivers are
governance capacity, population growth, land tenure regimes, macroeconomic and trade
policy, environmental policy, infrastructure, land suitability, domestic and international
agricultural and energy markets, and climate conditions; it seems unlikely that a single model,
or even a combination of different models, could handle quantitatively all these drivers and
produce consistent and replicable results. The most recent important tentatives to estimate the
LUC/ILUC impacts have used economic equilibrium models (general or partial equilibrium)
oriented to agriculture associated with spatially explicit land use models and optimization
models. A combination of models tends to increase the scope of the analyses, but bears the risk
of increasing the uncertainties due to error propagation from one model to the other. A final
conclusion of the workshop was that there was a strong agreement among the participants
regarding the uncertainties surrounding current use of global economic models to project the
land use change effects of biofuels.
Nevertheless, both the EISA and EU Renewable Energy Directive require that the ILUC
impacts be included in the lifecycle analysis of GHG emissions of the biofuels, immediately
in the case of EISA and in a near future in the EU Directive.
EPA was in charge of managing the EISA mandate and produced the necessary studies and
analyses leading to the RFS2 Final Rule in terms of default values for different biofuels and
production pathways shown in Table 2 above (EPA, 2010). The international ILUC GHG
emission values for corn ethanol and sugarcane ethanol were established as 30.3 gCO
2
eq/MJ
and 3.8 gCO
2
eq/MJ, respectively.
The European Commission has not come to a final decision about the values of GHG
emissions resulting from ILUC effects from the production of biofuels, but several reports have
been submitted to public consultation in 2010 (IFPRI, DG Energy, 2010 and JRC, 2010a and
2010b) covering several aspects of the problem. The work of the International Food Policy
Research Institute (IFPRI, 2010), that seems to be the main document, used a modified version
of the MIRAGE model (Modeling International Relationships in Applied General Equilibrium)
to analyze the impact of the increase of biofuel consumption in the EU due to the requirements
of the EU Renewable Energy and Fuel Quality Directives. The baseline was determined
assuming the biofuel share in transport fuel in 2008 (3.3%) would remain constant from 2009 to
The Choice of Biofuels to Mitigate Greenhouse Gas Emissions
321
2020, and the Directive scenario assumes that in 2020 the first generation biofuel will represent
5.6% of the total transport fuel demand. The modeling considered that biofuels will compete in
the international market considering three alternatives: same situation as today in terms of
import duties and other barriers (Business as Usual Scenario), global free trade regime and free
trade with the MERCOSUR. Some results are presented in Table 3 for the Business as Usual
Scenario (BAU), without considering the peatland drainage for the production of palm oil, for
the marginal (considers the effects of the new production of biofuels disregarding the past
average values) Indirect Land Use and marginal Net Emission Reductions by the production
and use of ethanol and biodiesel from different feedstocks.
Biofuel ILUC Emissions
Net Emissions Reductions
(*)
Ethanol - sugar beet 16.1 -35.9
Ethanol - sugarcane 17.8 -54.0
Ethanol – maize 54.1 3.6
Ethanol - wheat 37.3 -7.0
Biodiesel – palm oil 46.4 -22.0
Biodiesel – rapeseed 53.0 8.8
Biodiesel – soy bean 74.5 24.1
Biodiesel - Sunflower 59.9 8.7
Source: IFPRI, 2010
(*) Negative values mean emission reduction with respect to the fossil fuel displaced
Table 3. Marginal indirect land use emissions and marginal net emission reductions from
the production and use of biofuels (gCO2eq/MJ, 20 years lifecycle)
Analyzing the data presented in Tables 2 and 3 for the first generation biofuels it can be
concluded that:
Only sugarcane ethanol qualifies as an advanced biofuel according to RFS2 rules (50%
minimum emission reduction) and can meet the requirements of the EU Directive for
2017 (50% minimum emission reduction), and with a little improvement can meet also
the 2018 requirement (60% minimum emission reduction).
Palm oil biodiesel is the only alternative of this biofuel that can reduce the GHG
emissions in the replacement of fossil diesel; however, it does not meet the emission
reduction minimum threshold value of the EU Directive even for the initial value of
2013 (35%) for this value is only 24% (fossil fuel lifecycle emissions of 92 gCO2eq/MJ).
All other biodiesel alternatives will increase the GHG emission compared with mineral
diesel.
Maize ethanol is the worst alternative of this biofuel in terms of GHG emission
reduction, and even increases slightly the emissions compared with fossil gasoline, for
the European Union case.
Sugar derived ethanol have a better GHG abatement performance than the grain
ethanol alternatives, but sugar beet ethanol can meet only the 2013 requirement.
Ethanol, in general, is a better option to reduce GHG emission in transport than
biodiesel.
Planet Earth 2011 – Global Warming Challenges and Opportunities for Policy and Practice
322
With that said, it remains the question why so many countries are persisting with the idea to
develop programs to promote biofuels with such a poor performance in terms of GHG
abatement potential (grain ethanol and oil seed biodiesel)? The possible explanation is the
intention to help the local agricultural sector and to reduce a little the oil imports. Although
there is a large amount of uncertainties in the LCA of GHG emissions of biofuels in general,
and the LUC/ILUC derived emissions in particular, these results are at least a qualitative
indication that biofuels are not equal. Table 4 presents results from different sources
including the extremely high value from Searchinger and co-authors (Searchinger et al.,
2008), that are out of the range of the results from the other studies by the California Air
Resources Board (CARB), US Environmental Protection Agency (EPA) and International
Food Policy Research Institute (IFPRI).
Reference Maize ethanol Soybean biodiesel
Searchinger et al., 2008 156 165-270
CARB, 2009 45 63
EPA, 2010 47 54
IFPRI, 2010 54 75
Source: EC, 2010
Table 4. Land use change GHG emissions results from different works (gCO
2
eq/MJ)
3.1 Land requirement for biofuel production
It is interesting to start to look the land availability situation around the world today and in
the future to have a clear picture of how much and where there is land availability for this
purpose. The second step will be to look what are the possible targets for biofuel production
in the long term.
Doornbosch and Steenblik (2007) have made a good assessment of the land use and
availability worldwide based on the work developed by the Food and Agriculture
Organization of the United Nations (FAO) and the International Institute for Applied
System Analysis (IIASA). The results indicate that around 440 million hectares (Mha) will be
available by 2050 for rain-fed cultivation of energy crops. This figure considers that the land
needed to feed the additional population (from 6.5 to 9 billion people), estimated in 200
Mha, 100 Mha to accommodated population growth (housing and infrastructure) and the
preservation of forests is discounted from the total land available. Nearly all this land
availability is concentrated in South and Central America and Africa, and is presently being
used as grassland for livestock production; therefore, land use change will take place and
pasture intensification will be needed, a fact that is already taking place in many regions in
the world. It is important to notice that this 440 Mha represents less than 10% of the 5,000
Mha of land under management (1,500 Mha arable and 3,500 Mha grassland), but should be
considered as an upper limit for land available for energy crops by 2050. Deforestation is a
major concern, but the causes are very complex and poorly understood, varying in space
and time, deserving the attention of the scientific community to develop science based
The Choice of Biofuels to Mitigate Greenhouse Gas Emissions
323
cause-effect relationships; today, the problem is being treated more on the emotional and
subjective basis. Nogueira, 2008, presented some data on deforestation rates in Brazil
between 1988 and 2006 and the variation does not seem to correlate well with the increase in
agricultural production. In summary, land for energy crops production is not unlimited and,
therefore, the biofuel options that present higher yields have a clear advantage in this
aspect. Table 5 presents the estimated yields of different biofuels/feedstocks where a wide
variation can be observed, even for the same biofuel/feedstock produced in different
regions.
Region-Biofuel Feedstock
Yields 2005
(l/ha)
Yields 2050
(l/ha)
EU-ethanol
Wheat 2 500 3 420
EU-ethanol
Sugar beet 5 000 6 750
EU-biodiesel
Rapeseed 1 200 1 640
US/Canada-ethanol
Corn 3 000 4 040
US/Canada-biodiesel
Soybean/rapeseed 800 1 100
Brazil-ethanol
Sugarcane 6 800 9 160
Brazil-biodiesel
Soybean 700 1 100
Rest of world-ethanol
Sugarcane 5 500 8 480
Rest of world-ethanol
Grain 2 000 3 090
Rest of world-biodiesel
Oil palm 2 500 3 910
Rest of world-biodiesel
Soybean/rapeseed 1 000 1 570
World-ethanol
Ligno-cellulose 4 300 7 580
World-BtL biodiesel
Biomass 3 000 5 960
Source: IEA, 2008
Table 5. Biofuels yields for different feedstocks and production regions
Even considering that the effects of the co-products are not included in Table 5, it can be
seen that there are significant differences among biofuels and feedstocks, and among
different regions in the world, in terms of land requirement for biofuels production, that
must be taken into consideration in deciding which alternatives should be implemented.
Besides the competition with land for food/feed production, the biofuel yields affects
heavily the LUC/ILUC derived GHG emissions, as seen in session 3 above, and have a
significant impact on production costs (agricultural inputs and field operations are related
to cropped area and not to crop production quantity) and biodiversity. Sugarcane appears
Planet Earth 2011 – Global Warming Challenges and Opportunities for Policy and Practice
324
again as the best option, now and in the future, and can compete in equal terms with second
generation alternatives with respect to land demand, with the advantage that the technology
is ready now and not in the future. The superiority of ethanol compared with biodiesel is
also demonstrated and sugarcane ethanol is the winner; considering that sugarcane is
produced in more than 100 countries it seems reasonable to expect that the dissemination of
this biofuel alternative has some probability to succeed if the right approach and policies are
used. Molasses, the byproduct of sugar production, seems to be the cheapest feedstock for
bioethanol, although there are some uncertainty about its availability for this application
since it is already widely used for several applications, such as, beverage production, cattle
feed, other products from fermentation (lysine, glutamates, solvents, etc.).
4. Sugarcane ethanol: A case study for Brazil
It is interesting at this stage to use the information described in the previous section to make
some simulations, using the Brazilian current and future conditions, to get a feeling of the
impacts of the production and use of biofuels in general, and ethanol in particular, on the
GHG emission reduction potential and land demand.
The Brazilian Government prepared and released the Agroecological Zoning (AEZ) of
sugarcane (EMBRAPA, 2009) identifying 64.7 Mha of land available for rain-fed cultivation
of sugarcane without significant impacts on food production, deforestation, biodiversity and
protected areas. It is important to point out that these 64.7 Mha represent only 7.5% of the
country’s area, meaning that 92.5% of Brazil surface will not be used to produce sugarcane.
A recent study by the Interdisciplinary Center of Energy Planning of the University of
Campinas (Leite, 2009, Leite et al., 2009) tried to indentify the land demand and availability
for the production of a volume of ethanol sufficient to displace 5% or 10% of the projected
gasoline consumption in 2025; the socioeconomic impacts, necessity of investments in
distilleries, cane fields and infrastructure were estimated. The assessment of the land needs
for sugar production for internal and external markets was also included. These works will
be the reference for resources demand calculations and technology improvements with
impact on ethanol yields.
For the estimate of future biofuels consumption the values projected by IEA (IEA, 2009) for
the Reference scenario for 2030 will be used instead of the original estimates made in the
two works above (104 and 205 billion liters in 2025). That means 132 Mtoe of total biofuels of
which ethanol represents 79%, resulting in an ethanol demand around 200 billion liters in
2030, comparable to the estimated value used in the studies by Leite and Leite et al., 2009.
To estimate the land required to produce that amount of first generation ethanol in 2030 it is
necessary to estimate the yields for that date. Using IEA data as shown in Table 5 above,
which represents 0.7%/year yield improvement for sugarcane ethanol, the yield in 2030
would be around 8 100 liters/ha, demanding some 25.7 Mha. These figures are very
conservative since sugarcane yields have increased at a rate of approximately 1.6%/year in
the recent past; Landell et al., a group of sugarcane breeders, have drawn a roadmap for
sugarcane quality improvement resulting in average sucrose yield per hectare increasing at
a rate a little above 1.4%/year starting from 12,150 kg/ha/yr in 2010; considering also gains
in efficiency in the distillery leading to a global distillery efficiency of 90% by 2030, up from
85% in 2010, the resulting ethanol yield would be around 12,000 liters per hectare. The land
required to produce the 200 billion liters in 2030 would be reduced to 17 Mha, representing
The Choice of Biofuels to Mitigate Greenhouse Gas Emissions
325
only 26% of the 64.7 Mha indicated in the sugarcane AEZ and just a little more than 1% of
the current world arable land (1 500 Mha).
The 200 billion liters of ethanol in 2030 would be displacing 134 billion liters of gasoline that
would produce, using EPA data, some 400 million tonnes of CO
2
. Using also the EPA
estimate of 61% GHG emission reduction potential for the Brazilian ethanol indicated in
Table 2 the GHG emission reduction would be 244 Mt CO
2
eq (14.4 t CO
2
eq/ha), or 3.5% of
the total emissions in road transport estimated for that year (IEA, 2009). In the future, if the
sugarcane residues (bagasse and straw) were better used in a 2G plant integrated with the
1G distillery an additional 3000 to 4000 liters of ethanol would be obtained (Leite et al.,
2009), reducing the land demand to no more than 13 Mha and the saved GHG emissions
would increase to 364 Mt CO
2
eq or 5% of the road transport emissions.
Just to make a quick comparison with the alternative of US corn ethanol, using the IEA yields
of 3 600 liters/ha (IEA, 2008) and the GHG emission reduction default value from EPA of 21%
(EPA, 2010) the required area would be 55 Mha and the GHG emission savings of only 84 Mt
CO
2
eq, or just a little over 1% of the projected road transport emissions. It must be said that
these estimates are good for qualitative comparison only, since there are many uncertainties
that need to be resolved in the LCA GHG emissions of the biofuels production/use chain,
specially related to the ILUC effects. Another point is that the ILUC derived emissions
calculated by econometric models are not linear with respect to biofuel volume produced;
therefore the use of EPA values for other volumes is a simplified approach.
More data on Brazilian sugarcane ethanol LCA GHG emissions can be found on Macedo et
al, 2008 and Macedo and Seabra, 2008.
Other considerations concerning the sustainability of ethanol production in Brazil are not
included here, but they can be found in several publications dealing specifically with this
subject such as, Smeets et al., 2006, Macedo, 2007, Walter et al., 2008, Zuurbier and van de
Vooren, 2008, Goldemberg et al., 2008, Oliveira, 2011.
5. Final comments
The presentation of a plentiful of data obtained from studies made by well recognized and
reputable institutions and researchers had the aim of indicating significant differences
among the biofuels alternatives considering only two of their main characteristics: GHG
abatement potential and land demand. A third very important characteristic, the production
cost, was not included in the effort to compare biofuels because it was outside of the scope
of this chapter, but nonetheless it is the key characteristic for the long term survival of the
biofuel option without subsidies.
GHG emission savings is a fundamental characteristic for attainment of the qualification
status of the biofuel according to the two major legislations in effect today: the EU
Renewable Energy Directive and the US Renewable Fuel Standard (RFS2), and therefore the
LCA GHG emissions of a biofuel is a crucial characteristic to be taken into account in the
process of selecting the best alternative. Needless to say that it should be the “go no go” test
if the biofuel production and use is intended to mitigate the global warming effect when
displacing fossil fuels. In spite all that, the methodology and procedures to perform the LCA
of the GHG emissions in the production path still have several points that need
improvements and definitions: climate active gases included, allocation methods to divide
the LCA emissions among co-products, N
2
O emissions, soil carbon dynamics and the
indirect land use change impacts (ILUC). The soil emissions, one of the most complex point
Planet Earth 2011 – Global Warming Challenges and Opportunities for Policy and Practice
326
in the analyses, are highly dependent on the local conditions (climate, soil, agricultural
practices, past history of land use) and there is an urgent need to improve and extend the
few existing data bases on soil characteristics, land use past dynamics, agricultural practices
(fertilizer use, tillage types, crop rotation, double cropping, etc.). Besides the improvement
of the input data, the determination land use change indirect effects is another area that
needs more research and development of the models to make them able to simulate the
driving forces of land use (highly variable in time and space), the cause/effect relationship
of crop dynamics (where the displaced crops really go and what caused the occupation of
native vegetation), cattle grazing and many other things.
Land for agriculture is a finite resource and, therefore, the demand for biofuels production
must be carefully considered and in this process the yields are the main point. Besides, the
ILUC impact on the LCA GHG emissions are highly dependent on the land, as well as the
production costs and energy demand are more related to the area cultivated than to the
volume of feedstock produced (fertilizer, herbicide, land preparation, agriculture operations
and land rental). This reasoning should lead to the selection of biofuels alternatives with
higher yields, such as sugarcane and sugar beet ethanol and palm oil biodiesel, but the
reality is quite different with the domination of ethanol from grains and biodiesel from rape
seed. In 2008, according to UNEP, 2010, to world biofuel crop production used around 36
Mha, or 2.3% of the arable land, to produce 67 billion liters of ethanol and 12 billion liters of
biodiesel (REN21, 2009). Using the yield values indicated in Table 5 and assuming all
ethanol from US corn and all biodiesel from EU rapeseed the total area required would be
32 Mha, very close to UNEP value; in the case where all ethanol is produced from sugarcane
in Brazil and all biodiesel from oil palm the total area required would be 15 Mha, or less
than half of the previous case. The 36 Mha estimated by UNEP is an indication that very low
yield options are being widely used around the world, in spite the dominance of USA and
Brazil in ethanol and EU in biodiesel. In the IEA projections land demand projections for
biofuels in 2050 an average value of 160 GJ/ha is used, including second generation
biofuels; Leal, 2007, projected for 2020 the yield gains for Brazilian sugarcane ethanol to
7,900 l/ha for 1G ethanol and 11,700 l/ha (245 GJ/ha) for an integrated 1G and 2G
production using sugarcane sugars (1G) and fibers (2G).
Other important characteristics were not included in the evaluations due to the limitation
necessary to keep the chapter at a reasonable size and scope. It is important to point out
that several other characteristics such as impacts on the local environment and
biodiversity, as well as some of the main socioeconomic impacts are strongly related to
the extension of the land required to produce the biofuel feedstocks. Therefore, biofuel
yield, energy balance and GHG emission reduction potential are critical issues for most of
the situations around the world, but there are some specific local conditions that take the
priorities to other areas such as job creation, local energy supply and development and
creation of outlet for some local production potential constrained by lack of market access
due non existence of storage and distribution infrastructure. Different driving forces may
lead to different optimal solutions.
The Brazilian experience with the efficient and economic production of sugarcane ethanol is
available as a reference for countries interested to deploy a biofuel program, but it cannot be
expected to be readily transferable to some of the more than 100 sugarcane producing
countries due to significant differences in the local conditions, including technology access,
land tenure issues, human resources, cultural aspects and strength of the different drivers.
The Choice of Biofuels to Mitigate Greenhouse Gas Emissions
327
In summary, to make sure that the negative impacts on land demand are minimized and the
positive impacts on GHG emission reductions are maximized it is crucial to make the proper
choices if biofuels are to play an important role in the future world energy scenario.
6. References
BP, 2010, British Petroleum Statistical Review of World Energy June 2009, www.bp.com/
statisticalreview.
CBES, 2009, Center for BioEnergy Sustainability, Oak Ridge National Laboratory, Land-use
change and bioenergy: Report from the 2009 workshop, 76p.
Doornbosch, R. and R. Steenblik, 2007, Biofuels: Is the cure worse than the disease?,
Organization for Economic Co-operation and Development Report SG/SD/RT
(2007)3, Paris, 57p.
EC, 2010, European Commission, Report from the Commission on the indirect land-use
change related to biofuels and bioliquids, COM(2010)811 final, Brussels, December
22, 2010.
EIA, 2010, US Energy Information Administration, EIA – Short Term Energy Outlook –
April 2010.
EMBRAPA, 2009, Empresa Brasileira de Pesquisa Agropecuária, Zoneamento Agroecológico
da Cana-de-Açúcar, Rio de Janeiro, RJ, 2009, 56p.
EPA, 2010, US Environmental Protection Agency, Renewable Fuel Standard Program (RFS2)
Regulatory Impact Analysis, EPA-420-R-10-006, 1120p.
EPE, 2010, Energy Research Company (Empresa de Pesquisa Energética) – EPE, Brazilian
Energy Balance 2010, year 2009, Rio de Janeiro, EPE,
BENRelatorioFinal2010.aspx.
Fargione, J., J. Hill, D. Tillman, S. Polasky, and P. Hawthorne, 2008, Land Clearing and the
biofuel carbon debt, Science 319, p 1235-1238.
Goldemberg, J., F.E.B. Nigro and S.T. Coelho, 2008, Bioenergia no Estado de São Paulo:
Situação Atual, Perspectivas, Barreiras e Propostas, São Paulo Official Press, 2008,
151p.
IEA, 2008, Energy Technology Perspectives 2008 – Scenarios and Strategies to 2050,
International Energy Agency, Paris, 2008.
IEA, 2009, World Energy Outlook 2009, International Energy Agency, Paris, 2009.
IFPRI, 2010, International Food Policy Research Institute, Global Trade and Environmental
Impact Study of the EU Biofuels Mandate, Final Report prepared by Perrihan Al-
Riffai, Betina Dinamaran and David Laborde, March 2010, 125p.
JRC, 2010a, Impacts of the EU biofuel target on the agricultural markets and land use: a
comparative modeling assessment, Scientific and Technical Report by the Joint
Research Council
JRC, 2010b, Indirect Land Use Change from increased biofuels demand, Scientific and
Technical Report by the Joint Research Council
Larson, E.D., 2006, A review of lifecycle analysis studies on liquid biofuel systems for the
transport sector, Energy for Sustainable Development, Vol. X, No. 2, June 2006, p
109-126.
Leal, M.R.L.V., 2007, The potential of sugarcane as an energy source, Proceedings of the
XXVI International Society of Sugar Cane Technologists (ISSCT) Congress, July 31
st
to August 3
rd
, 2007, Durban, South Africa, p 23-34.
Leite, R.C.C, 2009, Bioetanol combustível: uma oportunidade para o Brasil (in Portuguese),
CGEE , Brasilia, DF, Brazil, Coordinated by Rogério C.C. Leite, Brasília, DF, 536p.
Planet Earth 2011 – Global Warming Challenges and Opportunities for Policy and Practice
328
Leite, R.C.C., M.R.L.V. Leal., L.A.B. Cortez, M. G. Griffin and M.I.G. Scandiffio, 2009, Can
Brazil replace 5% of the 2025 gasoline world demand with ethanol?, Energy 34
(2009), 655-661.
Macedo, I.C. (organizer), 2007, Sugar cane’s energy – Twelve studies on Brazilian sugar cane
agribusiness and its sustainability, 2
nd
edition, São Paulo: Berlendis & Vertecchia:
UNICA, 2007.
Macedo, I.C.,J.E.A. Seabra, and J.E.A.R Silva,2008, Green house gases emissions in the
production and use of ethanol from sugarcane in Brazil: the 2005/2006 averages
and a prediction for 2020, Biomass & Bioenergy 32, 582-595, 2008.
Macedo, I.C. and J.E.A. Seabra, 2008, Mitigation of GHG emissions using sugarcane
bioethanol, in Sugarcane ethanol: Contributions to climate change mitigation and
the environment, Wageningen Academic Publishers, The Netherlands, 95-111,
2008.
Menichetti, E. and M. Otto, 2009, Energy balance and greenhouse gas emissions of biofuels
from life-cycle perspective in R.W. Howarth and S. Bringezu (eds) Biofuels:
Environmental Consequences and Interactions with Changing Land Use,
Proceedings of the Scientific Committee on Problems of the Environment (SCOPE)
International Biofuels Project Rapid Assessment, 22-25 September 2008,
Gummersbach, Germany, Cornell University, Ithaca, NY, USA, Ch. 5, p 81-109.
Nogueira, L.A.H., 2008, Sugarcane-Based Ethanol: Energy for Sustainable Development,
report prepared for the Banco Nacional de Desenvolvimento Econômico e Social
(National Bank for the Economic and Social Development) and Centro de Gestão e
Estudos Estratégicos (Center for Strategic Studies and Management in Science,
Technology and Innovation), Rio de Janeiro, 2008, 304p.
Oliveira, J.G., 2011, Indicadores Socioeconômicos em Estados Produtores de Cana-de-
Açúcar: Análise Comparativa Entre Municípios, Doctoral Thesis, College of
Mechanical Engineering, University of Campinas, Campinas, 2011, 202p.
Searchinger, T., R. Heimlich, R.A. Houghton, R.A., F. Dong, A. Elobeid, J. Fabiosa, S.
Tokgoz, D. Heyes, and T.H. Yu, 2008, Use of US croplands for biofuels increases
greenhouse gases through emission from land use change, Science Express,
February 7
th
, 2008.
Smeets, E., M. Junginger, A. Faaij, A. Walter and P. Dozan, 2006, Sustainability of Brazilian
Bio-ethanol, Report of the Copernicus Institute, University of Utrecht, for
SenterNovem, The Netherlands, 2006,107p.
UNEP, 2010, United Nations Environment Programme, Towards Sustainable Production
and Use of Resources: Assessing Biofuels, key authors Stefan Bringezu, Helmut
Schütz, Meghan O´Brien, Lea Kauppi, Robert W. Howarth and Jeff McNeely, Paris,
2010, 119p.
Walter, A., P. Dozan, O. Quilodrán, J. Garcia, C. da Silva, F. Piacente and A. Sergerstedt,
2008, A Sustainability Analysis of the Brazilian Ethanol, Report of the University of
Campinas to the UK Embassy in Brasilia, Campinas, November 2008, 167p.
Zuurbier, P. and J. van de Vooren (editors), 2008, Sugarcane ethanol: Contributions to
climate change mitigation and the environment, Wageningen Academic Publishers,
The Netherlands, 2008, 255p.
15
Contribution of the Atmospheric Chlorine
Reactions to the Degradation of Greenhouse
Gases: CFCs Substitutes
Iván Bravo
1
, Yolanda Díaz-de-Mera
2
, Alfonso Aranda
2
,
Elena Moreno
2
and Ernesto Martínez
2
1
Instituto de Ciencias Ambientales (ICAM), University of Castilla–La Mancha, Toledo
2
Departamento de Química Física, Chemistry Faculty
University of Castilla–La Mancha, Ciudad Real
Spain
1. Introduction
During the last few decades it has been shown that the use and dispersion of chemical
compounds emitted from anthropogenic sources, firstly considered as innocuous, have
dramatic effects on the global Atmosphere. The adverse environmental impacts of chlorinated
hydrocarbons on the Earth’s ozone layer have focused attention on the effort to replace these
compounds by non-chlorinated substitutes with environmental acceptability. Although new
materials have been developed for a large number of applications, a comprehensive solution
remains to be found. Therefore, many provisional applications, using chemicals with
unknown effects, are still currently found such as, refrigerants, foam agents, flame inhibitors,
solvents, propellants, anaesthetics, etc [see for example: 3M; EPA; IPCC; Shine, 2010].
Hydrofluoroethers (HFEs) have been introduced as ozone friendly alternatives in many
instances such as, refrigeration, electronic equipment, carrier fluids for lubricant deposition,
and fire suppression (EPA). HFEs contain no chlorine and, thus, have ozone depletion
potentials of essentially zero. One of the principal advantages of the HFE structure has been
determined to be the significantly shorter atmospheric lifetimes, when compared to HFCs
(hydrofluorocarbons) and PFCs (perfluorocarbons) (IPCC). However, the presence of the C-
O bond, together with C-F bonds in the hydrocarbon molecule, enhance the absorption
features in the atmospheric infrared window. In other words, HFEs are absorbers of infrared
radiation, thus raising concern about their possible roles as greenhouse gases. Thus, it is
necessary to improve our knowledge about lifetimes and global warming potentials (GWP)
of these compounds in order to get a complete evaluation of their environmental impact.
To provide an accurate evaluation of the global warming potentials, the lifetimes must first
be obtained.
The atmospheric lifetimes of pollutants is generally calculated on the basis of
the reaction rates with OH only (Kurylo & Orkin, 2003), assuming that the reaction rates are
independent of temperature. This is not suitable for chemicals with low reactivity. As a
relatively homogeneous vertical distribution in the troposphere is expected, to a large
extent, the losses of such chemicals take place at temperatures which are significantly lower
than 298K. Thus, for reactions with relatively high activation energy, E
a
, neglecting the
Planet Earth 2011 – Global Warming Challenges and Opportunities for Policy and Practice
330
temperature dependence of the kinetic rate constants may lead to an underestimation of the
corresponding lifetimes. In this regard, lifetimes 2.5 times longer were found for several
hydrofluoro(poly)ethers when the temperature dependence was considered (Myhre et al.,
1999). When calculating OH-based lifetimes, the use of 272K as an average tropospheric
temperature, and methyl chloroform (CH
3
CCl
3
), as a chemical of well known sources and
sinks, has been suggested (Spivakovsky et al., 2000) to minimize the errors resulting from
neglecting the specific temperature dependences.
Generally, HFEs show low surface sticking coefficients and low water solubility. Thus,
primary removal of HFEs in the troposphere will mainly be initiated by reaction with OH
radicals. Although global atmospheric abundance of OH radicals is around 2 orders of
magnitude greater than that of chlorine atoms, Cl reactions are generally faster than OH
reactions, k
Cl
/k
OH
10, so their contribution to the degradation of organic compounds may
be not negligible compared to the role of OH (Finlayson-Pitts & Pitts, 2000). The
contribution of Cl to the oxidation of HFEs could be significant in areas where the
concentration of Cl precursor species has been reported to be high, such as the coastal
boundary layer (Spicer et al., 1998).
The influence of the tropospheric temperature profile on the Cl rate constants has been
studied and reviewed for many halocarbons (IUPAC, NASA). Recently, this has been done
for HFEs as well. As it has been shown for OH reactions, the understanding of the kinetic
rate constants as a function of temperature is required to properly evaluate the contribution
of Cl reactions to the degradation of HFEs. The use of the rate constants at only 298K tends
to overestimate the global degradation rates of both OH and Cl reactions, given the decrease
of T with altitude. The degree of overestimation may be different for OH and Cl depending
on the specific value of E
a
. The data on temperature dependence are thus crucial to quantify
the absolute roles of OH and Cl, and their relative contributions.
In this work we will report the results obtained in the absolute kinetic study of the reactions
of Cl atoms with different CFC substitutes (four segregated HFEs), at temperatures ranging
from 234-343K, thus providing useful data to simulate the temperature profile characteristic
of the troposphere.
49 2 5
C F OC H HFE 7200 Products
(1)
49 3
C F OCH HFE 7100 Products
(2)
37 3
C F OCH HFE 7000 Products
(3)
37 2 5 3
2
n C F CF OC H CF CF HFE 7500 Products
(4)
To conclude, we will discuss some different strategies that can be used to design CFC
substitutes with low environmental impact. For this, computational chemistry offers an
alternative to the experimental procedures currently used to assess environmental
compatibility parameters such as, lifetimes, reaction mechanism or GWP. In the present
work, we will evaluate the radiative ability, and hence the contribution to Global Warming,
of the HFE-7500, using a recently reported theoretical method based on computational
techniques.
Thus, in the Experimental Section we describe the experimental method used in this work.
In the Results Section we describe the experimental conditions and we obtain the values for
Contribution of the Atmospheric Chlorine Reactions
to the Degradation of Greenhouse Gases: CFCs Substitutes
331
the rate constants for all the studied reactions at different temperatures, driving to the
Arrhenius’ expression for each compound. Furthermore, we present a study of the products
of the reactions, obtaining the branching ratio for the abstraction channel for each one. In the
Discussion Section, we compare the results obtained in this work with previous studies, we
discuss the reactivity of the studied compounds taking into account the number of –CF
2
-
groups in the structure, and, finally, we compare the ionization potential versus the k values
for segregated and no segregated HFEs. In the Atmospheric Implications Section, we discuss
the atmospheric implications of the studied reactions from the calculus of the lifetimes and
GWP for the CFCs substitutes. Finally, in Section 6 (Strategies to design CFC alternatives
with low environmental impact: The scope of the computational chemistry), we show and
discuss the results obtained for the radiative efficiency of HFE-7500 using new
computational techniques.
2. Experimental section
The experimental method used in this work (figure 1) (Aranda et al., 2006; Díaz-de-Mera et
al., 2008, 2009), is the absolute discharge flow-mass spectrometry. It incorporates a dual-
stage molecular beam system for the sampling. The mass spectrometer was equipped with
an electron-impact ion source and a Chaneltron electron-multiplier. The energy level of the
ionizing electrons was E
e
=40 eV. Typical pressures in the first chamber and in the chamber
hosting the mass spectrometer were below 1x10
-6
and 1x10
-8
Torr, respectively. Both radical
and molecular species were fed from the reactor to the first high vacuum chamber through a
stainless steel cone (250 m orifice diameter). They were then channelled through a second
stainless steel cone (1000 m hole diameter) into the mass spectrometer vacuum chamber, as
a molecular beam.
Fig. 1. Schematic view of the experimental set-up.
Planet Earth 2011 – Global Warming Challenges and Opportunities for Policy and Practice
332
Cl atoms were produced by flowing mixtures of Cl
2
and He through a microwave discharge
joined to the main reactor, inlet 1. The discharge tube was coated with phosphoric acid to
increase the Cl
2
dissociation yield. To reduce the wall losses of Cl atoms, the inner surfaces
of the reactor and the injector were coated with halocarbon wax. HFEs were added through
inlet 2 and the reactions with the Cl radicals were observed downstream at the end of the
axial injector.
All reactants were diluted in helium and stored in bulbs of known volume. For some
experiments, where concentrations of HFEs (7200 y 7100) had to be enhanced, the reactants
were used without dilution in helium, directly from the storage bulb. In order to assure
constant and accurate HFE concentrations, their flows were regulated with mass flow
controllers. The direct detection of the organic compounds was not possible since the mass
spectrometer is only able to detect masses just below 200 amu. However, the signals found
at m/e=131, 69, 120, and 69 for HFE-7200, HFE-7100, HFE-7000, and HFE-7500, respectively,
showed good intensity and no overlap with the peaks of the rest of the species.
Molecular chlorine was detected at its parent peak m/e=70 and the absolute concentration of
Cl atoms was measured by titration with BrCH=CH
2
in excess, and subsequent mass
spectrometric detection of ClCH=CH
2
at m/e=62 and BrCH=CH
2
at m/e=106 (Park et al.,
1983):
10 3 1 1
22
Cl BrCH CH ClCH CH Br k 1.4x10 cm molecule s
(5)
During a kinetic run (for HFE-7200, HFE-7100, and HFE-7000), the remaining chlorine was
observed indirectly as BrCl at m/e=116 by scavenging Cl atoms with Br
2
(Aranda et al., 2003).
Br
2
was introduced in excess at the end of the reactor through inlet 3, to ensure the complete
consumption of Cl atoms by Br
2
(Bedjanian et al., 1998):
10 3 1 1
2
Cl Br BrCl Br k (2.3 0.4)x10 exp[ 135 60) / T] cm molecule s
(6)
For HFE-7500, the remaining chlorine was followed indirectly as ClCH=CH
2
(at m/e=62) by
scavenging Cl atoms with BrCH=CH
2
(reaction 5). Following both procedures, the detection
limit for Cl atoms was 9x10
11
molecule cm
-3
.
Reagents
Liquid compounds were purified by trap-to-trap distillation. The chemical used were: He
(Praxair, 99.999%), Cl
2
(Praxair, 99.8%), Br
2
(Fluka, 99.5%), BrCH=CH
2
(Aldrich, 98%),
ClCH=CH
2
(Fluka, 99.5%), HCl (Aldrich, >99%), HFE-7200 (3M Novec, >99%), HFE-7100
(Fluka, 99%), HFE-7000 (3M Novec, >99%), HFE-7500 (3M Novec, >99%).
3. Results
The experimental conditions for four HFEs studied reactions are shown in table 1.
All the kinetic runs were carried out at 1 Torr total pressure in the reactor and under
pseudo-first order conditions with the organic compound in excess over Cl atoms.
Preliminary experiments were conducted in which the reactions between Cl
2
and Br
2
(or
BrCH=CH
2
) with HFEs were evaluated. No reaction was observed within the time used in
the experiments. Homogeneous losses (Cl-self reaction) did not contribute to the observed
temporal profiles because of the low radical concentration (from 0.8x10
11
to 3.0x10
11
molecule cm
-3
).
Contribution of the Atmospheric Chlorine Reactions
to the Degradation of Greenhouse Gases: CFCs Substitutes
333
Heterogeneous wall losses of chlorine atoms were checked in additional experiments at all
the studied temperatures. These experiments were carried out in the absence of organic
compounds, but under similar conditions to those of a kinetic run. In such experiments,
with Cl atoms entering the main tube from the injector and Br
2
(or BrCH=CH
2
) entering
from inlet 3, the formation of BrCl (or ClCH=CH
2
) was observed at different contact times.
The mean value obtained for the wall loss rate constants was k
w
= 8, 6, 8, and 7 s
-1
for HFE-
7200, HFE-7100, HFE-7000, and HFE-7500, respectively.
Experimental conditions HFE-7200 HFE-7100 HFE-7000 HFE-7500
T(K) 234-333 234-315 266-333 253-343
P (Torr) 1
Flow velocity (m s
-1
) 600-850 600-800 700-900 650-950
Reaction time (ms) 0-25 0-45 0-43 0-35
[Cl
2
] (10
11
molecule cm
-3
) 6-25 2-20 5-6 2.5-7
[Br
2
] (10
13
molecule cm
-3
) 0.9-50 0.9-50 2.5-8
[BrCH=CH
2
](10
13
molecule cm
-3
) 3-7
[HFE](10
14
molecule cm
-3
) 0.04-2.5 0.8-7.0 0.15-2.1 0.03-0.45
[Cl] (10
11
molecule cm
-3
) 0.8-1.8 0.8-1.8 2-3 1.1-2
Mixing time for Cl/He (ms) 1.1-0.6
Table 1. Experimental conditions in the kinetic study of HFEs with Cl atoms
For the bimolecular reaction between Cl and HFEs, the integrated rate constant that applies
to our experimental conditions is
t0
Ln Cl Ln Cl – k’ t
(I)
where k’ is the pseudo-first-order kinetic rate constant, k’ = k [HFE] + k
w
. k
w
again,
represents the heterogeneous wall losses of Cl in the injector. Typical pseudo-first-order
decays of Cl (measured as BrCl or ClCH=CH
2
), against time are shown in figure 2 for
reaction (3) and (4). Similar plots are obtained for HFE-7200 and HFE-7100 reactions.
The pseudo first-order constant values, k’, obtained for the slope, were corrected to take into
account the axial and radial diffusion of Cl atoms (Kaufman, 1984) by:
''2
exp exp
'
exp
2
kDkr
k'=k 1+ +
48D
v
(II)
where v is the linear flow velocity of the gas mixture in the reactor (cm s
-1
), r is the radius of
the reactor (cm) and D is the effective diffusion coefficient (cm
2
s
-1
). The effective diffusion
Planet Earth 2011 – Global Warming Challenges and Opportunities for Policy and Practice
334
coefficients of the Cl in He mixture were calculated from the atomic diffusion volumes
(Perry et al., 2001). The values obtained within the temperature range used (234-343K) were
(330-680), (330-615), (415-680), and (380-650) cm
2
s
-1
for HFE-7200, HFE-7100, HFE-7000, and
HFE-7500, respectively. Corrections in k’ from diffusion were less than 20, 10, 5, and 8% for
HFE-7200, HFE-7100, HFE-7000, and HFE-7500, respectively.
(a) (b)
Fig. 2. Typical pseudo first-order decays for Cl for the reaction of a) HFE-7000+Cl at 298K
and 1 Torr: [HFE-7000]=0.66 (□); 0.95 (
); 1.35 (x); 1.85 (); 2.10 (○) x10
14
molecule cm
-3
. b)
HFE-7500+Cl at 298 K and 1 Torr: [HFE-7500]=0.53 (◊); 0.73 (□); 1.42 (
); 2.09(x) x10
13
molecule cm
-3
HFE-7200 HFE-7100 HFE-7000 HFE-7500
T(K) k T (K) k T(K) k T (K) k
234 1.0 ± 0.1 234
1.7 0.7
266
11.7 2.2
253
1.1 0.1
266 1.5 ± 0.1 263
4.6 1.1
273
12.2 2.3
273
1.5 0.1
298 2.1 ± 0.1 273
5.5 0.9
285
13.1 2.2
298
2.2 0.3
315 2.5 ± 0.2 285
7.3 1.5
298
12.4 2.5
307
2.4 0.2
333 3.1 ± 0.4 298
14.3 2.8
315
13.8 2.3
324
2.9 0.3
315
17.6 2.0
333
16.8 2.6
333
3.3 0.4
343
3.9 0.5
Table 2. Summary of the second-order rate constants at different temperatures for HFEs+Cl
reactions. k in units of 10
-12
cm
3
molecule
-1
s
-1
for HFE-7200 and HFE-7500, and of 10
-14
cm
3
molecule
-1
s
-1
for HFE-7100 and HFE-7000. Errors are 2
Contribution of the Atmospheric Chlorine Reactions
to the Degradation of Greenhouse Gases: CFCs Substitutes
335
Fig. 3. Plots of the pseudo-first-order rate constants, k’, against segregated HFEs
concentrations, at 1 Torr. a) HFE-7200+Cl = (▲) 298 K and (□) 234 K; b) HFE-7100+Cl = (▲)
315 K and (□) 263 K; c) HFE-7000+Cl = (▲) 333 K and (□) 266 K; d) HFE-7500+Cl = (▲) 333 K
and (□) 253 K