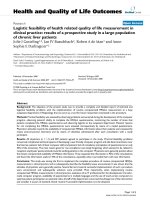
Intravenous Immunoglobulins in Clinical Practice potx
Bạn đang xem bản rút gọn của tài liệu. Xem và tải ngay bản đầy đủ của tài liệu tại đây (4.34 MB, 622 trang )
title : Intravenous Immunoglobulins in Clinical Practice
author : Lee, Martin L.
publisher : Informa Healthcare
isbn10 | asin : 0824798813
print isbn13 : 9780824798819
ebook isbn13 : 9780585157924
language : English
subject Immunoglobulins Therapeutic use, Intravenous therapy,
Immunoglobulins, Intravenous therapeutic use.
publication date : 1997
lcc : RM282.I44I586 1997eb
ddc : 615/.37
subject : Immunoglobulins Therapeutic use, Intravenous therapy,
Immunoglobulins, Intravenous therapeutic use.
Page i
Intravenous Immunoglobulins in Clinical Practice
Edited By
Martin L. Lee
School of Public Health
University of California
Los Angeles, California
Vibeke Strand
Stanford University
San Francisco, California
MARCEL DEKKER, INC.
NEW YORK BASEL HONG KONG
Page ii
Library of Congress Cataloging-in-Publication Data
Intravenous immunoglobulins in clinical practice / edited by Martin L. Lee, Vibeke Strand.
p. cm.
Includes index.
ISBN 0-8247-9881-3 (hardcover : alk. paper)
1. ImmunoglobulinsTherapeutic use. 2. Intravenous therapy. I. Lee, Martin L. II Strand,
Vibeke.
[DNLM: 1. Immunoglobulins, Intravenoustherapeutic use. QW 601 I616 1997]
RM282.I44I586 1997
615'.37dc21
DNLM/DLC
for Library of Congress 97-25515
CIP
The publisher offers discounts on this book when ordered in bulk quantities. For more information, write to Special
Sales/Professional Marketing at the address below.
This book is printed on acid-free paper.
Copyright © 1997 by Marcel Dekker, Inc. All Rights Reserved.
Neither this book nor any part may be reproduced or transmitted in any form or by any means, electronic or mechanical,
including photocopying, microfilming, and recording, or by any information storage and retrieval system, without
permission in writing from the publisher.
MARCEL DEKKER, INC.
270 Madison Avenue, New York, New York 10016
Current printing (last digit):
10 9 8 7 6 5 4 3 2 1
PRINTED IN THE UNITED STATES OF AMERICA
Page iii
PREFACE
In the 1940s Cohn and colleagues developed a relatively straightforward chemical process for fractionating human
blood into many of its significant component proteins, thus enabling the production of the first immunoglobulin
concentrates (although suitable for intramuscular use only). In the following decade, Bruton and others recognized the
genetic basis of various types of primary immunodeficiency syndromes and further characterized them. These two
discoveries allowed for the regular treatment of patients using replacement infusions of human immunoglobulins and
the concomitant improvement in quality of life and, ultimately, survival. Subsequently, specific immunoglobulin
preparations were produced for treatment of or prophylaxis against specific pathogens such as hepatitis B, polio,
tetanus, and pertussis. All of these so-called hyperimmune globulins were administered by the intramuscular route.
It became quite clear that this means of administration was not adequate for both the provider and the patient. Injections
were quite painful; doses were limited in size and frequency; muscle proteases degraded much of the infused immune
globulins; and the remaining protein reached the circulation only after significant delay. Attempts to inject material
directly into the vasculature proved to be dangerous, and occasionally catastrophic, apparently as a result of the IgG
aggregates that formed as part of the fractionation process. Subsequent developments employing first partial enzyme
digestion (using proteases such as pepsin and papain) and then improvements in the fractionation process allowed for
the ultimate production of true intravenous immunoglobulin (IVIG) concentrates.
Since the late 1970s when these concentrates became widely available, their use has grown exponentially. The
serendipitous discovery by Imbach, Barandun, and colleagues in 1980 that IVIG could reverse the autoimmune
thrombocytopenia in a young patient with severe chronic ITP and secondary hypogammaglobulinemia opened another
avenue of applications: the treatment of autoimmune diseases.
Our goal in compiling this volume was to summarize critically the large array of clinical literature available on the use
of IVIG preparations. Indeed, a review of MEDLINE citations since 1980 showed more than 1800 entries. Much of the
work over the past several years has involved controlled clinical trials, putting research in this area on a firm, scientific
footing. This is the focus of our book.
In recent years, studies have shown that IVIG may be useful in treating various primary and secondary
immunodeficiencies. With regard to the latter, successful trials have been conducted in AIDS patients, premature
neonates, individuals with multiple myeloma and chronic lymphocytic leukemia, bone marrow and liver transplantees,
patients after high-risk (for infection) abdominal surgeries, and thermal burn victims.
Page iv
A vast literature has also developed on the prophylaxis and treatment of numerous autoimmune diseases. Although the
mechanisms of action of IVIG are incompletely understood, the range of successful applications is remarkable.
Nonetheless, the number of large-scale controlled studies in this area remains small. This is changing, particularly with
the recent publication by van der Meché and colleagues of a successful trial of IVIG in the treatment of acute Guillain-
Barré syndrome.
In this book, many of the leading authorities on clinical applications of IVIG in their respective fields of medical
research discuss work done to date. We sincerely believe that the reviews contained herein are comprehensive, but
recognize the explosive growth of this literature. This volume will serve as a good overview for both clinician and
researcher wishing to survey current information available on the clinical use of IVIG.
We are grateful to so many people for their invaluable assistance and support with this project. We want to offer our
sincere gratitude to the contributors to this book. Their efforts clearly demonstrated a commitment to furthering
knowledge about this important therapeutic agent.
We also wish to express our appreciation to Ms. Shirley Sutjiadi for providing invaluable administrative assistance in
organizing this volume, and Dr. Ed Gomperts and Dr. Gordon Bray for providing many of the resources needed to
complete our effort.
And, of course, we owe our families a large debt of gratitude. M. L. would like to thank his wife, Marilyn, and his two
sons, Eliot and Danny, for their love and support. V. S. appreciates all the encouragement and understanding her
husband, Jack, provided.
MARTIN L. LEE
VIBEKE STRAND
Page v
CONTENTS
Preface iii
Contributors ix
I. Overview
1. Pharmacokinetics of Intravenous Immunoglobulin Preparations
Andreas Morell
1
2. Pharmacoeconomics of Intravenous Immunoglobulin
Martin L. Lee and Vibeke Strand
19
3. Proposed Mechanisms for the Efficacy of Intravenous Immunoglobulin Treatment
Vibeke Strand
23
4. Production and Properties of Intravenous Immunogloblins
John A. Hooper
37
5. Nonviral Side Effects of Intravenous Immunoglobulins
Mario Dicato, C. Duhem, and F. Ries
57
6. Viral Safety of IVIG
Peng Lee Yap
67
7. Alternative Methods for the Administration of Intravenous Immunoglobulins
Martin L. Lee
107
II. Infectious Disease Applications
8. IVIG in Bone Marrow Transplantation
Maurice J. Wolin and Robert Peter Gale
113
9. Use of Intravenous Immunoglobulins for the Prevention and Treatment of Viral Infections in Solid Organ
Transplantation
Jeffrey A. DesJardin and David R. Snydman
119
Page vi
10. Intravenous Immunoglobulin Use in the Newborn Infant: Treatment and Prevention of Infection
Rajam S. Ramamurthy
135
11. Use of Intravenous Immunoglobulins in High-Risk Surgical Procedures and in Posttrauma Patients
Giorgio Zanetti and Michel-Pierre Glauser
151
12. Intravenous Gammaglobulin Regimen for HIV-Infected Children: Infection Prophylaxis and
Immunomodulation
Arye Rubinstein
159
13. Use of Intravenous Immune Globulin in Adults with HIV Disease
David J. Rechtman
167
14. Treatment of Primary Immunodeficiency Diseases with Gammaglobulin
Richard I. Schiff
175
15. Intravenous Immunoglobulin Treatment for IgG Subclass Deficiency
Thomas F. Smith
193
16. Prevention of Infections in B-Cell Lymphoproliferative Diseases
Helen Griffiths and Helen Chapel
203
17. Etiology and Prevention of Infection Following Thermal Injury
Khan Z. Shirani, George M. Vaughan, Albert T. McManus, Arthur D. Mason, Jr., and Basil A. Pruitt, Jr.
225
18. Prevention and Treatment of Viral Infection
Martha M. Eibl and Hermann M. Wolf
243
19. Intravenous Immunoglobulin Therapy of Neonates with Nonpolio Enteroviral Infections
Harry L. Keyserling
257
20. Treatment of Chronic Fatigue Syndrome
Andrew R. Lloyd and Denis Wakefield
267
III. Autoimmune Disease Applications: Pediatric
21. Intravenous Gammaglobulin Therapy for Autoimmune Thrombocytopenic Purpura, Neutropenia, and
Hemolytic Anemia
James B. Bussel
275
Page vii
22. Use of IVIG in Kawasaki Syndrome
Marian E. Melish
293
23. Juvenile Rheumatoid Arthritis
Thomas A. Griffin and Edward H. Giannini
309
24. Intravenously Administered Gammaglobulin for the Prevention or Modulation of Insulin-Dependent
Diabetes Mellitus
John M Dwyer and Stephen Colagiuri
317
IV. Autoimmune Disease Applications: Adult
25. Advances in the Treatment of Alloimmune-Mediated Platelet Disorders with Intravenous Immunoglobulin
Thomas S. Kickler
327
26. Guillain-Barré Syndrome
Frans G. A. van der Meché and Pieter A. van Doorn
337
27. Chronic Inflammatory Demyelinating Polyneuropathy
Pieter A. van Doorn and Frans G. A. van der Meché
349
28. Intravenous Immunoglobulin in the Management of Myasthenia Gravis
David Grob
363
29. Multiple Sclerosis
Anat Achiron
381
30. Polymyositis/Dermatomyositis
Lori B. Tucker and Earl D. Silverman
399
31. Use of Intravenous Immunoglobulin in Therapy of Rheumatoid Arthritis
David E. Yocum
409
32. Treatment of Systemic Lupus Erythematosus with Pooled Human Intravenous Immunoglobulin
Stanley C. Jordan
415
33. Intravenous Immunoglobulin Therapy of Systemic Necrotizing Vasculitis
Leonard H. Calabrese
425
34. Lambert-Eaton Myasthenic Syndrome
John Newsom-Davis
431
Page viii
35. Intravenous Gammaglobulin in the Treatment of Recurrent Pregnancy Loss
Ann L. Parke
439
36. Intravenous Immunoglobulin and Other Autoimmune Diseases
Martin L. Lee
447
37. Intravenous Immunoglobulin Therapy in Idiopathic Inflammatory Bowel Diseases
Douglas S. Levine
451
V. Hyperimmunoglobulins
38. Development of Hyperimmune Immunoglobulins
William J. Landsperger and Roger Lundblad
467
Index 503
Page ix
CONTRIBUTORS
Anat Achiron, MD., Ph.D. Director, Multiple Sclerosis Center, Sheba Medical Center, Tel-Hashomer, Israel
James B. Bussel, M.D. Associate Professor, Department of Pediatrics, Division of Hematology/Oncology, The New
York Hospital-Cornell Medical Center, New York, New York
Leonard H. Calabrese, D.O. Vice Chairman and Head of Clinical Immunology, Department of Rheumatic and
Immunologic Disease, Cleveland Clinic Foundation, Cleveland, Ohio
Helen Chapel, M.D., M.R.C.P., F.R.C.Path. Consultant Immunologist and Senior Clinical Lecturer, Department of
Immunology, Oxford Radcliffe Hospital, Oxford, England
Stephen Colagiuri, M.D. The University of New South Wales, Sydney, Australia
Mario Dicato, M.D. Central Hospital of Luxembourg, Luxembourg, Belgium
Jeffrey A. DesJardin, M.D. Department of Geographic Medicine and Infectious Diseases, New England Medical Center
and Tufts University School of Medicine, Boston, Massachusetts
C. Duhem, M.D. Central Hospital of Luxembourg, Luxembourg, Belgium
John M Dwyer, M.D., B.S., F.R.A.C.P., Ph.D. Professor, Department of Medicine, The University of New South Wales,
Sydney, Australia
Martha M. Eibl, M.D. Professor, Institute of Immunology, University of Vienna, Vienna, Austria
Robert Peter Gale, M.D., Ph.D., F.A.C.P. Corporate Director, Blood Cell and Bone Marrow Transplantation, Salick
Health Care, Inc., Los Angeles, California
Edward H. Giannini, M.Sc. Dr. P.H. Professor, William S. Rowe Division of Rheumatology, Department of Pediatrics,
Children's Hospital Medical Center, University of Cincinnati College of Medicine, Cincinnati, Ohio
Page x
Michel-Pierre Glauser, M.D. Professor, Division of Infectious Diseases, Department of Medicine, University Hospital,
Lausanne, Switzerland
Thomas A. Griffin, M.D., Ph.D. William S. Rowe Division of Rheumatology, Children's Hospital Medical Center,
University of Cincinnati College of Medicine, Cincinnati, Ohio
Helen Griffiths, M.D., F.R.C.Path. Associate Specialist, Department of Immunology, Oxford Radcliffe Hospital,
Oxford, England
David Grob, M.D. Director Emeritus, Department of Medicine, Maimonides Medical Center, and Professor, State
University of New York Health Science Center, Brooklyn, New York
John A. Hooper, Ph.D. President, BioCatalyst Consultants, Liberty, Missouri
Stanley C. Jordan, M.D. Director, Transplant Immunology, Department of Pediatrics, Cedars-Sinai Medical Center, Los
Angeles, California
Harry L. Keyserling, M.D. Associate Professor, Department of Pediatrics, Emory University School of Medicine,
Atlanta, Georgia
Thomas S. Kickler, M.D. Professor of Pathology, Medicine, and Oncology, Johns Hopkins University School of
Medicine, Baltimore, Maryland
William J. Landsperger, Ph.D. Senior Research Scientist, Department of Science and Technology, Hyland Division
Research and Development, Baxter Healthcare Corporation, Duarte, California
Martin L. Lee, Ph.D., C.Stat. Lecturer, School of Public Health, University of California, Los Angeles, California.
Douglas S. Levine, M.D. Associate Professor, Department of Medicine, University of Washington, Seattle, Washington
Andrew R. Lloyd, M.B.B.S, M.D., F.R.A.C.P. Associate Professor, Department of Infectious Diseases, Prince Henry
Hospital, Sydney, Australia.
Roger Lundblad, Ph.D. Department of Science and Technology, Hyland Division Research and Development, Baxter
Healthcare Corporation, Duarte, California
Arthur D. Mason, Jr., M.D. U.S. Army Institute of Surgical Research, Fort Sam Houston, Texas
Albert T. McManus, Ph.D. Acting Chief, Laboratory Division, U.S. Army Institute of Surgical Research, Fort Sam
Houston, Texas
Page xi
Marian E. Melish, M.D. University of Hawaii and Kapiolani Medical Center for Women and Children, Honolulu,
Hawaii
Andreas Morell, M.D. Chief Medical Officer, ZLB Central Laboratory, Blood Transfusion Service, Swiss Red Cross,
Bern, Switzerland
John Newsom-Davis, M.A., M.D., F.R.C.P., F.R.A. Professor, Department of Clinical Neurology, University of Oxford,
Oxford, England
Ann L. Parke, M.D. Professor, Department of Medicine, University of Connecticut Health Center, Farmington,
Connecticut
Basil A. Pruitt, Jr., M.D., F.A.C.S. Clinical Professor, Department of Surgery, University of Texas Health Science
Center, San Antonio, Texas
Rajam S. Ramamurthy, M.D. Professor, Department of Pediatrics, Division of Neonatology, University of Texas Health
Science Center, San Antonio, Texas
David J. Rechtman, M.D. President, PharmaMedical Consultants International, Missoula, Montana
F. Ries, M.D. Central Hospital of Luxembourg, Luxembourg, Belgium
Arye Rubinstein, M.D. Professor of Pediatrics, Mibrobiology, and Immunology, Department of Pediatrics, Albert
Einstein College of Medicine, Bronx, New York
Richard I. Schiff, M.D., Ph.D. Director, Clinical Immunology, Miami Children's Hospital, Miami, Florida
Khan Z. Shirani, M.D., Col mc. Chief, Clinical Division, U.S. Army Institute of Surgical Research, Fort Sam Houston,
Texas
Earl D. Silverman, M.D., F.R.C.P. (C) Associate Professor of Pediatrics and Immunology, Department of Pediatric
Rheumatology, The Hospital for Sick Children, University of Toronto, Toronto, Ontario, Canada
Thomas F. Smith, M.D. Professor, Department of Pediatrics, Washington University School of Medicine, St. Louis
Children's Hospital, St. Louis, Missouri
David R. Snydman, M.D. Director, Clinical Microbiology, New England Medical Center, and Professor of Medicine
and Pathology, Tufts University School of Medicine, Boston, Massachusetts.
Vibeke Strand, M.D. Clinical Associate Professor of Medicine, Division of Immunology, Stanford University, San
Francisco, California
Page xii
Lori B. Tucker, M.D. Assistant Professor of Pediatrics, Division of Pediatric Rheumatology, New England Medical
Center, Boston, Massachusetts
Frans G.A. van der Meché, M.D., Ph.D. Professor, Department of Neurology, University Hospital Rotterdam,
Rotterdam, The Netherlands
Pieter A. van Doorn, M.D., Ph.D. Department of Neurology, University Hospital Rotterdam, Rotterdam, The
Netherlands
George M. Vaughan, M.D., Col mc. Chief, Internal Medicine Branch, U.S. Army Institute of Surgical Research, Fort
Sam Houston, Texas
Denis Wakefield, M.D. Department of Immunology, Prince Henry Hospital, Sydney, Australia
Hermann M. Wolf, M.D. Institute of Immunology, University of Vienna, Vienna, Austria
Maurice J. Wolin, M.D. Medical Director, Chiron Therapeutics, Emeryville, California
Peng Lee Yap, B.Sc., M.B.Ch.B., Ph.D., F.R.C.Path., F.R.C.P.E. Consultant in Blood Transfusion and Immunology,
Edinburgh & S.E. Scotland Blood Transfusion Service, Edinburgh, Scotland
David E. Yocum, M.D. Director, Arizona Arthritis Center, Arizona Health Sciences Center, University of Arizona,
Tucson, Arizona
Giorgio Zanetti, M.D. Division of Infectious Diseases, Department of Internal Medicine, University Hospital, Lausanne,
Switzerland
Page 1
1
Pharmacokinetics of Intravenous Immunoglobulin Preparations
Andreas Morell
ZLB Central Laboratory, Blood Transfusion Service, Swiss Red Cross,
Bern, Switzerland
Introduction
Much of our current understanding of the pharmacokinetics of IgG has emerged from research in the late 1960s which
was mainly devoted to the assessment of normal metabolic properties of IgG in humans (1). These early studies were
done with IgG isolated from human plasma, which was radiolabeled with iodine isotopes, and given intravenously as
tracer doses. Later, pharmacokinetic studies were performed with commercial IVIG preparations in order to characterize
their intact or modified IgG molecules. Basically, three approaches can be used to generate pharmacokinetic data of
IVIG preparations:
1. In the 1970s, some studies were done with radiolabeled IgG of IVIG preparations. Today, this approach is no longer
feasible, mainly for ethical considerations.
2. Pharmacokinetics of most IVIG preparations were obtained by analysis of the plasma disappearance curves after
infusion in patients with congenital humoral immunodeficiencies.
3. A more sophisticated approach consisted in the analysis of the plasma disappearance of specific IgG antibodies
present in the infused IVIG but not produced by the subjects participating in the study. In normal individuals,
pharmacokinetics obtained by this method may be closest to a hypothetical true in vivo behavior of IVIG.
The purpose of this article is to review available information on the pharmacokinetics of commercial IVIG preparations
in immunologically normal subjects and in patients.
Analysis of Pharmacokinetic Data
Tracer studies with radioiodinated plasma proteins indicated that their catabolism followed multicompartmental first-
order kinetics (1). According to Nosslin, the protein is distributed in an intravascular pool and in one or more
extravascular pools (2). After equilibration between intravascular and extravascular body compartments, the labeled
protein is eliminated from the plasma at a constant rate, as illustrated in Figure 1 by a
Page 2
Figure 1
Two-compartment model consisting of an intravascular plasma
pool (P) and an extravascular pool (E) representing the sum of all
extravascular pools. The exchange flow between pools have rate
constants K1 and K2. The catabolic rate constant is designated as
K3 (see Refs. 1,2).
hypothetical two-compartment model consisting of a plasma pool and a sum of several extravascular pools.
Most methods for data analysis were derived from the plasma radioactivity curve and were based on the general
assumptions that synthesis and catabolism took place in a compartment in close contact with the intravascular space,
that the study subjects were in steady state concerning IgG metabolism, and that metabolism of the labeled protein was
identical with that of the native unlabeled protein (1). Figure 2a shows a semilogarithmic plot of the time-dependent
decline of 125I-labeled IgG representing the disappearance of the tracer from the plasma in a normal subject. Graphical
or mathematical methods allow estimations of the distribution in intra- and extravascular pools, of the fraction that is
catabolized daily (fractional catabolic rate, FCR) and of the half-life (T1/2). If plasma IgG concentrations and the
plasma volume are known, total circulating and total body IgG pools as well as the rate of daily IgG synthesis can be
determined. Table 1 summarizes the normal values for IgG and IgG subclass metabolism in humans which were
obtained in tracer studies under steady-state conditions (3,4).
Pharmacokinetic models for the analysis of IVIG preparations follow the same rules. Figure 2b shows an idealized IgG
plasma disappearance curve in an agammaglobulinemic patient after IVIG infusion, where logarithms of plasma IgG
concentrations are plotted against the post infusion time. Identical graphs are obtained if values on the ordinate are
expressed as units of antibodies, as fractions of the infused IVIG, or as percentage of the peak IgG or antibody
concentrations. From these experimental curves, pharmacokinetic parameters are calculated using mathematical models
or by graphical analysis of the curves (5,6).
Page 3
Figure 2
Idealized semilogarithmic plots of plasma disappearance curves. (a)
Time-dependent decline of 125I-labeled IgG in a normal person
(tracer study). The solid circles represent measured values expressed
as fraction of the injected dose. The α phase is further subdivided
by curve peeling, as indicated by open circles. The β phase is
characterized by the slope -b1. Slopes, extrapolations, and intercepts
are explained in the text (see Ref. 1). (b) Time-dependent disappearance
of infused IgG in a patient with congenital humoral immunodeficiency
after IVIG infusion. Open circles represent IgG plasma concentrations
expressed as a fraction of peak levels. Extrapolation of the final
slope -b1 to the ordinate and intercept C0 are explained in the text.
Both the α and β phases may be influenced by intrinsic IgG synthesis
of the patient and by extrinsic carryover IgG from previous IVIG
infusions (see Refs. 5,24).
Page 4
Table 1 Pharmacokinetics of Normal IgG in Normal Individuals (mean values ± 1 SD)
Total IgG IgG1 IgG2 IgG3 IgG4
Half-life (days) 23 ± 4 21 ± 5 20 ± 2 7 ± 1 21 ± 3
Fraction (%) of intravascular pool catabolized daily (FCR)
7 ± 2 8 ± 2 7 ± 0.3 17 ± 1 7 ± 1
Distribution (% intravascular) 45 ± 5
Pool sizes (g/kg)
intravascular pool
0.49 ± 0.12
total body pool
1.09 ± 0.26
Synthetic rate (mg/kg/day) 34 ± 11
Sources: IgG data were derived from Waldmann and Terry (3); IgG subclass data from Ref. 4.
In both parts of Figure 2, the initial phase (α phase) of the curves is characterized by a rapid decline of the infused material
in the plasma. This decrease of the tracer or of the administered IVIG is rather complex and corresponds to the combined
influences of distribution in the body and catabolism. After approximately 57 days this phase is followed by the final phase
(β phase), which is a straight line in the semilogarithmic plot with a slope designated -b1. Extrapolation of this line to the
ordinate determines an intercept C1 (Fig. 2a). By subtracting the extrapolated line from the original curve (curve peeling),
the α phase can be characterized by a new curve with a slope -b2 and an intercept C2. As a result, the original plasma
curve is described by the sum of two exponentials:
where C is the concentration of IVIG in the plasma, C1 and C2 are the intercepts, and -b1 and -b2 are the slopes of the two
phases. Sometimes, the α phase can be further resolved by curve peeling, and a third exponential is obtained. However, in
many studies the experimental data do not allow a resolution of the plasma curve, and pharmacokinetic calculations are
based on the β phase:
C = C0 e-kt
where the intercept C0 represents the IVIG concentration in the plasma if the distribution had been instantaneous, and k is
the slope of the β phase, designated as elimination constant (Fig. 2b). The half-life (T1/2), defined as the time required for
half of the IVIG to be catabolized, is proportional to the elimination constant k.
It should be noted that the elimination constant obtained by this method gives the catabolic rate as a fraction of the whole
body, whereas if the α phase is included in the calculations, the resulting elimination constant describes the fractional
catabolic rate as the fraction of the intravascular pool that is catabolized daily (1).
In general, kinetics of the initial α phase are important, if IVIG is considered for treatment of acute infections, since IgG
and antibody levels reached in the first few hours or days after infusion may be critical. However, data on this phase are
scarce. On the
Page 5
other hand, kinetics of the terminal β phase used for T1/2 calculations are decisive when a prolonged replacement therapy
is envisaged, as in patients with agammaglobulinemia. In fact, the T1/2 was determined for all IVIG preparations. Other
pharmacokinetic parameters known for some IVIGs are the volume of distribution in the body and the total clearancei.e.,
the volume of plasma cleared of IVIG per unit of time. Clearance data are considered helpful since they characterize the
catabolic rate of IVIG and are independent of metabolic mechanisms and compartmental distribution (5). However, since
different mathematical models were used for these calculations, a comparison of the values published for IVIG
preparations is somewhat problematic.
Pharmacokinetics of IVIG Preparations in Normal Subjects
Pharmacokinetics of some IVIG preparations performed in healthy subjects were published in the literature whereas
information on others was provided by manufacturers in package inserts or promotional printed matter. In most studies, the
catabolism of specific IgG antibodies rather than that of total IVIG was analyzed. This approach allowed an observation
period of up to several weeks until antibody levels had decreased to preinfusion values. Table 2 summarizes available data
(710). The T1/2 values of some antibody specificities in IVIG were comparable to the T1/2 of normal IgG. Possible
reasons for the relatively short T1/2 of anti-CMV are discussed below. According to tracer studies and product information
material, the distribution of IVIG preparations in the body was in the same range as that observed with normal IgG, with an
intravascular portion of 4157% (7; product information provided by manufacturers).
For two preparations apparent distribution volumes of 0.09 and 0.13 L/kg were calculated (9,10). The total clearance of
anti-HBs in IVIG was calculated to be 0.14 ml per min or approximately 2.9 ml/kg/day (9). In general, pharmacokinetic
parameters of these IVIG preparations appear to be close to values obtained by IgG tracer studies in normal subjects (1).
However, pharmacokinetics of enzymatically modified IVIG preparations were clearly different. These preparations
consisted either of F(ab')2 fragments after pepsin
Table 2 Half-Lives of IVIG and IgG Antibodies in Normal Individuals (range of reported values)
IVIG and antibodies T1/2 (days) References
Total IVIG 1424
Product information provided by manufacturers (7)
Antibodies to:
hepatitis B surface antigen (HBsAg)
1626
Product information provided by manufacturers
(810)
cytomegalovirus (CMV)
912
Product information provided by manufacturers
tetanus toxoid
1234
Product information provided by manufacturers (8)
S. pneumoniae type 1 1435
Product information provided by manufacturers
Page 6
digestion (11), or of a mixture of Fab and Fc fragments and intact IgG molecules after plasmin treatment of IgG (12,13).
The half-life of the F(ab')2 preparation was found to be 2 days, and the total clearance was 3.5 ml/min, or 72 ml/kg/day.
The volume of distribution after equilibration of this preparation suggested that approximately 60% of the F(ab')2
fragments were present in the extravascular space. In the plasmin-treated preparation the Fab fragments were cleared at
a fast rate, whereas the Fc fragments had a T1/2 between 6 and 9.5 days. The plasmin-resistant portion, approximately
one-third of the preparation, consisted of intact IgG molecules with a half-life of 22 days and a distribution in the body
comparable to that of normal IgG (50% intravascular). These studies indicate that molecular sites on the Fc portion are
important for the control of IgG catabolism (14).
Pharmacokinetics of IVIG in Patients with Congenital Humoral Immunodeficiencies
Patients with congenital agamma- or hypogammaglobulinemia represent a prime indication for replacement therapy
with IVIG preparations. Due to the lack of intrinsic immunoglobulin production these patients have low IgG and
antibody serum levels and are thus ideal subjects for pharmacokinetic studies. As a corollary, all available IVIG
preparations have been investigated in such patients. Results were either published or provided by the manufacturers in
promotional printed material.
Typical studies included eight or more patients with X-linked agammaglobulinemia or common variable
immunodeficiency syndrome who were already on replacement therapy with IVIG preparations. If the previously
administered IVIG differed from the study preparation, a washout period had to be permitted before the onset of the
trial. The study dose was in most instances 0.4 g/kg/month. This dosage corresponding to somewhat less than the
normal intravascular IgG pool (Table 1) increased the IgG serum concentration from the trough level measured before
to a peak level of more than twice the preinfusion value approximately 15 min after infusion. Serum samples were
collected usually at 2- to 3-day intervals until 4 weeks after infusion and evaluated for IgG and antibody concentrations.
Some of the data obtained with three IVIG preparations are given in Table 3 (1521). Peak levels obtained with this
dosage exceeded preinfusion serum IgG levels by approximately 710 g/L. Figure 2b demonstrates the decrease of the
IgG concentration in an immunodeficient patient after IVIG infusion. It was observed that in this situation the α phase
of the curve was relatively flat when compared with IgG tracer decay curves. From extrapolation of the final slope to
the ordinate (intercept C0 in Fig. 2b), it appears that approximately 70% of the IVIG was available in the intravascular
space which differed from the 4060% observed in normal individuals.
Table 3 shows that at day 7, when the infused material had equilibrated between intra- and extravascular spaces, the
serum IgG levels were still increased, whereas at day 28, they were close to preinfusion values. Thus, under these
conditions there was no apparent accumulation of IgG in the body. Analysis of the final β phase of experimental curves
yielded half-life values which were prolonged when compared with previously discussed data. This can be explained by
the important relationship between IgG serum concentration and the catabolic rate: radioactive tracer studies have
shown that in agammaglobulinemic patients the T1/2 of IgG was greatly prolonged, whereas in myeloma or other
patients with high IgG levels, it was shortened (1,3,4).
Page 7
Table 3 In Vivo Behavior of IVIG Preparations After Infusion of 0.4 g/kg Body Weight in Patients with
Congenital Humoral Immunodeficiency
IVIG preparation
Gammagard Sandoglobulin Gamimune-N
IgG plasma concentrations (g/L):
preinfusion
3.90 5.41 6.37
15 min after infusion (peak)
13.72 12.32 14.89
day 7
6.93 8.62 10.80a
day 28
3.79 5.78 6.60a
Half-life (days) 26 32 35
aExptrapolated from Figure 1 in Ref. 15. Data are taken from Refs. 1521.
Half-lives of most other IVIG preparations determined in immunodeficient patients varied also between 26 and 35 days
according to product information provided by manufacturers and the literature (5,22,23). Of two IVIG preparations, half-lives
of IgG subclasses were determined: the T1/2 of IgG1, IgG2, and IgG4 were approximately 30 days as observed for total IgG,
whereas the T1/2 of IgG3 was approximately 20 days (1821). Schiff and colleagues (5,16,23) calculated the total clearance of
IVIG and IgG antibodies in immunodeficient patients. Values for different preparations were between 1.6 and 2.4 ml/kg/day.
Pharmacokinetics of antibodies directed against bacterial and viral antigens in immunodeficient patients showed a variable
pattern (Table 4). Half-lives of antibodies against Streptococcus pneumoniae capsular polysaccharides, the core
lipopolysaccha-
Table 4 Half-Life of IgG Antibodies in Patients with Congenital Humoral
Immunodeficiencies After IVIG Infusions (mean values or ranges)
Antibody specificity T1/2 (days) IVIG preparation
Bacterial polysaccharides
S. pneumoniae,
types 1, 6A, 7, 3
2632 Gammagard, Gamimune-
N, Sandoglobulin
Core lipopolysaccharide,
S. minnesota,
Re 595 mutant
30 Gammagard
S. pyogenes, group A
36 Sandoglobulin
H. influenzae, type B
23 Sandoglobulin
Tetanus toxoid 2127 Gammagard, Gamimune-
N, Iveegam, Intraglobin
Viral antigens
Hepatitis B surface antigen
32 Sandoglobulin
Cytomegalovirus
32 Sandoglobulin
Sources: Data are taken from product information provided by manufacturers and from
Refs. 5,16,18,19,2123.
Page 8
ride of gram-negative bacteria, and streptococcal group A carbohydrate were between 26 and 36 days
(5,16,18,19,2123). Antibodies against Haemophilus influenzae type b polysaccharide had a somewhat shorter survival
of 23 days. Interestingly, the T1/2 of IgG2 antibodies against H. influenzae was 33 days, whereas IgG1 antibodies of
this specificity had a much shorter half-life10 days (Fig. 3). This could mean that consumption of the IgG1 antibody
isotype was selectively increased in these chronically infected patients. The T1/2 values of antibodies against tetanus
toxoid were between 21 and 27 days; those of antibodies against viral antigens were 32 days.
There are certain problems inherent in these investigations that need to be addressed. First of all, results may be
influenced by a carryover effect of extrinsic IgG from previous IVIG infusions (Fig. 2b). This material is catabolized at
the same rate as the study IVIG but its presence in the body changes the α phase of the infused IVIG (5,24). In addition,
almost all patients with humoral immunodeficiency have some residual intrinsic IgG synthesis which affects serum IgG
concentrations during the study period and alters the final slope of the IgG decay curve. It may in fact be partially
responsible for the observed prolongation of the T1/2 in these patients (5).
How do pharmacokinetics translate into dosage recommendations for patients? As already stated, 4 weeks after an IVIG
infusion of 0.4 g/kg body weight, postinfusion IgG levels have returned to preinfusion values, indicating that 100% of
the infused dose was catabolized. As a consequence, smaller doses and/or longer intervals between infusions will
decrease, whereas higher doses and shorter intervals will raise trough IgG levels. After a series of high-dose infusions, a
new equilibrium will be reached according to the observation that IgG catabolism is concentration-dependent, as
demonstrated in
Figure 3
Time-dependent decline of IgG2 and IgG1 antibodies against H.
influenzae type b polysaccharide in a patient with congenital humoral
immunodeficiency following IVIG infusion of 0.4 g/kg body weight. Note
rapid disappearance of IgG1 antibodies (A. Morell, unpublished results).
Page 9
Figure 4
Serum IgG levels in a patient with congenital humoral immunodeficiency
before (trough levels) and immediately after (peak levels) IVIG infusions. The
figure demonstrates the influence of low- and high-dosage regimens:
the accumulation phase induced by higher dosage (infusion 4) is followed
by a new equilibrium or maintenance phase after infusion 8 (see Refs.
2426).
Figure 4 (2426). As there exists no fixed IgG serum concentration ensuring absence of acute infections in
immunodeficient patients, IVIG dosage has to be individualized (26,27). Administration of 0.4 g/kg every 34 weeks is
usually sufficient to keep trough IgG levels above 5 g/L, which is often considered a critical threshold. However, some
patients may require higher doses (27).
Pharmacokinetics of IVIG in Neonates and Infants.
Due to an active transplacental transport mechanism operating in the last 2 months of gestation, term-born neonates
have slightly higher IgG serum levels than their mothers (28). During the first weeks of life, maternal IgG is known to
be catabolized by the babies with an apparent T1/2 of 30 days, and IgG serum concentrations decline to a nadir reached
at approximately 3 months of age (29). Premature neonates have low serum IgG levels depending on their gestational
age at birth. This is considered a risk factor for severe infections, i.e., neonatal sepsis, and represents the rationale for
IVIG prophylaxis and treatment (30). Several clinical trials have provided information on the in vivo behavior of single
or repeated infusions of IVIG. A summary of some relevant studies is provided in Table 5 (3140).
In a prophylactic trial, Chirico and co-workers treated high-risk preterm neonates with weekly IVIG doses of 0.5 g/kg
body weight (31). The resulting increase in serum IgG levels was most pronounced in babies weighing less than 1500 g.
Levels of