Handbook of HEATING, VENTILATION, and AIR CONDITIONING pdf
Bạn đang xem bản rút gọn của tài liệu. Xem và tải ngay bản đầy đủ của tài liệu tại đây (33.52 MB, 667 trang )
Handbook
of
HEATING,
VENTILATION,
and
AIR CONDITIONING
© 2001 by CRC Press LLC
The Mechanical Engineering Handbook Series
Series Editor
Frank Kreith
Consulting Engineer
Published Titles
Handbook of Heating, Ventilation, and Air Conditioning
Jan F. Kreider
Computational Intelligence in Manufacturing Handbook
Jun Wang and Andrew Kusiak
The CRC Handbook of Mechanical Engineering
Frank Kreith
The CRC Handbook of Thermal Engineering
Frank Kreith
The Handbook of Fluid Dynamics
Richard W. Johnson
Forthcoming Titles
Fuel Cell Technology Handbook
Gregor Hoogers
Air Pollution Control Technology Handbook
Karl B. Schnelle and Charles A. Brown
Handbook of Mechanical Engineering, Second Edition
Frank Kreith and Massimo Capobianchi
Hazardous and Radioactive Waste Treatment Technologies Handbook
Chang H. Oh
Handbook of Non-Destructive Testing and Evaluation Engineering
James Tulenko and David Hintenlang
Inverse Engineering Handbook
Keith A. Woodbury
MEMS Handbook
Mohamed Gad-el-Hak
© 2001 by CRC Press LLC
Edited by
Jan F. Kreider, Ph.D., P.E.
Handbook
of
HEATING,
VENTILATION,
and
AIR CONDITIONING
Boca Raton London New York Washington, D.C.
CRC Press
© 2001 by CRC Press LLC
This book contains information obtained from authentic and highly regarded sources. Reprinted material is quoted with
permission, and sources are indicated. A wide variety of references are listed. Reasonable efforts have been made to publish
reliable data and information, but the author and the publisher cannot assume responsibility for the validity of all materials
or for the consequences of their use.
Neither this book nor any part may be reproduced or transmitted in any form or by any means, electronic or mechanical,
including photocopying, microfilming, and recording, or by any information storage or retrieval system, without prior
permission in writing from the publisher.
All rights reserved. Authorization to photocopy items for internal or personal use, or the personal or internal use of specific
clients, may be granted by CRC Press LLC, provided that $.50 per page photocopied is paid directly to Copyright clearance
Center, 222 Rosewood Drive, Danvers, MA 01923 USA. The fee code for users of the Transactional Reporting Service is
ISBN 0-8493-9584-4/01/$0.00+$.50. The fee is subject to change without notice. For organizations that have been granted
a photocopy license by the CCC, a separate system of payment has been arranged.
The consent of CRC Press LLC does not extend to copying for general distribution, for promotion, for creating new works,
or for resale. Specific permission must be obtained in writing from CRC Press LLC for such copying.
Direct all inquiries to CRC Press LLC, 2000 N.W. Corporate Blvd., Boca Raton, Florida 33431.
Trademark Notice:
Product or corporate names may be trademarks or registered trademarks, and are used only for iden-
tification and explanation, without intent to infringe.
Credits:
Figures 7.1.1 and 7.1.2 — With permission from ASHRAE.
© 2001 by CRC Press LLC
No claim to original U.S. Government works
International Standard Book Number 0-8493-9584-4
Library of Congress Card Number 00-064673
Printed in the United States of America 1 2 3 4 5 6 7 8 9 0
Printed on acid-free paper
Library of Congress Cataloging-in-Publication Data
Handbook of heating, ventilation, and air conditioning / edited by Jan F. Kreider.
p. cm.
Includes bibliographical references and index.
ISBN 0-8493-9584-4 (alk. paper)
1. Heating—Handbooks, manuals, etc. 2. Ventilation—Handbooks, manuals, etc. 3. Air
conditioning—Handbooks, manuals, etc. I. Title.
TH7225 .K74 2000
697—dc21 00-064673
CIP
Dedication
To the HVAC engineers of the 21
st
century who will set new standards for efficient and sophisticated
design of our buildings.
© 2001 by CRC Press LLC
Preface
During the past 20 years, design and operation of the comfort systems for buildings have been transformed
because of energy conservation imperatives, the use of computer-based design aids, and major advances
in intelligent management systems for buildings. In the 1970s, rules of thumb were widely used by
designers. Today, a strong analytical basis for the design synthesis process is standard procedure. This
handbook describes the latest methods for design and operation of new and existing buildings. In addition,
the principles of life cycle economics are used routinely in design selections and tradeoffs. The information
in this handbook is presented in a practical way that building systems engineers will find useful.
The book is divided into eight sections:
1. Introduction to the buildings sector
2. Fundamentals
3. Economic aspects of buildings
4. HVAC equipment and systems
5. Controls
6. HVAC design calculations
7. Operation and maintenance
8. Appendices
Because of ongoing and rapid change in the HVAC industry, new material will be developed prior to
the standard handbook revision cycle. By link to the CRC Web site, the author will be periodically posting
new material that owners of the handbook can access.
Jan F. Kreider, Ph.D., P.E.
Boulder, Colorado
© 2001 by CRC Press LLC
Editor
Jan F. Kreider, Ph.D., P.E.
is Professor of Engineering and Foun-
ding Director of the University of Colorado’s (CU) Joint Center for Energy
Management. He is co-founder of the Building Systems Program at CU
and has written ten books on building systems, alternative energy, and
other energy related topics, in addition to more than 200 technical papers.
For ten years he was a technical editor of the ASME Transactions.
During the past decade Dr. Kreider has directed more than $10,000,000
in energy-related research and development. His work on thermal analysis
of buildings, building performance monitoring, building diagnostics, and
renewable energy-research is known all over the world. Among his major
accomplishments with his colleagues are the first applications of neural
networks to building control, energy management and systems identifica-
tion, and of applied artificial intelligence approaches for building design
and operation. He also has worked for many years to involve women in
the graduate program that he founded. More than 20 women have grad-
uated with advanced degrees in his program.
Dr. Kreider has assisted governments and universities worldwide in establishing renewable energy and
energy efficiency programs and projects since the 1970s. He is a fellow of the American Society of
Mechanical Engineers and a registered professional engineer and member of several honorary and
professional societies. Dr. Kreider recently received ASHRAE’s E.K. Campbell Award of Merit and the
Distinguished Engineering Alumnus Award, the College’s highest honor.
Dr. Kreider earned his B.S. degree (magna cum laude) from Case Institute of Technology, and his M.S.
and Ph.D. degrees in engineering from the University of Colorado. He was employed by General Motors
for several years in the design and testing of automotive heating and air conditioning systems.
Photo by: Renée Azerbegi
© 2001 by CRC Press LLC
Contributors
Anthony F. Armor
Electric Power Research Institute
Palo Alto, California
Peter Armstrong
Pacific Northwest National
Laboratory
Richland, Washington
James B. Bradford
Schiller Associates, Inc.
Boulder, Colorado
Michael R. Brambley
Pacific Northwest National
Laboratory
Richland, Washington
James Braun
Dept. of Mechanical Engineering
Purdue University
West Lafayette, Indiana
John A. Bryant
Dept. of Construction
Texas A&M University
College Station, Texas
David E. Claridge
Dept. of Mechanical Engineering
Texas A&M University
College Station, Texas
Peter S. Curtiss
Kreider & Associates, LLC
Boulder, Colorado
Ellen M. Franconi
Schiller Associates, Inc.
Boulder, Colorado
Jeffrey S. Haberl
Dept. of Architecture
Texas A&M University
College Station, Texas
Vahab Hassani
Thermal Systems Branch
National Renewable Energy
Laboratory
Golden, Colorado
Steve Hauser
Pacific Northwest National
Laboratory
Richland, Washington
Joe Huang
Lawrence Berkeley Laboratory
Berkeley, California
David Jump
Lawrence Berkeley Laboratory
Berkeley, California
Srinivas Katipamula
Pacific Northwest National
Laboratory
Richland, Washington
Michael Kintner-Meyer
Pacific Northwest National
Laboratory
Richland, Washington
Moncef Krarti
CEAE Department
University of Colorado
Boulder, Colorado
Jan F. Kreider
Kreider & Associates, LLC
Boulder, Colorado
Mingsheng Liu
College of Engineering
University of Nebraska
Lincoln, Nebraska
Paul Norton
National Renewable Energy
Laboratory
Golden, Colorado
Dennis L. O’Neal
Dept. of Mechanical Engineering
Texas A&M University
College Station, Texas
Robert G. Pratt
Pacific Northwest National
Laboratory
Richland, Washington
Ari Rabl
École des Mines de Paris and
University of Colorado
Boulder, Colorado
T. Agami Reddy
Civil and Architectural Engineering
Drexel University
Philadelphia, Pennsylvania
Max Sherman
Lawrence Berkeley Laboratory
Berkeley, California
© 2001 by CRC Press LLC
Table of Contents
Section 1 Introduction to the Buildings Sector
Introduction
Jan F. Kreider
Section 2 Fundamentals
2.1 Thermodynamic and Heat Transfer Basics
Vahab Hassani and Steve Hauser
2.2 Psychrometrics and Comfort
T. Agami Reddy
Section 3 Economic Aspects of Buildings
3.1 Central and Distributed Utilities
Anthony F. Armor and Jan F. Kreider
3.2 Economics and Costing of HVAC Systems
Ari Rabl
Section 4 HVAC Equipment and Systems
4.1 Heating Systems
Jan F. Kreider
4.2 Air Conditioning Systems
Dennis L. O’Neal and John A. Bryant
4.3 Ventilation and Air Handling Systems
Ellen M. Franconi and James B. Bradford
4.4 Electrical Systems
Moncef Krarti
Section 5 Controls
5.1 Controls Fundamentals
Peter S. Curtiss
5.2 Intelligent Buildings
Michael R. Brambley, Peter Armstrong, Michael Kintner-Meyer,
Robert G. Pratt, and Srinivas Katipamula
Section 6 HVAC Design Calculations
6.1 Energy Calculations — Building Loads
Ari Rabl and Peter S. Curtiss
6.2 Simulation and Modeling — Building Energy Consumption
Joe Huang, Jeffrey S. Haberl, and Jan F. Kreider
6.3 Energy Conservation in Buildings
Max Sherman and David Jump
6.4 Solar Energy System Analysis and Design
T. Agami Reddy
© 2001 by CRC Press LLC
Section 7 Operation and Maintenance
7.1 HVAC System Commissioning
David E. Claridge and Mingsheng Liu
.
7.2 Building System Diagnostics and Preventive Maintenance
Srinivas Katipamula, Robert G. Pratt, and James Braun
Section 8 Appendices
Paul Norton
Appendix A
Properties of Gases and Vapors
Appendix B
Properties of Liquids
Appendix C
Properties of Solids
Appendix D
Gases and Vapors
Appendix E
Composition and Heating Values of Common Fuels
© 2001 by CRC Press LLC
© 2001 by CRC Press LLC
Jan F. Kreider “Introduction to the Buildings Sector”
Handbook of Heating, Ventilation, and Air Conditioning
Ed. Jan F. Kreider
Boca Raton, CRC Press LLC. 2001
© 2001 by CRC Press LLC
1
Introduction to the
Buildings Sector
1.1 Energy Use Patterns in Buildings in the U.S
Commercial Buildings • Industrial Processes
and Buildings • Residential Buildings
1.2 What Follows
Introduction
Buildings account for the largest sector of the U.S. economy. Construction, operation, and investment in
buildings are industries to which every person is exposed daily. One of the major expenditures in the life
cycle of a building is the operation of its space conditioning systems — heating, ventilation, and air
conditioning (HVAC) — dwarfing the initial cost of these systems or of even the entire building itself.
Therefore, it is important to use the best, most current knowledge from the design phase onward through
the building life cycle to minimize cost while maintaining a productive and comfortable indoor environment.
HVAC systems are energy conversion systems — electricity is converted to cooling or natural gas is
converted to heat. Because it is important to understand from the outset the nature of energy demands
placed on HVAC systems, that subject is discussed immediately below. The chapter closes with a short
outline of the rest of the book with its coverage of HVAC design, commissioning, operation, and
problem diagnosis.
1.1 Energy Use Patterns in Buildings in the U.S.
It is instructive to examine building energy use, sector by sector, to get an idea of the numbers and to
clarify the differences between large and small buildings as well as between industrial and office buildings.
The next several sections discuss each.
1.1.1 Commercial Buildings
In 1997, there were 4.6 million commercial buildings, occupying 58.8 billion square feet of floor space
(PNNL, 1997). These buildings consumed 126.5 thousand Btu of delivered energy use (or 252.4 thousand
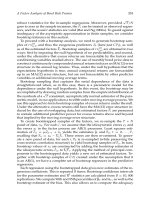
Btu of primary energy) per square foot of space. Figure 1.1 shows that of the four main census regions,
the South contains the highest percentage of commercial buildings, 38%, and the Northeast contains the
least, 16%.
Commercial Buildings Disaggregated by Floor Space
Sixty percent of U.S. commercial buildings range between 5,000 and 100,000 square feet, 82% range
between 1,000 and 200,000 square feet. The size class with the largest membership is the 10,000–25,000
square foot range. Table 1.1 shows the size distribution in the U.S.
Jan F. Kreider
Kreider
&
Associates, LLC
© 2001 by CRC Press LLC
Commercial Energy Consumption and Intensity by Square Footage (1995)
Total consumption is fairly evenly distributed across building size categories; only the largest size
category (over 500,000 square feet per building) showed a significant difference from any of the other
categories. Buildings in the 10,001–25,000 square feet per building category have the lowest energy
intensity of all categories.
Commercial Buildings Disaggregated by Building Type and Floor Space
The usage to which building space is put is a key influence on the type and amount of energy needed.
Of the total square footage of commercial office space, 67% is used for mercantile and service, offices,
warehouses and storage places, or educational facilities. The average square footage for all building types
ranges between 1,001 and 25,000 square feet. The largest building types, between 20,000 and 25,000 square
feet, are lodging and health care facilities. Medium sized building types, between 10,000 and 20,000
square feet, are public order and safety, offices, mercantile and service, and public assembly. Small building
types, less than 10,000 square feet, include warehouse and storage facilities, education facilities, food
service, and sales. Table 1.2 summarizes sector sizes and typical floor sizes.
Commercial End-Use Consumption
Mercantile and service, and office buildings consume almost 40% of total commercial energy, in terms
of Btu per square foot. Education and health care facilities, lodging, and public assemblies also consume
FIGURE 1.1
Commercial building geographical distribution. (From the
1995 Commercial Buildings Energy Con-
sumption Survey
.)
TABLE 1.1
Size Distribution of U.S. Commercial Building Space
Commercial Building Size as of 1995
(percent of total floor space)
Square Foot Range Percent
1,001 to 5,000 10.80%
5,001 to 10,000 12.80%
10,001 to 25,000 19.80%
25,001 to 50,000 13.10%
50,001 to 100,000 13.60%
100,001 to 200,000 11.50%
200,001 to 500,000 9.40%
Over 500,000 9.00%
100%
Percent of Buildings
Percent of Floor space
WEST
21
20
NORTHEAST
SOUTH
38
35
MIDWEST
16
20
25
24
Total Number of Buildings: 4.6 Million
Total Floor space: 58.8 Billion Square Feet
© 2001 by CRC Press LLC
a large amount of energy, making up another 40% of total commercial energy consumption. Table 1.3
summarizes the energy use intensities for the 12 most important categories.
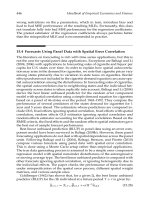
End Use Consumption by Task
Finally, one must know the end use category — space heating, cooling, water heating, and lighting. Space
heating and lighting are generally the largest energy loads in commercial office buildings. In 1995, energy
consumed for lighting accounted for 31% of commercial energy loads. Space heating consumed 22%, and
space cooling consumed 15% of commercial energy loads. On average, water heating is not high at 7%;
actual load varies greatly according to building category. Health care facilities and lodging are unique in
their high water heating loads; however, offices, mercantile and service facilities, and warehouses require
minimal hot water. Figure 1.3 shows the distribution of energy end use by sector for 1995. Another way of
considering the data in Figure 1.3 is to consider the end uses aggregated over all buildings but further
disaggregated over the nine main end uses in commercial buildings. Figure 1.4 shows the data in this way.
Commercial Energy Consumption and Intensity by Principal Building Activity (1995)
Commercial buildings were distributed unevenly across the categories of most major building charac-
teristics. For example, in 1995, 63.0 percent of all buildings and 67.1 percent of all floor space were in
FIGURE 1.2
Energy consumption and usage intensity for eight commercial building size categories. (From the
1995
Commercial Buildings Energy Consumption Survey.
)
TABLE 1.2
Commercial Building Sector Size and Typical Floor Area
1995 Average and Percent of Commercial Building by Principal Building Type (1)
Building Type
Floor Space
(%)
Average
Floor Space/Building
(SF)
Mercantile and Service 22% 11260
Office 18% 12870
Warehouse/Storage 14% 6670
Education 13% 1770
Public Assembly 7% 12110
Lodging 6% 22900
Health Care 4% 22220
Food Service 2% 4750
Food Sales 1% 4690
Public Order and Safety 2% 14610
Vacant (2) 9% 18480
Other 2% —
Over 500,000
200,001 to 500,000
100,001 to 200,000
50,001 to 100,000
25,001 to 50,000
10,001 to 25,000
5,001 to 10,000
1,001 to 5,000
120100 80 60 40 20 0 200
400 600 800
Square Feet per Building
1,000 Btu/sq. ft. Trillion Btu
Intensity
Consumption
© 2001 by CRC Press LLC
four building types: office, mercantile and service, education, and warehouse. Total energy consumption
also varied by building type. Three of these — health care, food service, and food sales — had higher
energy intensity than the average of 90.5 thousand Btu per square foot for all commercial buildings.
Figure 1.5 shows the 13 principal building types and their total consumption and intensity.
Commercial Building Energy Consumption by Fuel Type
Five principal energy types are used in U.S. commercial buildings:
Natural gas
Fuel oil
Liquefied petroleum gas (LPG)
Other and renewables
On-site electric
Table 1.4 shows the relation between end use type in Figure 1.5 and the corresponding energy sources.
Space heating, lighting, and water heating are the three largest consumers of energy. Natural gas and
electricity directly competed in three of the major end uses — space heating, water heating, and cooking.
In each of these three, natural gas consumption greatly exceeded electricity consumption.
Table 1.5 shows expected commercial sector energy use growth in the U.S.
1.1.2 Industrial Processes and Buildings
The industrial sector consists of more than three million establishments engaged in manufacturing,
agriculture, forestry, fishing, construction, and mining. In 1997, these buildings occupied 15.5 billion
square feet of floor space and 37% (34.8 quadrillion Btus) of total U.S. primary energy consumption.
After the transportation sector, the manufacturing sector consumes the most energy in the U.S. Of
the 37% of primary energy consumption in the industrial sector in 1997, 33% was used for manufacturing
purposes and 4% was used for nonmanufacturing purposes. Thus, manufacturing establishments con-
sume the majority of the energy in the industrial sector even though they are far outnumbered by
nonmanufacturing establishments. Because there is a lack of information regarding nonmanufacturing
TABLE 1.3
End Use Consumption Intensity by Building Category
1995 Commercial Delivered End-Use Energy Consumption Intensities by Principal Building Type
1
(1000 Btu/SF)
Building Type
Space
Heating
Space
Cooling
Water
Heating Lighting Total
2
Percent of
Total
Consumption
Office 24.3 9.1 8.7 28.1 97.2 19%
Mercantile and Service 30.6 5.8 5.1 23.4 76.4 18%
Education 32.8 4.8 17.4 15.8 79.3 12%
Health Care 55.2 9.9 63 39.3 240.4 11%
Lodging 22.7 8.1 51.4 23.2 127.3 9%
Public Assembly 53.6 6.3 17.5 21.9 113.7 8%
Food Service 30.9 19.5 27.5 37 245.5 6%
Warehouse and Storage 15.7 0.9 2 9.8 38.3 6%
Food Sales 27.5 13.4 9.1 33.9 213.5 3%
Vacant
3
38 1.4 5.5 4.5 30.1 3%
Public Order and Safety 27.8 6.1 23.4 16.4 97.2 2%
Other
4
59.6 9.3 15.3 26.7 172.2 3%
All Buildings 29 6 13.8 20.4 90.5 100%
Notes:
1
Parking garages and commercial buildings on multibuilding manufacturing facilities are excluded from CBECS 1995.
2
Includes all end-uses.
3
Includes vacant and religious worship.
4
Includes mixed uses, hangars, crematoriums, laboratories, and other.
Source:
EIA, Commercial Building Energy Consumption and Expenditures 1995, April 1998, Table EU-2, p. 311.
© 2001 by CRC Press LLC
FIGURE 1.3
End use categories for commercial buildings.
FIGURE 1.4
Commercial building energy end uses aggregated over all building types.
FIGURE 1.5
Energy usage and usage intensity by building type. (From the
1995 Commercial Buildings Energy
Consumption Survey
.)
0
2
0
4
0
6
0
8
0
1
0
0
12
0
14
0
1
6
0
1
8
0
En
e
r
g
y
C
o
n
s
u
mp
t
i
o
n
(
1
0
0
0
B
t
u
/
S
F
)
Office
Mercantile and Service
Education
Health Care
Lodging
Public Assembly
Food Service
Warehouse and Storage
Food Sales
Vacant
(
3
)
Public Order and Safety
Other
(
4
)
Spa
c
e
H
e
a
t
ing
Spa
c
e
C
o
o
ling
Wa
t
e
rH
e
a
t
ing
Ligh
t
ing
Office Equipment
6%
Cooking
2%
Refrigeration
3%
Other
6%
Space Heating
22%
Space Cooling
18%
Total Quads =14.6
Ventilation
5%
Water Heating
7%
Lighting
31%
Office
Mercantile and Service
Education
Health Care
Lodging
Public Assembly
Food Service
Warehouse
Food Sales
Public Order and Safety
Religious Worship
Vacant
Other
1000 Btu/sq. ft Trillion Btu
250 200 150 100 50 200 400 600 800 10000
Intensity
Consumption
© 2001 by CRC Press LLC
sectors and the majority of energy is consumed in manufacturing, the manufacturing sector is the main
focus in this section.
Standard industrial classification (SIC) groups are established according to their primary economic
activity. Each major industrial group is assigned a two-digit SIC code. The SIC system divides manufac-
turing into 20 major industry groups and nonmanufacturing into 12 major industry groups. In 1991, six
of the 20 major industry groups in the manufacturing sector accounted for 88% of energy consumption
for all purposes and for 40% of the output value for manufacturing:
1. Food and kindred products
2. Paper and allied products
3. Chemical and allied products
4. Petroleum and coal products
5. Stone, clay, and glass products
6. Primary metals
Table 1.6 summarizes the key characteristics of the energy using SIC categories with an overview of
each. Table 1.7 shows the floor space inventory by SIC.
TABLE 1.4
Fuel Type Usage in Commercial Buildings
Natural
Gas
Fuel
Oil (2)
LPG
Fuel (3) Other
Renw.
En. (4)
Site
Electric
Site
Primary
TotalTotal Percent
Space Heating (8) 1.58 0.37 0.11 0.16 2.22 29.10% 0.53
Space Cooling (7) 0.02 0.34 0.35 4.60% 1.08
Ventilation 0.17 0.17 2.20% 0.53
Water Heating (8) 0.75 0.07 0.02 0.09 0.93 12.10% 0.29
Lighting 1.22 1.22 15.90% 3.9
Refrigeration 0.18 0.16 2.40% 0.59
Cooking 0.23 0.02 0.25 3.30% 0.07
Office Equipment 0.4 0.4 5.30% 1.3
Other (9) 0.21 0.04 0.08 0.03 0 0.25 0.61 8.00% 0.81
Miscellaneous (10) 0.59 0.12 0.61 1.32 17.20% 1.95
Total 3.37 0.6 0.08 0.14 0.02 3.44 7.65 100% 11.03
FIGURE 1.6
Gas and electric consumption in commercial buildings by task. (From the
1995 Commercial Buildings
Energy Consumption Survey.
)
Space Heating
Lighting
Water Heating
Cooling
Office Equipment
Cooking
Refrigeration
Ventilation
Other
0 0.2 0.4 0.6 0.8 1 1.2 1.4
Quadrillion Btu
Electricity
Natural Gas
© 2001 by CRC Press LLC
Of a total of 15.5 billion square feet of manufacturing space, 17% is used for office space, and 83% is
used for nonoffice space. Six groups account for 50% of this space: industrial machinery, food, fabricated
metals, primary metals, lumber, and transportation (PNNL, 1997).
Manufacturers use energy in two major ways:
• To produce heat and power and to generate electricity
• As raw material input to the manufacturing process or for some other purpose
Three general measures of energy consumption are used by the U.S. Energy Information Administra-
tion (EIA). According to its 1991 data, the amount of total site consumption of energy for all purposes
was 20.3 quadrillion Btu. About two thirds (13.9 quadrillion Btu) of this was used to produce heat and
power and to generate electricity, with about one third (6.4 quadrillion Btu) consumed as raw material
and feedstocks. Figure 1.8 shows the relative energy use for the energy consuming SIC sectors.
Energy Use by Standard Industrial Classification
Energy end uses for industry are similar to those for commercial buildings although the magnitudes are
clearly different. Heating consumes 69% of delivered energy (45% of primary energy usage). Lighting is
the second largest end use with 15% of delivered energy (27% of primary energy usage). Finally, venti-
lation and cooling account for 8% each.
Industrial Consumption by Fuel Type
As with commercial buildings, a variety of fuels are used in industry. Petroleum and natural gas far exceed
energy consumption by any other source in the manufacturing sectors. Figure 1.9 indicates the fuel mix
characteristics.
TABLE 1.5
Expected Future Consumption Trends for Commercial Buildings
Commercial Primary Energy Consumption by Year and Fuel Type (quads and percents of total)
3
Year Natural Gas Petroleum
1
Coal Renewable
2
Electricity TOTAL
Growth Rate,
1980-Year
1980 267 25% 1.29 12% 0.09 1% NA 6.55 62% 10.59 —
1990 27 21% 0.91 7% 0.09 1% NA 9.12 71% 12.82 1.90%
1997 337 22% 0.73 5% 0.08 1% 0.02 0% 11.03 72% 15.24 2.20%
2000 355 22% 0.6 4% 0.09 1% 0.03 0% 11.76 73% 16.02 2.10%
2010 384 22% 0.57 3% 0.1 1% 0.03 0% 12.73 74% 17.27 1.60%
2020 4 22% 0.55 3% 0.1 1% 0.04 0% 13.4 74% 18.08 1.30%
Notes:
1
Petroleum induces distillate and residual fuels, liquid petroleum gas, kerosene, and motor gasoline.
2
Includes site marketed and nonmarketed renewable energy.
3
1997 site-to-source electricity conversion = 321.
Sources:
EIA, State Energy Data Report 1996, Feb. 1999, Table 13, p. 28 for 1980 and 1990; EIA, AEO 1999, Dec. 1998,
Table A2, p. 113-115 for 1997-2020 and Table A18, p. 135 for nonmarketed renewable energy.
FIGURE 1.7
Primary energy and electrical consumption in the U.S. (1997).
Sector Share of Total U.S. Electricity
Consumption in 1997 (Total = 10.7 Quads)
Sector Share of U.S. Primary Energy
Consumption in 1997 (Total = 94.1 Quads)
Industrial
33%
Industrial
37%
Residential
35%
Residential
20%
Commercial
32%
Commercial
16%
Transportation
27%
© 2001 by CRC Press LLC
TABLE 1.6
General Characteristics of Industrial Energy Consumption SIC
Standard
Industrial
Code Major Industry Group Description
High-Energy Consumers
20
26
28
29
32
33
Food and kindred products
Paper and allied products
Chemicals and allied products
Petroleum and coal products
Stone, clay, and glass products
Primary metal industries
This group converts raw materials into finished goods primarily
by chemical (not physical) means. Heat is essential to their
production, and steam provides much of the heat. Natural gas,
byproduct and waste fuels are the largest sources of energy for
this group. All, except food and kindred products, are the most
energy-intensive industries.
High Value-Added Consumers
34
35
36
37
38
39
Fabricated metal products
Industrial machinery and equipment
Electronic and other electric equipment
Transportation equipment
Instruments and related products
Miscellaneous manufacturing industries
This group produces high value-added transportation vehicles,
industrial machinery, electrical equipment, instruments, and
miscellaneous equipment. The primary end uses are motor-
driven physical conversion of materials (cutting, forming,
assembly) and heat treating, drying, and bonding. Natural gas is
the principal energy source.
Low-Energy Consumers
21
22
23
24
25
27
30
31
Tobacco manufactures
Textile mill products
Apparel and other textile products
Lumber and wood products
Furniture and fixtures
Printing and publishing
Rubber and miscellaneous plastics
Leather and leather products
This group is the low energy-consuming sector and represents a
combination of end-use requirements. Motor drive is one of the
key end uses.
Source:
Energy Information Administration, Office of Energy Markets and End Use, Manufacturing Consumption of
Energy 1991, DOE/EIA-0512(91).
TABLE 1.7
Industrial Building Floor Area Distribution
1991 Industrial Building Floor Space (10
6
square feet)
SIC Manufacturing Industry
Office
Floor Space
Nonoffice
Floor Space
Total
Floor Space
20 Food 203 1207 1410
21 Tobacco 6 51 56
22 Textiles 42 581 623
23 Apparel 73 451 523
24 Lumber 53 1135 1187
25 Furniture 49 521 569
26 Paper 72 827 899
27 Printing 351 477 827
28 Chemical 185 714 899
29 Refining 20 105 125
30 Rubber 97 768 865
31 Leather 9 44 53
32 Stone, Clay 57 808 864
33 Primary Metals 81 1121 1202
34 Fabricated Metals 182 1175 1357
35 Industrial Machinery 337 1149 1485
36 Electronic Equipment 266 629 894
37 Transportation 289 776 1065
38 Instruments 225 170 395
39 Misc. Manufacturing 52 190 242
Total 2,641 12,898 15,539
© 2001 by CRC Press LLC
1.1.3 Residential Buildings
Although residential buildings are not often equipped with engineered HVAC systems, it is important
to understand usage by this sector because it is large and many of the design and operation principles
for large buildings also apply to small ones. The following data summarize residential energy use in the
U.S. Figure 1.10 shows energy use by building type.
Residential Sector Overview
In 1993, there were 101.3 million households, or 76.5 million buildings with an average of 2.6 people
per household. The households consisted of 69% single-family, 25% multi-family, and 6% mobile homes.
These buildings consumed 107.8 million Btu of delivered energy (or 187.5 million Btu of primary energy)
per household.
FIGURE 1.8
Energy use by SIC category.
FIGURE 1.9
Industrial consumption by fuel type.
13%
1%
5%
2%
1%
2%
7%
4%
10%
7%
8%
8%
6%
13%
5%
2%
4%
1%
3%
1%
Food
Tobacco
Textiles
Apparel
Lumber
Furniture
Paper
Printing
Chemicals
Refining
Rubber
Leather
Stone, Clay,
Glass
Primary Metals
Fabricated
Metals
Industrial
Machinery
Electronic
Equipment
Transportation
Equipment
Instruments
Miscellaneous
Energy (10
12
Btu)
Petroleum
Natural Gas Coal
Renewable
Energy
Electricity
Electricity
Related Losses
12
10
8
6
4
2
0
9.33
9.92
2.36
1.88
3.52
7.78
© 2001 by CRC Press LLC
More than 50% of all residences range between 600 and 1,600 square feet; 23% are between 1,600 and
2,400 square feet, and 29% are in the 1,000 to 1,600 square feet range as shown in Table 1.8.
Residential Energy Consumption Intensity
Table 1.9 and Table 1.10 summarize residential fuel utilization. Natural gas and electricity are the key
residential energy sources. Table 1.11 shows expected growth through the year 2020.
1.2 What Follows
In order to cover all topics affecting the design and operation of HVAC systems in modern buildings,
this book is divided into eight sections as follows:
1. Introduction to the Buildings Sector
2. Fundamentals
2.1 Thermodynamics Heat Transfer and Fluid Mechanics Basics
2.2 Psychrometrics and Comfort
FIGURE 1.10
Comparison of commercial and residential sector energy use.
TABLE 1.8
U.S. Residential Buildings Disaggregated by Size
Household Size in Heated Floor Space as of 1995
Square Foot Range Percent
Fewer than 599 7.8%
600 to 999 22.6%
1,000 to 1,599 28.8%
1,600 to 1,999 12.8%
2,000 to 2,399 10.0%
2,400 to 2,999 8.5%
3,000 or more 9.6%
100%
Residential Buildings
Single-Family Detached
Residential Buildings in 1990
Two to Four Units
Five or More Units
Single-Family Attached
Mobile Home
Commercial Buildings
Commercial Buildings in 1989
Office
Mercantile and Service
Education
Warehouse and storage
Food Sales and Service
Assembly
Health Care
Lodging
Vacant
Other
o 2 4 6 8 10 12 14
Primary Consumption: 11.4 quadrillion Btu
Primary Consumption: 15.4 quadrillion Btu
Site Consumption: 5.8 quadrillion Btu
Site Consumption: 9.2 quadrillion Btu
Site Energy Consumption
Conversion Losses
11.1
1.3
1.3
0.9
0.7
2.8
2.1
1.1
1
0.8
0.8
0.7
0.7
0.2
1
Quadrillion Btu
© 2001 by CRC Press LLC
3. Economic Aspects of Buildings
3.1 Central and Distributed Utilities
3.2 Economics and Costing of HVAC Systems
4. HVAC Equipment and Systems
4.1 Heating Systems
4.2 Air Conditioning Systems
4.3 Ventilation and Air Handling Systems
4.5 Electrical Systems
5. Controls
5.1 Controls Fundamentals
5.2 Intelligent Buildings
6. HVAC Design Calculations
6.1 Energy Calculations — Building Loads
6.2 Simulation and Modeling — Building Energy Consumption
6.3 Energy Conservation in Buildings
6.4 Solar Energy System Analysis and Design
7. Operation and Maintenance
7.1 HVAC System Commissioning
7.2 Building System Diagnostics and Predictive Maintenance
8. Appendices
TABLE 1.9
Energy Consumption Intensities by Ownership of Unit
1993 Residential Delivered Energy Consumption Intensities by Ownership of Unit
Ownership
Per Square
Foot (10
3
Btu)
Per Household
(10
6
Btu)
Per Household
Members (10
6
Btu)
Percent of
Total Consumption
Owned 52.0 118.5 44.0 75%
Rented 67.0 75.2 31.0 25%
- Public Housing 69.0 58.2 27.0 2%
- Nonpublic Housing 67.0 77.2 31.0 23%
Source:
EIA, Household Energy Consumption and Expenditures 1993, Oct. 1995, Table 5.1, p. 37-38.
Table 1.10
Residential End-Use Consumption by Fuel Type and by End Use
1997 Residential Energy End-Use Splits by Fuel Type (quads)
Natural
Gas
Fuel
Oil
LPG
Fuel Other
Renw.
En. (3)
Site
Primary
Electric Total Percent Electric Total Percent
Space Heating 3.58 0.84 0.32 0.15 0.61 0.50 6.00 54.8% 1.61 7.10 37.3%
Space Cooling 0.00 0.54 0.54 4.9% 1.72 1.72 9.1%
Water Heating 1.27 0.10 0.07 0.01 0.39 1.83 16.8% 1.24 2.69 14.2%
Lighting 0.40 0.40 3.6% 1.27 1.27 6.7%
White Goods 0.05 0.78 0.82 7.5% 2.49 2.54 13.4%
Cooking 0.16 0.03 0.23 0.42 3.9% 0.74 0.93 4.9%
Electronics 0.27 0.27 2.5% 0.86 0.86 4.5%
Motors 0.05 0.05 0.5% 0.18 0.18 0.9%
Heating Applicances 0.10 0.10 0.9% 0.31 0.31 1.6%
Other 0.09 0.00 0.01 0.10 0.9% 0.10 0.5%
Miscellaneous 0.41 0.41 3.7% 1.30 1.30 6.9%
Total 5.15 0.94 0.43 0.15 0.62 3.66 10.94 100% 11.73 19.01 100%
© 2001 by CRC Press LLC
The book is indexed for all detailed topics, and adequate cross-references among the chapters have
been included. The appendices include the nomenclature and selected lookup tables.
References
PNNL (1997). An Analysis of Buildings-Related Energy Use in Manufacturing,
PNNL
-11499, April.
Energy Information Administration (EIA, 1995).
1995 Commercial Buildings Energy Consumption Survey
.
Table 1.11
Expected Growth in Residential Energy Use
Residential Primary Energy Consumption by Year and Fuel Type (quads and percents of total)
Year Natural Gas Petroleum
1
Coal Renewable
2
Electricity TOTAL
Growth Rate,
1980-Year
1980 4.86 32% 1.75 12% 0.06 0% NA
3
8.41 56% 15.069 100% —
1990 4.52 27% 1.27 8% 0.06 0% 0.63 4% 10.05 61% 16.53 100% 0.9%
1997 5.15 27% 1.47 8% 0.06 0% 0.62 3% 11.73 62% 19.01 100% 1.4%
2000 5.21 26% 1.38 7% 0.06 0% 0.62 3% 12.79 64% 20.06 100% 1.4%
2010 5.52 26% 1.23 6% 0.05 0% 0.65 3% 13.68 65% 21.13 100% 1.1%
2020 5.94 26% 1.12 5% 0.05 0% 0.70 3% 15.09 66% 22.90 100% 1.1%
Notes:
1
Petroleum includes distillate and residual fuels, liquefied petroleum gas, kerosene, and motor gasoline.
2
Includes site marketed and non-marketed renewable energy.
3
1980 Renewables are estimated at 1.00 quads.
Sources:
EIA, State Energy Data Report 1996, Feb. 1999, Tables 12-15, p. 22-25 for 1980 and 1990; EIA, AEO 1999,
Dec. 1998, Table A2, p. 113-115 for 1997-2020 consumption and Table A18, p. 135 for nonmarketed renewable energy.
© 2001 by CRC Press LLC
Vahab Hassani et al. “Fundamentals”
Handbook of Heating, Ventilation, and Air Conditioning
Ed. Jan F. Kreider
Boca Raton, CRC Press LLC. 2001
2
Fundamentals
2.1 Thermodynamics Heat Transfer and
Fluid Mechanics Basics
Thermodynamics • Fundamentals of Heat
Transfer • Fundamentals of Fluid Mechanics
• Heat Exchangers • Nomenclature
2.2 Psychrometrics and Comfort
Atmospheric Composition and Pressure • Thermodynamic
Properties of Moist Air • Psychrometric Properties of Moist
Air • Psychrometric Processes • Psychrometric Analysis of
Basic HVAC Systems • Human Comfort
2.1 Thermodynamics Heat Transfer and Fluid Mechanics Basics
Vahab Hassani and Steve Hauser
Design and analysis of energy conversion systems require an in-depth understanding of basic principles
of thermodynamics, heat transfer, and fluid mechanics.
Thermodynamics
is that branch of engineering
science that describes the relationship and interaction between a system and its surroundings. This
interaction usually occurs as a transfer of energy, mass, or momentum between a system and its sur-
roundings. Thermodynamic laws are usually used to predict the changes that occur in a system when
moving from one equilibrium state to another. The science of
heat transfer
complements the thermo-
dynamic science by providing additional information about the energy that crosses a system’s boundaries.
Heat-transfer laws provide information about the mechanism of transfer of energy as heat and provide
necessary correlations for calculating the rate of transfer of energy as heat. The science of
fluid mechanics
,
one of the most basic engineering sciences, provides governing laws for fluid motion and conditions
influencing that motion. The governing laws of fluid mechanics have been developed through a knowledge
of fluid properties, thermodynamic laws, basic laws of mechanics, and experimentation.
In this chapter, we will focus on the basic principles of thermodynamics, heat transfer, and fluid
mechanics that an engineer needs to know to analyze or design an HVAC system. Because of space
limitations, our discussion of important physical concepts will not involve detailed mathematical deri-
vations and proofs of concepts. However, we will provide appropriate references for those readers inter-
ested in obtaining more detail about the subjects covered in this chapter. Most of the material presented
here is accompanied by examples that we hope will lead to better understanding of the concepts.
2.1.1 Thermodynamics
During a typical day, everyone deals with various engineering systems such as automobiles, refrigerators,
microwaves, and dishwashers. Each engineering system consists of several components, and a system’s
optimal performance depends on each individual component’s performance and interaction with other
components. In most cases, the interaction between various components of a system occurs in the form
of energy transfer or mass transfer. Thermodynamics is an engineering science that provides governing
Vahab Hassani
National Renewable Energy
Laboratory
Steve Hauser
Pacific Northwest
National Laboratory
T. Agami Reddy
Drexel University
© 2001 by CRC Press LLC