Báo cáo khoa học : Tissue Doppler imaging for the diagnosis of coronary artery disease ppt
Bạn đang xem bản rút gọn của tài liệu. Xem và tải ngay bản đầy đủ của tài liệu tại đây (1.1 MB, 9 trang )
Tissue Doppler imaging for the diagnosis of coronary
artery disease
Otto A. Smiseth
a
, Asbjorn Stoylen
b
and Halfdan Ihlen
a
Purpose of review
Tissue Doppler imaging (TDI) is a diagnostic method that
provides quantitative data about myocardial function. The
present review discusses the most recent developments in the
application of TDI in coronary artery disease.
Recent findings
The most widely used TDI modality is velocity imaging, and
systolic function is measured as peak velocity during LV
ejection. Several recent studies show that TDI measurements
during the LV isovolumic phases provide unique information
regarding myocardial dysfunction. Since velocity imaging is
confounded by influence from velocities in other segments, the
TDI-based modalities strain- and strain rate imaging (SRI) have
been introduced to measure regional shortening fraction and
shortening rate, respectively.
Velocity imaging during stress echocardiography has been
validated clinically and appears equivalent, but not superior to
conventional visual assessment of grey scale images.
Potentially, more comprehensive evaluation that includes the
use of SRI may improve the diagnostic power of TDI further.
Preliminary reports suggest that TDI may have an important
role in the assessment of viability in acute coronary occlusion,
but this needs to be demonstrated in appropriately designed
clinical trials.
Summary
At the present time tissue Doppler velocity imaging can be
recommended for clinical use, especially the pulsed mode.
Strain rate imaging may be useful as additional imaging, but
needs further refinement before it is ready for routine clinical
use.
Keywords
echocardiography, tissue Doppler, coronary artery disease,
acute myocardial infarction
Curr Opin Cardiol 19:421–429. © 2004 Lippincott Williams & Wilkins.
Introduction
In clinical practice left ventricular (LV) function is com-
monly evaluated by 2-D and M-mode echocardiography.
These modalities have significant limitations, and tissue
Doppler imaging (TDI) has been introduced as a quan-
titative and more objective method for assessing myocar-
dial function. The TDI modalities include myocardial
velocity imaging, displacement imaging, strain rate im-
aging, and strain imaging (Fig. 1). This review discusses
the most recent developments in TDI-based cardiac di-
agnostics, and discusses how TDI may be applied in the
evaluation of patients with acute myocardial infarction as
well as chronic coronary artery disease.
Velocity imaging
As with Doppler flow, tissue Doppler (TDI) measures
velocities by the Doppler shift of reflected ultrasound.
The signals are of low velocity and high intensity, and
are obtained with low pass filtering and low gain. Veloc-
ities are measured in the conventional imaging planes,
from apical views as longitudinal velocities and from
parasternal views as radial velocities. Velocities can be
obtained using pulsed Doppler or color Doppler mode
[1].
Pulsed Doppler measures velocities in one sample volume
at a time by spectral analysis. Due to short pulse length,
the spectrum is broad relative to the velocity scale. This
implies that peak velocities may be substantially higher
than mean velocities, typically about 25% higher [2].
The method is on line, relatively robust, easy to use, and
quick.
Color Doppler samples the velocities of all pixels in the
sector nearly simultaneously, and by post processing ve-
locities in different parts of the ventricle can be mea-
sured on the same image (Fig. 1). Velocities are obtained
by autocorrelation, which gives mean values. By per-
forming temporal integration of velocities from a particu-
lar region one obtains displacement curves. In long-axis
views velocity and displacement increase progressively
from apex towards base. Color coding of the displace-
ment values in the image has been proposed as an easy
approach to detect regional myocardial dysfunction at
rest and during stress echocardiography [3,4], but the
technique needs further clinical testing.
When myocardial velocities are measured by TDI the
transducer represents a fixed extracardiac reference
a
Department of Cardiology, Rikshospitalet University Hospital, Oslo, Norway and
b
NTNU, Trondheim, Norway
Correspondence to Otto A. Smiseth, Department of Cardiology, Rikshospitalet,
N-0027 Oslo, Norway
Tel: 4723070000; e-mail:
Current Opinion in Cardiology 2004, 19:421–429
© 2004 Lippincott Williams & Wilkins
0268-4705
421
point, and the velocities within a myocardial segment is
the net result of motion caused by contractions in that
segment, motion due to tethering to other segments, and
overall motion of the heart. The effect of tethering ex-
plains why left ventricular (LV) longitudinal velocities
measured from an apical window, increase progressively
from the apex towards the base. During the cardiac cycle
the ventricular apex is relatively stationary, while the
mitral ring moves towards and away from the apex during
systole and diastole, respectively. Therefore, mitral ring
motion is in essence the sum of all longitudinal shorten-
ing and lengthening between the apex and the base.
Thus, ischemia in the apical region causes reduced myo-
cardial velocities not only in the apex, but also in the
nonischemic basal portion of the ventricle [2,5]. Impor-
tantly, the reduced TDI velocities in basal segments do
not mean there is a reduction in function in these seg-
ments. Likewise, due to tethering, contractions in non-
ischemic regions may cause velocities in neighboring
ischemic regions, and accordingly nonviable myocardium
appears to contract [2,5,6]. The recently introduced TDI
modalities strain and strain rate imaging (SRI) may help
to overcome these limitations.
Strain- and strain rate imaging
Strain means deformation and strain rate means deforma-
tion rate [7]. Myocardial strain rate reflects how fast re-
gional myocardial shortening or lengthening occurs, and
is calculated from myocardial Doppler velocities (V
1
and
V
2
) measured at two locations separated by a distance (L)
[8]. Strain rate equals the instantaneous spatial velocity
gradient and has units of sec
-1
:SR=(V
2
-V
1
)/L. Some
authors present the measurements as velocity gradient in-
stead of strain rate [9]. When V
1
and V
2
are different
there is deformation of the tissue in between. In the case
that the two locations are getting closer there is myocar-
dial shortening, and when they move apart there is
lengthening.
Strain is calculated as the time integral of strain rate,
most often using end-diastole as reference, and is a di-
mensionless quantity [5]. In clinical terms strain repre-
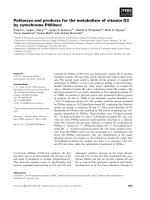
Figure 1. Tissue Doppler recordings from septum of a normal subject in a long axis view
The left column shows velocity tracings, with positive velocities towards the apex in systole, away from the apex in diastole. The second column shows displacement
curves obtained by temporal integration of the velocity curves. The third column shows strain rate, obtained by a spatial derivation of velocity data. Strain rate is negative
in systole (shortening) and positive in diastole (lengthening). The right column shows strain, obtained by temporal integration of strain rate. The time axis is the same for
all modalities. Velocity and displacement decrease from base to apex, whereas strain and strain rate are similar in magnitude at all levels.
422 Imaging and echocardiography
sents regional myocardial shortening fraction when mea-
surements are done in the LV long axis, and thickening
fraction, in the short axis. Alternatively one may report
strain values as percentage shortening and percentage thicken-
ing. Strain rate represents regional myocardial shortening
rate and thickening rate, respectively.
Although strain and strain rate are load dependent [5]
this is not a major limitation in the assessment of coro-
nary artery disease, since finding of regional differences
is more important than absolute values.
Methodological limitations of strain rate imaging
Since strain rate represents a difference between two
velocities there is a significant problem with random
noise. The signal-to-noise ratio can be improved by in-
creasing the offset distance (strain length), which in-
creases the velocity difference. The problem with ran-
dom noise can also be reduced by temporal averaging
within a heart cycle, and by averaging of multiple heart
cycles. However, these methods for noise reduction rep-
resent compromises between optimal signal-to-noise ra-
tio and requirements for spatial and temporal resolution.
Semiquantitative information can be obtained directly
from the color tissue recordings, and reduces the impor-
tance of noise. The derived curved color M-mode and
3-D color strain images (Fig. 2) give a visual presentation
of data and may separate between true pathology and
artefacts [10].
Another problem with strain rate imaging is strong sen-
sitivity to misalignment between the cardiac axis and the
echo beam. Strains in the long axis are opposite to strains
in the short axis, and when there is misalignment the two
strain tensors detract from each other [5]. A recent study
indicates that this problem might be less important [11].
Angle problems can be reduced by using the smallest
possible sector and recording one wall at a time.
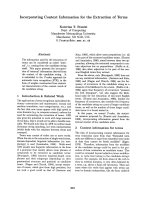
Figure 2. Reconstructed three-dimensional color-coded strain rate images of the left ventricle from a subject with
acute apical myocardial infarction
Longitudinal shortening (contraction) is shown in yellow
and lengthening in blue. Top: reconstructed bull’s eye
views showing the whole ventricle at once, but with
distorted area representation. Bottom: Three-dimensional
surfaces seen from the antero-apical aspect. The left
image is recorded in mid systole and the blue colored area
represents positive strain rates, which means systolic
lengthening, and is typical for infarcted myocardium. The
right image is from early diastole and the yellow colored
area, which represents negative strain rates indicates
postsystolic shortening.
Tissue Doppler imaging and coronary artery disease Smiseth et al. 423
An experimental study by Hashimoto et al. [12] suggests
that assessment of strain rate in different myocardial lay-
ers may be feasible. This application has obvious limita-
tions with regard to lateral resolution, which is related to
the high density of echo beams that is required. It re-
mains to be determined if this approach can be used in a
clinical setting.
Tissue Doppler imaging-based indices of
myocardial function
Ejection phase indices
Tissue Doppler imaging has excellent ability to quantify
myocardial function and has good temporal resolution
[1,13]. Ischemic regions are characterized by a decrease
in peak systolic ejection velocity, and a decrease in peak
early-diastolic myocardial lengthening velocity [14,15].
Measurement of peak ejection velocity is the most
widely used TDI measure for quantifying regional func-
tion in suspected coronary artery disease. Longitudinal
velocity measurements are more reproducible than radial
velocities, and are therefore usually preferred. On the
other hand longitudinal velocities show more variability
between segments and this complicates clinical use. Re-
cently, reference values were presented from a group of
normal individuals [16]. There is, however, need for
larger age- and sex-stratified studies and these should
include measurement of strain and strain rate as well.
Several groups are currently working with establishing
such reference values.
A number of studies suggest that analysis of function
during the isovolumic LV phases provide additional im-
portant diagnostic information. In the subsequent para-
graphs we will review some of the studies.
Preejection indices
Preejection velocity predicts recovery of function
after reperfusion
Experimental studies indicate that velocities during iso-
volumic contraction (IVC) may serve as a means to de-
termine degree of myocardial dysfunction during ische-
mia [17]. In ventricles with preserved systolic function
there is a dominantly positive longitudinal velocity dur-
ing IVC, with only a minor negative velocity component.
With progressive ischemia the positive velocity compo-
nent diminishes, and the negative component increases.
During severe ischemia the positive component is lost
and replaced by a large negative IVC velocity (Fig. 3).
The negative IVC velocity is a reflection of the early
systolic lengthening, which is a hallmark of severe ische-
mia. Penicka et al. [18] tested the ability of IVC velocities
to predict recovery of myocardial function after coronary
revascularization in myocardial infarction. They showed
that a positive IVC velocity after revascularization pre-
dicted recovery of function in the reperfused area. This
study suggests that measurement of IVC velocities may
provide important diagnostic information with regard to
myocardial viability after coronary reperfusion.
Does myocardial IVC acceleration reflect inotropy?
Similar to LV ejection fraction, peak systolic ejection
velocity is preload and afterload dependent. Vogel et al.
[19] proposed that myocardial IVC acceleration (IVA)
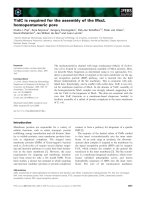
Figure 3. Data from an experimental study before (left panel) and during coronary artery occlusion (right panel)
Before coronary occlusion there is a dominantly positive
Doppler velocity spike during IVC and a more protracted
velocity during ejection. During IVR there are only minor
velocity spikes. During coronary occlusion the velocity
profile is dominated by a large negative velocity during IVC
and a marked positive velocity during IVR, while ejection
velocities are near zero. The lower panels show regional
function by sonomicrometry, and confirms that the
negative IVC velocity during LAD occlusion represents
systolic lengthening and the positive IVR velocity means
postsystolic shortening. Modified from Edvardsen et al.
[17].
424 Imaging and echocardiography
would be a load-independent measure of contractility. In
an animal model they measured longitudinal myocardial
velocities near the LV base, and demonstrated that IVA
reflected myocardial contractility, and appeared to be
load independent. However, this study was done in the
nonischemic ventricle, and measurements were taken
near the mitral ring, which means they measured in es-
sence global LV function. In a recent experimental study
Lyseggen et al. [20] validated IVA as a measure of re-
gional function during myocardial ischemia. This study
confirmed that IVA was related to global LV contractil-
ity, but IVA did not reflect function in the ischemic
myocardium. Thus, IVA appears to have limited poten-
tial to serve as a measure of regional function during
ischemia.
Postejection indices
It has been known for long that postsystolic shortening
(LV long axis) and postsystolic thickening (short axis) are
characteristic features of ischemic myocardium [21]. As
alternative terminology one may use postejection shorten-
ing and thickening, since the myocardium shortens and
thickens after aortic valve closure. Postsystolic shorten-
ing can be measured directly with strain Doppler echo-
cardiography and is measured as myocardial shortening
that occurs after cessation of aortic forward flow. Post-
systolic shortening can also be imaged by velocity imag-
ing, and is in the long axis represented by a positive
velocity component during isovolumic relaxation (IVR).
Figure 4 demonstrates postsystolic shortening as mea-
sured by velocity imaging.
As demonstrated by Voigt et al. [22] minor degrees of
postsystolic shortening occurs in normal myocardium,
and is not pathologic unless it exceeds a certain magni-
tude in absolute terms or represents a substantial fraction
(> 20%) of total myocardial shortening (Fig. 5). The
mechanism of postsystolic shortening in normal myocar-
dium is not defined, but may be related to the LV shape
changes and untwisting motion that occur during IVR.
Postsystolic shortening and viability in acute
myocardial infarction
Postsystolic shortening by DTI has been proposed as a
marker of myocardial viability during acute coronary oc-
clusion, with the rationale that it may represent active
myocardial contraction. Postsystolic shortening, how-
ever, may occur in entirely passive or necrotic myocar-
dium as well as in actively contracting ischemic myocar-
dium [23]. Therefore, the isolated finding of postsystolic
shortening is nonspecific with regard to tissue viability.
The mechanism of postsystolic shortening in passive
myocardium is analogous to the behavior of a stretched
elastic spring; it will recoil passively when the stretching
force is removed. Thus, dyskinetic myocardium, which
by definition is stretched in systole by nonischemic myo-
cardium, will recoil during IVR when nonischemic myo-
cardium relaxes and the stretching force drops abruptly.
However, measurement of postsystolic shortening may
help to identify viable myocardium, provided that strains
during IVC and ejection are assessed simultaneously.
First, if postsystolic shortening occurs in the absence of
systolic lengthening passive recoil can be excluded, and
therefore the postsystolic shortening represents delayed
active contraction [23]. Second, as suggested by recent
experimental data, when a segment is dyskinetic, but the
Figure 4. Postsystolic shortening in ischemic myocardium
Myocardial velocity curves from a patient with significant
stenosis of the left anterior descending coronary artery.
The dashed curve shows longitudinal velocity in a normal
lateral segment. The continuous curve shows velocity in an
ischemic segment in mid septum. This ischemic segment
has reduced systolic velocity, and during early diastole
there is a marked positive velocity (arrow), which
represents postsystolic shortening. S, systolic velocity; E’,
early-diastolic velocity; A’, late-diastolic velocity.
Tissue Doppler imaging and coronary artery disease Smiseth et al. 425
postsystolic shortening far exceeds the systolic lengthen-
ing in magnitude, it is likely that active contraction con-
tributes to postsystolic shortening [24]. Thus, Skulstad et
al. [24] proposed that the ratio between systolic length-
ening and combined late systolic and postsystolic short-
ening may serve as a marker of active as opposed to
passive postsystolic shortening. The rationale for this as-
sociation is that active wall tension will limit systolic
lengthening and enhance active postsystolic shortening.
A postsystolic strain index expressed as ratio between
postsystolic shortening and systolic shortening has been
proposed by Kukulski et al. [25•]. They showed that this
index was a highly sensitive and specific marker of myo-
cardial dysfunction during acute myocardial ischemia.
Although this index may be useful since it “normalizes”
the postsystolic shortening values, it has an evident limi-
tation when studying segments with akinesia, and there-
fore very small systolic strain. In the latter case even a
postsystolic shortening of trivial magnitude may repre-
sent a large fraction of systolic strain [26]. In these cases
the absolute rather than the relative postsystolic short-
ening will be of interest.
Song et al. [27] investigated patients several months after
myocardial infarction and found that postsystolic thick-
ening as demonstrated by TDI was associated with signs
of tissue viability. The study, however, was limited by
absence of reference method or postintervention data
that confirmed viability.
From a clinical perspective the differentiation between
active and passive postsystolic shortening is critical, since
active contraction implies viable myocardium.
Potentially, assessment of postsystolic shortening may
help in patient triage in acute myocardial infarction, in
particular when thrombolysis has been primary treat-
ment and transfer for rescue PCI is considered. At the
present time, however, we lack prospective trials that
confirm the clinical value of assessing postsystolic short-
ening in acute myocardial infarction.
Postsystolic shortening in stress echocardiography
In the setting of stress echocardiography, when postsys-
tolic shortening is absent during baseline, but appears
during dobutamine it is a marker of myocardial ischemia
[28•] (Fig. 6).
Furthermore, as demonstrated in an experimental study
by Weidemann et al. [26] dobutamine-induced enhance-
ment of postsystolic thickening along with a reduction of
systolic thickening differentiates nontransmural from
transmural chronic infarctions. Therefore, measurement
of postsystolic shortening/thickening is a promising ap-
proach in the analysis of stress-echocardiography record-
ings.
Stress echocardiography
Conventional stress echocardiography is based on visual
assessment of systolic wall thickening and endocardial
excursion, and suffers from being subjective and pro-
vides only qualitative or semiquantitative data [29]. Fur-
thermore, visual assessment has poor temporal resolu-
tion, and therefore has limited ability to detect more
subtle changes in myocardial function [30,31]. Tissue
Doppler represents a means to quantify regional function
objectively and with much better temporal resolution
[32,33]. Pulsed Doppler is too time consuming to allow
measurements from all segments during the final stress
Figure 5. Postsystolic shortening in a normal individual
Recordings from the midseptal region in a young control
subject, showing strain rate (a) and strain (b). ECG is
included for referencing. The timings of mitral valve
closure (MVC), aortic valve opening (AVO), aortic valve
closure (AVC), and mitral valve opening (MVO) are
indicated. In this person there is slight postsystolic
shortening that starts at the time of mitral valve opening,
as indicated by negative strain rate and a decrease in
strain. Reproduced from Voigt et al. [22].
426 Imaging and echocardiography
stage, while color Doppler recordings are obtained much
faster and measurements are done during post processing
[34].
Fraser et al. [35•] in the MYDISE (MYocardial Doppler
In Stress Echocardiography) study have examined the
feasibility and reproducibility of segmental tissue Dopp-
ler in dobutamine stress echocardiography. They re-
ported that analysis was feasible in 90% of examined
segments in 92 normal subjects, but their analysis was
limited to basal and mid wall segments. Reproducibility
was examined in the same cine-loops from 10 subjects.
Coefficients of variation for peak systolic velocity and
time to peak velocity were up to 18% in basal segments
and 28% in midwall segments at peak stress. The clinical
utility of the method then depends on the magnitude of
the increase from baseline to peak stress.
The same group addressed the diagnostic accuracy of
tissue Doppler in stress echo in a population of 289 sub-
jects by Mädler et al. [36•]. Peak systolic velocity at peak
stress, rather than change in velocity from baseline was
the best discriminator of disease, but sensitivity was only
63 to 69% and specificity 60 to 67% for the different
vascular regions, which are somewhat lower values than
previously reported by the Brisbane group [37]. How-
ever, when Mädler et al. [36] applied a regression model,
which included age, gender, and peak heart rate, sensi-
tivity increased to 80 to 93% and specificity to 80 to 82%.
These results imply that not only heart rate, but also age
and gender should be taken into account when interpret-
ing stress echo by tissue Doppler. Importantly, the Bris-
bane group has shown that less-experienced observers
obtain a significant improvement in sensitivity and ac-
curacy using TDI relative to visual assessment in inter-
preting dobutamine echocardiography [38].
A few studies using strain rate imaging in stress echocar-
diography have been recently published. Davidavicius et
al. [39] found that 95% of segments could be analyzed
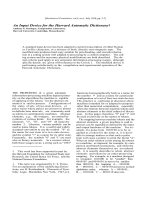
Figure 6. Strain and strain rate responses during stress echo
This figure displays LV two-chamber perfusion scintigraphic images and color-coded strain rate images (a), and strain rate (b), strain (c), and ECG (d) traces prior to
and at peak dobutamine stress. The arrow in the upper right panel points to a perfusion defect. Strain and strain rates are recorded from the ischemic region and a
nonischemic region. During peak stress the strain trace from the ischemic apical region demonstrates early-systolic lengthening and postsystolic shortening. SR
peak sys
indicate peak systolic strain. T
bos
and t
eos
indicate beginning and end of shortening, respectively. E
max
,E
et
, and E
ps
indicate max strain during the heart cycle, strain
during ejection and postsystolic strains, respectively. Reproduced from Voigt et al. [28].
Tissue Doppler imaging and coronary artery disease Smiseth et al. 427
during dobutamine stress. Due to noise problems strain
rate imaging was not feasible during treadmill or bicycle
stress. The study, however, was small and was limited to
healthy individuals. Kowalski et al. [40] extended the
testing of SRI to patients with coronary artery disease.
The normal response during dobutamine stress was an
increase in strain rate and strain at low dose dobutamine,
a further increase in strain rate at high dose, when strain
showed a plateau due to the increased heart rate. Their
study confirms that SRI may have a clinical potential, but
was not designed to determine the ability of SRI to di-
agnose coronary artery disease.
The clinical value of SRI was addressed by Voigt et al.
[28]. The study included 44 patients and single photon
emission computed tomography (SPECT) was used as
reference method for ischemia. The ratio of postsystolic
shortening to maximum segmental shortening was the
best parameter to identify stress-induced ischemia. Fur-
thermore, compared with conventional gray scale readings
SRI curved M-mode improved sensitivity/specificity
from 81/82% to 86/89%. The statistical significance of
this difference, however, is not given in the paper. Abra-
ham et al. [41] introduced the time to onset of regional
LV relaxation as a measure of ischemia during stress
echo. This is an interesting approach that needs further
clinical testing.
Conclusion
Tissue Doppler echocardiography has proved to be an
accurate method for quantitative evaluation of regional
myocardial function, and the most widely used measure
in coronary disease is peak velocity during LV ejection.
So far TDI has not replaced conventional grey-scale im-
aging in the assessment of regional LV function. Further
studies are needed to determine if inclusion of pre-
injection and post-ejection velocities and timing of
events may increase the diagnostic power. Recent devel-
opments in 3-D cardiac imaging could allow more com-
prehensive visualization of myocardial function. Ulti-
mately, for the clinician it is critical that the advantages
of the new quantitative methodologies outweigh their
disadvantages in terms of complexity and cost. At the
present time tissue Doppler velocity imaging can be rec-
ommended for clinical use, especially the pulsed mode.
Strain rate imaging may be useful as additional imaging,
but needs further refinement before it is ready for rou-
tine clinical use.
References and recommended reading
Papers of particular interest, published within the annual period of review,
have been highlighted as:
• Of special interest
•• Of outstanding interest
1 Sutherland GR, Stewart MJ, Groundstroem KW, et al.: Color Doppler myo-
cardial imaging: a new technique for the assessment of myocardial function.
J Am Soc Echocardiogr 1994, 7:441–458.
2 Stoylen A, Skjaerpe T: Systolic long axis function of the left ventricle. Global
and regional information. Scand Cardiovasc J 2003, 37:253–258.
3 Pan C, Hoffmann R, Kuhl H, et al.: Tissue tracking allows rapid and accurate
visual evaluation of left ventricular function. Eur J Echocardiogr 2001, 2:197–
202.
4 Cain P, Baglin T, Khoury V, et al.: Automated regional myocardial displace-
ment for facilitating the interpretation of dobutamine echocardiography. Am J
Cardiol 2002, 89:1347–1353.
5 Urheim S, Edvardsen T, Torp H, et al.: Myocardial strain by Doppler echocar-
diography. Validation of a new method to quantify regional myocardial func-
tion. Circulation 2000, 102:1158–1164.
6 Edvardsen T, Skulstad H, Aakhus S, et al.: Regional myocardial systolic func-
tion during acute myocardial ischemia assessed by strain Doppler echocar-
diography. J Am Coll Cardiol 2001, 37:726–730.
7 Mirsky I, Parmley WW: Assessment of passive elastic stiffness for isolated
heart muscle and the intact heart. Circ Res 1973, 33:233–243.
8 Heimdahl A, Støylen A, Torp H, Skjaerpe T: Real-time strain rate imaging of the
left ventricle by ultrasound. J Am Soc Echocardiogr 1998, 11:1013–1019.
9 Derumeaux G, Ovize M, Loufoua J, et al.: Assessment of nonuniformity of
transmural myocardial velocities by color-coded tissue Doppler imaging. Cir-
culation 2000, 101:1390–1395.
10 Stoylen A, Ingul CB, Torp H: Strain and strain rate parametric imaging. A new
method for post processing to 3- / 4-dimensional images from three standard
apical planes. Preliminary data on feasibility, artefact and regional dyssynergy
visualisation. Cardiovasc Ultrasound 2003, 1:11.
11 Storaa C, Åberg P, Lind B, Brodin L-A: Effect of angular error on tissue Dopp-
ler velocities and Strain. Echocardiography 2003, 20:581–587.
12 Hashimoto I, Xiaokui L, Hejmadi A, et al.: Myocardial strain rate is a superior
method for evaluation of left ventricular subendocardial function compared to
tissue Doppler imaging. JACC 2003, 42:1574–1583.
13 Gorcsan J 3rd, Strum DP, Mandarino WA, et al.: Quantitative assessment of
alterations in regional left ventricular contractility with color-coded tissue
Doppler echocardiography. Comparison with sonomicrometry and pressure-
volume relations. Circulation 1997, 95:2423–2433.
14 Bach DS, Armstrong WF, Donovan CL, Muller DW: Quantitative Doppler
tissue imaging for assessment of regional myocardial velocities during tran-
sient ischemia and reperfusion. Am Heart J 1996, 132:721–725.
15 Derumeaux G, Ovize M, Loufoua J, et al.: Doppler tissue imaging quantitates
regional wall motion during myocardial ischemia and reperfusion. Circulation
1998, 97:1970–1977.
16 Nikitin NP, Witte KKA, Thackray SDR, et al.: Longitudinal ventricular function:
Normal values of atrioventricular annular and myocardial velocities measured
with quantitative two-dimensional color Doppler tissue imaging. J Am Soc
Echocardiogr 2003, 16:906–921.
17 Edvardsen T, Urheim S, Skulstad H, et al.: Quantification of left ventricular
systolic function by tissue Doppler Echocardiography. Added value of mea-
suring pre- and postejection velocities in ischemic myocardium. Circulation
2002, 105:2071–2077.
18 Penicka M, Bartunek J, Wijns W, et al.: Tissue Doppler imaging predicts re-
covery of left ventricular function after recanalization of an occluded coronary
artery. J Am Coll Cardiol 2004, 43:85–91.
19 Vogel M, Cheung MM, Li J, et al.: Noninvasive assessment of left ventricular
force-frequency relationships using tissue Doppler-derived isovolumic accel-
eration: validation in an animal model. Circulation 2003, 107:1647–1652.
20 Lyseggen E, Rabben SI, Skulstad H, et al.: Myocardial acceleration during
isovolumic contraction–is it really a sensitive index of myocardial function?
Eur Heart J 2002, 23(Suppl 1):273.
21 Tennants R, Wiggers CJ. The effect of coronary occlusion on myocardial
contraction. Am J Physiol 1935:351–361.
22 Voigt JU, Lindenmeier G, Exner B, et al.: Incidence and characteristics of
segmental postsystolic longitudinal shortening in normal, acutely ischemic,
and scarred myocardium. J Am Soc Echocardiogr 2003, 16:415–423.
23 Skulstad H, Edvardsen T, Urheim S, et al.: Postsystolic shortening in ischemic
myocardium. Active contraction or passive recoil? Circulation 2002,
106:718–724.
24 Skulstad H, Lyseggen E, Edvardsen T, et al.: The ratio between systolic
lengthening and postsystolic shortening: a marker of myocardial viability. Eur
Heart J 2003, 24(abstr suppl):242.
428 Imaging and echocardiography
•
25 Kukulski T, Jamal F, Herbots L, et al.: Identification of acutely ischemic myo-
cardium using ultrasonic strain measurements: a clinical study in patients
undergoing coronary angioplasty. JACC 2003, 41:810–819.
26 Weidemann F, Dommke C, Bijnens B, et al.: Defining the transmurality of a
chronic myocardial infarction by ultrasonic strain-rate imaging: implications
for identifying intramural viability: an experimental study. Circulation 2003,
107:883–888.
27 Song JK, Song JM, Kang DH, et al.: Postsystolic thickening detected by
Doppler myocardial imaging: a marker of viability or ischemia in patients with
myocardial infarction. Clin Cardiol 2004, 27:29–32.
••
28 Voigt JU, Exner B, Schmiedehausen K, et al.: Strain-rate imaging during dobu-
tamine stress echocardiography provides objective evidence of inducible
ischemia. Circulation 2003, 107:2120–2126.
29 Picano E, Lattanzi F, Orlandini A, et al.: Stress echocardiography and the
human factor: the importance of being expert. J Am Coll Cardiol 1991,
17:666–669.
30 Bartunek J, Marwick TH, Rodrigues ACT, et al.: Dobutamine-induced wall
motion abnormalities: correlations with myocardial fractional flow reserve and
quantitative coronary angiography. J Am Coll Cardiol 1996, 27:1429–1436.
31 Kvitting JP, Wigstroem L, Strotmann JM, Sutherland GR: How accurate is of
visual assessment of synchronicity in myocardial motion? An in vitro study
with computer-simulated regional delay in myocardial motion: clinical impli-
cation for rest and stress echocardiography studies. J Am Soc Echocardiogr
1999, 12:698–705.
32 Gorcsan J III, Deswal A, Mankad S, et al.: Quantification of the myocardial
reponse to low-dose dobutamine using tissue Doppler echocardiographic
measures of velocity and velocity gradient. Am J Cardiol 1998, 81:615–623.
33 Wilkenshoff UM, Sovany A, Wigstrom L, et al.: Regional mean systolic myo-
cardial velocity estimation by real-time color Doppler myocardial imaging: a
new technique for quantifying regional systolic function. J Am Soc Echocar-
diogr 1998, 11:683–692.
34 Cain P, Marwick TH, Case C, et al.: Assessment of regional long-axis function
during dobutamine echocardiography. Clin Sci 2001, 100:423–432.
•
35 Fraser AG, Payne N, Mädler CF, et al.: Feasibility and reproducibility of off-line
tissue Doppler measurement of regional myocardial function during dobuta-
mine stress echocardiography. Eur J Echocardiogr 2003, 4:43–53.
•
36 Mädler CF, Payne N, Wilkenshoff U, et al.: Non-invasive diagnosis of coronary
artery disease by quantitative stress echocardiography: optimal diagnostic
models using off-line tissue Doppler in the MYDISE study. Eur Heart J 2003,
24:1584–1594.
37 Cain P, Baglin T, Case C, et al.: Application of tissue Doppler to interpretation
of dobutamine echocardiography: comparison with quantitative coronary an-
giography. Am J Cardiol 2001, 87:525–531.
38 Faithi RB, Cain P, Nakatani S, et al.: Effect of tissue Doppler on the accuracy
of novice and expert interpreters of dobutamine echocardiography. Am J Car-
diol 2001, 88:400–405.
39 Davidavicius G, Kowalski M, Williams RI, et al.: Can regional strain and strain
rate measurement be performed during both dobutamine and exercise echo-
cardiography, and do regional deformation responses differ with different
forms of stress testing? J Am Soc Echocardiogr 2003, 16:299–308.
40 Kowalski M, Herregods MC, Herbots L, et al.: The feasibility of ultrasonic
regional strain and strain rate imaging in quantifying dobutamine stress echo-
cardiography. Eur J Echocardiogr 2003, 4:81–91.
41 Abraham TP, Belohlavek M, Thomson HL, et al.: Time to onset of regional
relaxation: feasibility, variability and utility of a novel index of regional myocar-
dial function by strain rate imaging. J Am Coll Cardiol 2002, 39:1531–1537.
Tissue Doppler imaging and coronary artery disease Smiseth et al. 429