EVAPOTRANSPIRATION – FROM MEASUREMENTS TO AGRICULTURAL AND ENVIRONMENTAL APPLICATIONS ppsx
Bạn đang xem bản rút gọn của tài liệu. Xem và tải ngay bản đầy đủ của tài liệu tại đây (13.27 MB, 420 trang )
EVAPOTRANSPIRATION –
FROM MEASUREMENTS TO
AGRICULTURAL AND
ENVIRONMENTAL
APPLICATIONS
Edited by Giacomo Gerosa
Evapotranspiration –
From Measurements to Agricultural and Environmental Applications
Edited by Giacomo Gerosa
Published by InTech
Janeza Trdine 9, 51000 Rijeka, Croatia
Copyright © 2011 InTech
All chapters are Open Access distributed under the Creative Commons Attribution 3.0
license, which permits to copy, distribute, transmit, and adapt the work in any medium,
so long as the original work is properly cited. After this work has been published by
InTech, authors have the right to republish it, in whole or part, in any publication of
which they are the author, and to make other personal use of the work. Any republication,
referencing or personal use of the work must explicitly identify the original source.
As for readers, this license allows users to download, copy and build upon published
chapters even for commercial purposes, as long as the author and publisher are properly
credited, which ensures maximum dissemination and a wider impact of our publications.
Notice
Statements and opinions expressed in the chapters are these of the individual contributors
and not necessarily those of the editors or publisher. No responsibility is accepted for the
accuracy of information contained in the published chapters. The publisher assumes no
responsibility for any damage or injury to persons or property arising out of the use of any
materials, instructions, methods or ideas contained in the book.
Publishing Process Manager Dragana Manestar
Technical Editor Teodora Smiljanic
Cover Designer Jan Hyrat
Image Copyright thinkdo, 2011. Used under license from Shutterstock.com
First published October, 2011
Printed in Croatia
A free online edition of this book is available at www.intechopen.com
Additional hard copies can be obtained from
Evapotranspiration – From Measurements to Agricultural and Environmental Applications,
Edited by Giacomo Gerosa
p. cm.
ISBN 978-953-307-512-9
free online editions of InTech
Books and Journals can be found at
www.intechopen.com
Contents
Preface IX
Part 1 Measuring Techniques for the Spatial
and Temporal Characterisation of the ET 1
Chapter 1 Spatial and Temporal Variation in Evapotranspiration 3
Jerry L. Hatfield and John H. Prueger
Chapter 2 Evapotranspiration Estimation
Using Micrometeorological Techniques 17
Simona Consoli
Chapter 3 Is It Worthy to Apply Different Methods
to Determine Latent Heat Fluxes?
- A Study Case Over a Peach Orchard 43
F. Castellví
Chapter 4 Daily Crop Evapotranspiration, Crop
Coefficient and Energy Balance Components
of a Surface-Irrigated Maize Field 59
José O. Payero and Suat Irmak
Chapter 5 (Evapo)Transpiration Measurements Over Vegetated
Surfaces as a Key Tool to Assess the Potential Damages
of Air Gaseous Pollutant for Plants 79
Giacomo Gerosa, Angelo Finco, Simone Mereu,
Antonio Ballarin Denti
and Riccardo Marzuoli
Chapter 6 Evapotranspiration Partitioning Techniques
for Improved Water Use Efficiency 107
Adel Zeggaf Tahiri
Chapter 7 Evapotranspiration and Transpiration Measurements in
Crops and Weed Species by the Bowen Ratio and Sapflow
Methods Under the Rainless Region Conditions 125
J. Pivec, V. Brant and K. Hamouzová
VI Contents
Part 2 Crop ET: Water Use, Water Quality
and Management Aspects 141
Chapter 8 Evapotranspiration and Water
Management for Crop Production 143
André Pereira and Luiz Pires
Chapter 9 Crop Evapotranspiration and
Irrigation Scheduling in Blueberry 167
David R. Bryla
Chapter 10 Evapotranspiration and Crop Water Stress Index
in Mexican Husk Tomatoes (Physalis ixocarpa Brot) 187
Rutilo López- López, Ramón Arteaga Ramírez,
Ignacio Sánchez-Cohen, Waldo Ojeda Bustamante
and Victor González-Lauck
Chapter 11 Evapotranspiration Partitioning
in Surface and Subsurface
Drip Irrigation Systems 211
Hossein Dehghanisanij and Hanieh Kosari
Chapter 12 Saving Water in Arid and Semi-Arid
Countries as a Result of Optimising
Crop Evapotranspiration 225
Salah El-Hendawy, Mohamed Alboghdady,
Jun-Ichi Sakagami and Urs Schmidhalter
Chapter 13 The Impact of Seawater Salinity
on Evapotranspiration and Plant Growth
Under Different Meteorological Conditions 245
Ahmed Al-Busaidi and Tahei Yamamoto
Chapter 14 Modelling Evapotranspiration
of Container Crops for Irrigation Scheduling 263
Laura Bacci, Piero Battista, Mariateresa Cardarelli,
Giulia Carmassi, Youssef Rouphael, Luca Incrocci,
Fernando Malorgio, Alberto Pardossi,
Bernardo Rapi and Giuseppe Colla
Chapter 15 Description of Two Functions I and J
Characterizing the Interior Ground Inertia
of a Traditional Greenhouse - A Theoretical
Model Using the Green’s Functions Theory 283
Rached Ben Younes
Chapter 16 Greenhouse Crop Transpiration Modelling 311
Nikolaos Katsoulas and Constantinos Kittas
Contents VII
Part 3 Natural Ecosystems ET: Ecological Aspects 329
Chapter 17 Interannual Variation in Transpiration Peak of
a Hill Evergreen Forest in Northern Thailand in
the Late Dry Season: Simulation of Evapotranspiration
with a Soil-Plant-Air Continuum Model 331
Tanaka K., Wakahara T., Shiraki K., Yoshifuji N.
and Suzuki M.
Chapter 18 Evapotranspiration of Woody Landscape Plants 347
Richard C. Beeson
Part 4 ET and Groundwaters 371
Chapter 19 The Role of the Evapotranspiration in the Aquifer
Recharge Processes of Mediterranean Areas 373
Francesco Fiorillo
Part 5 ET and Climate 389
Chapter 20 The Evapotranspiration in Climate Classification 391
Antonio Ribeiro da Cunha and Edgar Ricardo Schöffel
Preface
This book represents an overview on the direct measurement techniques of
evapotranspiration, with related applications to the water use optimization in the
agricultural practice and to the ecosystems study.
The measurements are necessary to evaluate the spatial and temporal variability of ET
and to refine the modeling tools. Beside the basic concepts, examples of applications of
the different measuring techniques at leaf level (porometry), at plant-level (sap-flow,
lysimetry) and agro-ecosystem level (Surface Renewal, Eddy Covariance, Multi layer
BREB) are illustrated in detail.
The agricultural practice requires a careful management of water resources, especially
in the areas where water is naturally scarce. The detailed knowledge of the
transpiration demands of crops and different cultivars, as well as the testing of new
irrigation techniques and schemes, allows the optimization of the water consumptions.
Besides some basic concepts, the results of different experimental irrigation techniques
in semi-arid areas (e.g. subsurface drip) and optimization of irrigation schemes for
different crops in open-field, greenhouse and potted grown plants, are presented.
Aspects on ET of crops in saline environments are also presented.
Finally, effects of ET on groundwater quality in xeric environments, as well as the
application of ET to climatic classification, are presented.
All the Chapters, chosen from well reputed researchers in the field, have been
carefully peer reviewed and contribute to report the state of the art of the ET research
in the different applicative fields. The book provides an excellent overview for both,
researchers and students, who intend to address these issues.
Dr. Giacomo Gerosa
Catholic University of the Sacred Heart
Brescia,
Italy
Part 1
Measuring Techniques for the Spatial and
Temporal Characterisation of the ET
1
Spatial and Temporal Variation in
Evapotranspiration
Jerry L. Hatfield and John H. Prueger
National Laboratory for Agriculture and the Environment
United States of America
1. Introduction
Evapotranspiration represents the combined loss of soil water from the earth’s surface to the
atmosphere through evaporation of water from the soil or plant surfaces and transpiration
via stomates of the plant. In agricultural production systems these two losses of water
represent a major component of the water balance of the crop. If we examine
evapotranspiration over time throughout a growing season of a crop then the fractions of
evaporation and transpiration will not remain constant. When there is a small plant partially
covering the soil then the energy impinging on the soil surface will be used to evaporate
water from the soil surface; however, as the crop develops and completely covers the soil
then transpiration becomes the dominant process. There is a spatial and temporal aspect to
evapotranspiration which exists but is often ignored in our consideration of the dynamics of
water loss from the earth’s surface.
One of the major questions which exists is how uniform is evapotranspiration over a given
production field or over a landscape because of the limited amount of information on the
spatial variation of evapotranspiration. There have been a limited number of research
studies on the spatial variation in evapotranspiration. Many of these studies utilize remote
sensing data as shown by Zhang et al. (2010) in which they developed a spatial-temporal
evapotranspiration model for the Hebei Plain in China. They found the temporal variation
in evapotranspiration was due to crop growth and the irrigation regime while spatial
variation was caused by the type of crop being grown. An aspect of evapotranspiration is
the use of reference pan evaporation to provide a surrogate for the atmospheric evaporation
and the results from a study by Zhang et al. (2009) showed spatial variation was induced by
changes in the driving variables, e.g., windspeed, solar radiation, or temperature. Variations
in these parameters would be expected to create spatial differences in evapotranspiration
from crop surfaces. Spatial and temporal variation in crop reference evapotranspiration has
been studied by Zhang et al. (2010) across a river basin in China and observed the spatial
variation in reference evapotranspiration was low in the cool months (January to April) and
large in the warm months (May to August). The driving variable inducing the spatial
variation in the warm months was most closely related to variation in the available energy
among locations.
Li et al. (2006) evaluated the combination of remote sensing data combined with surface
energy balance to evaluate the spatial variation in evapotranspiration and found the mean
values of evapotranspiration were similar across a range of spatial scales. However, the
Evapotranspiration – From Measurements to Agricultural and Environmental Applications
4
standard deviation decreased with higher spatial resolution and when the increased above
480 m, there was a loss of spatial structure in the evapotranspiration maps. Using a Raman
lidar system, Eichinger et al. (2006) observed large spatial variation in evapotranspiration in
corn (Zea mays L.) and soybean (Glycine max (L.) Merr.) linked with small elevation
differences within the fields. These observations would suggest spatial structure has
different scales and there are few studies which have attempted to evaluate spatial variation
and the underlying causes. Mo et al. (2004) used a simulation model to evaluate
evapotranspiration and found spatial variation was closely related to spatial patterns in
precipitation and leaf area of the crop. This is similar to observations by Hatfield et al. (2007)
from an experiment in central Iowa in which they observed that spatial variation in energy
and carbon fluxes among different corn and soybean fields could be attributed to three
factors. These factors were presence of cumulus clouds in the afternoon, variation in
precipitation amounts across a watershed, and differences in the soil water availability in
the soil profile. These studies demonstrate that there is spatial and temporal variation
present in evapotranspiration from agricultural surfaces.
Evapotranspiration is a process controlled by the available energy, gradient of water vapor,
availability of water for evaporation, and the gradient of windspeed as the transport
process. The linkages among these parameters can be more easily seen in an expanded
mathematical description of the latent heat flux (λE) given as
=
[1]
where λ is the latent heat of vaporization (J kg
-1
), ρ the density of air (kg m
-3
), m the ratio of
molecular weight of water vapor to than of air (0.622), P the barometric pressure (kPa), e
s
the
saturation vapor pressure, e
a
the actual vapor pressure of the air immediately above the
surface, r
c
the canopy resistance for water vapor transfer (s m
-1
), and r
av
the aerodynamic
resistance for water vapor transfer (s m
-1
). There has been much written about the linkages
among these parameters; however, for a surface, evapotranspiration must be placed in
context of the surface energy balance so that the balance of energy is expressed as
−−= [2]
where R
n
is the net radiation at the surface (J m
-2
s
-1
), G the soil heat flux (J m
-2
s
-1
), and H the
sensible heat flux (J m
-2
s
-1
). It is the combination of the various factors which gives rise to
the potential spatial and temporal variation in evapotranspiration. For example, the annual
variation in solar radiation causes the amount of energy available for evapotranspiration to
vary in a predictable way throughout the year. Farmer et al. (2003) found that climate and
landscape were the two critical affecting the soil water balance. Kustas and Albertson (2003)
observed spatial variation across the landscapes and proposed that our understanding of the
critical knowledge gaps affecting spatial and temporal variation in evapotranspiration is
lacking.
Measurements of energy balance components and estimates of evapotranspiration from Eq.
1 or 2 are often conducted over a single site within a production field or a landscape. The
assumption from this measurement is that these values represent that particular surface
with sufficient accuracy from which we derive an understanding of the dynamics of the
surface. There are few studies in the literature which have directly measured
evapotranspiration within a field to quantify the spatial variation and the factors which
Spatial and Temporal Variation in Evapotranspiration
5
create variation. The studies mentioned above have used remote sensing imagery as a
surrogate for the energy balance and their results show there is spatial variation at relatively
small scales; however, these scales are still often larger than areas within a production field.
We have been addressing the problem of quantifying the spatial and temporal variation in
evapotranspiration through a series of related studies across corn and soybean fields in
central Iowa. These studies provide us insights into how crop management interacts with
the landscape to induce variation in evapotranspiration.
2. Methodological approach
2.1 Energy balance measurements
The experimental site for these studies is located in central Iowa in a production field typical
of the area on large (30-35 ha) fields located at 41.967° N, 93.695° W on a Clarion-Nicollet-
Webster Soil Association using micrometeorological measurements of H
2
O vapor and CO
2
exchanges above the canopy using an energy approach described by Hatfield et al., (2007).
The energy balance approach used in these studies combines fast response of CO
2
and H
2
O
vapor signals with sonic anemometers, net radiation components, soil heat flux, and surface
temperature. The use of this approach requires a large area to meet the fetch requirements
and data have been collected at this site since 1998 where the data capture rate for these
systems is greater than 95% (Hernandez-Ramirez et al., 2009).
Turbulent fluxes of sensible and latent heat (H & LE) and CO
2
were measured using the
eddy covariance (EC). Each EC system is comprised of a three-dimensional sonic
anemometer (CSAT3 Campbell Scientific Inc. Logan, UT
1
) and a fast response water vapor
(H
2
O) and CO
2
density open path infrared gas analyzer (IRGA) (LI7500 LICOR Inc., Lincoln,
NE). In both the corn and soybean fields, EC instrument height is maintained on the 10 m
towers at approximately 2 h (where h = canopy height in m) above the surface. The
sampling frequency for the EC systems was 20 Hz with all of the high frequency data
directly transmitted to the laboratory.
Ancillary instrumentation on each tower includes a 4-component net radiometer (R
n
) (CNR-
1 Kipp & Zonen Inc., Saskatoon, Sask.), soil heat flux plates (G) (REBS HFT-3) Cu-Co Type T
soil thermocouples, two high precision infrared radiometric temperature sensors (IRT 15º
fov) (Apogee Instruments Inc., Logan, UT) and an air temperature/ relative humidity (T
a
)
(RH) sensor (Vaisala HMP-35, Campbell Scientific Inc. Logan UT). The R
n
, air
temperature/humidity and one IRT (45° angle of view) sensor are mounted 4.5 m above
ground level (AGL). The second IRT sensor is located 0.15 m AGL with a nadir view
providing continuous radiometric temperatures of the soil surface. Four soil heat flux plates
are placed 0.06 m below the soil, two within the plant row and two within the inter-row
space. Pairs of soil thermocouples are placed 0.02 and 0.04 m below the surface and above
each soil heat flux plate. Soil water content in the top 0.1m at each site will be measured
with Delta-T Theta Probes (Dynamax Houston TX) and together with soil temperature data
used to compute the storage component of the soil heat flux. The sampling frequency for the
ancillary instrumentation is 0.1 Hz (10 s) with measured values stored as 10 min averages.
2.2 Field scale studies
To evaluate the impact of management on evapotranspiration, production sized fields have
been used as experimental units because of the need to quantify the effects of N
management on crop growth and yield and water use across a series of soil types. Fields
Evapotranspiration – From Measurements to Agricultural and Environmental Applications
6
range in size from 32 to 96 ha and are located in the Clarion-Nicollet-Webster Soil
Association in central Iowa within the Walnut Creek watershed. This 5,400 ha watershed
has been used for extensive research on environmental quality in relation to farming
practices as described by Hatfield et al. (1999). Nitrogen management practices have varied
across each year in response to the observations obtained from these experiments. The goal
of these experiments has been to quantify the interactions of water and N across soil types
with different N management practices. The most intensive studies have been conducted
within a 60 ha field divided into two fields in a corn-soybean rotation with the primary
emphasis on the corn portion of the rotation. The corn hybrid grown in these studies was
Pioneer 33P67
1
for the duration of the study. The management practices placed different N
rates in the field in large strips of 10 ha so the field was divided into no more than three
strips in any one year. Within the field plant sampling, energy balance and crop yield plots
were located within a given soil type. In this field, the predominant soils are Clarion,
Canisteo, and Webster soils. Within each soil type and N management practice a plot area
were identified and marked with GPS coordinates in order to locate the exact area among
growing seasons.
Nitrogen management practices have been similar from 1997 through 2001. Nitrogen rates
applied in 1997 and 1998 using a starter application at planting of 56 kg ha
-1
only with the
second treatment having the N starter rate and the sidedress rate determined by the Late
Spring Nitrate Test (LSNT). The third treatment was the starter plus a rate to represent a
non-limiting N rate of an additional 168 kg ha
-1
. In 1999, 2000, and 2001 N application was
modified to further refine rates based on leaf chlorophyll measurements and soil tests
obtained from the 1997 and 1998 experiments. The rates applied were 56, 112, 168, or 232 kg
N ha
-1
to different soils, planting rates, and plant population densities (75,000 and 85,000
plants ha
-1
). In 2000 and 2001, N was applied as either anhydrous ammonia in the fall or
liquid urea anhydrous (UAN) in the spring at planting with a sidedress application. These
applications were applied with production scale equipment to the field. Soil N
concentrations were measured prior to spring operations, after planting, and at the end of
the growing season after harvest to a soil depth of 1.5 m using a 5 cm core. Cores were
subdivided into depth increments to estimate the N availability throughout the root zone at
each of the sampling times. Sample position was recorded with a GPS unit to ensure
accurate location of each subsequent sample.
2.3 Watershed scale studies
A watershed scale was conducted in the Walnut Creek Watershed in central Iowa located 5
km south of Ames, Iowa (4175 N, 9341W) as part of an ongoing long-term monitoring
effort to assess interactions of crop water use, CO
2
uptake, and yield as a function of
nitrogen management for corn and soybeans. Walnut Creek Watershed is a 5100 ha
watershed of intensive corn and soybean production fields ranging in size from 40-160 ha.
These two crops occupy approximately 85% of the land area in the watershed. The
topography of the watershed and surrounding areas are characterized by flat to gently
rolling terrain with elevations in the watershed ranging from 265 – 363 m with the lowest
elevations situated on the eastern end of the watershed where the Walnut Creek drains.
Details of production, tillage and nutrient management systems within the watershed are
described in Hatfield et al. (1999).
1
Mention of trade names or commercial products in this article is solely for the purpose of providing
specific information and does not imply recommendation or endorsement by the U.S. Department of
Agriculture.
Spatial and Temporal Variation in Evapotranspiration
7
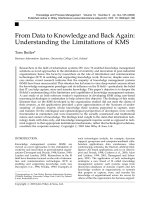
To most extensive and intensive experiment was conducted in 2002 as part of a remote sensing
soil moisture experiment (SMEX02) being was conducted across the Walnut Creek Watershed.
This study provided the opportunity to place 12 eddy covariance (EC) stations across the
watershed to measure and evaluate the spatial and temporal variation among fluxes across
typical corn and soybean production fields in the Upper Midwest region. These stations were
in operation during the intensive measurement period of the remote sensing campaign (Kustas
et al., 2003) and continued to record measurements until late August 2002. These sites were
distributed across the Walnut Creek watershed as shown in Fig 1 and sites 10 and 11 represent
in the intensive field sites for the experiments conducted since 1998 on combinations of
nitrogen management and water across soils types described above. For each site in the field
the soil type was extracted from the soil map from Boone or Story County, Iowa. Eddy
covariance sites were located in a range of soil types typical of central Iowa and in most fields
the location represented over 0.20 of the total area in the field. The primary difference among
the soils was the soil water holding capacity in the upper 1 m of the soil profile (Table 1). This
provided an excellent opportunity to not only measure and evaluate differences in turbulent
fluxes between corn and soybeans but also the spatial and temporal variability of turbulent
flux exchange of CO
2
and H
2
O across the agricultural landscape. The full details of the
SMCAEX study are described in Kustas et al. (2005).
Fig. 1. Distribution of the energy balance and evapotranspiration measurement sites across
Walnut Creek watershed in 2002.
Evapotranspiration – From Measurements to Agricultural and Environmental Applications
8
Site
Crop Soil Type
Fraction of
Field
Soil Water Holding
Capacity
(mm for upper 1 m)
3 Soybean
Clarion, fine-loamy, mixed, mesic
Typic Hapludolls
0.30 212
6 Corn
Clarion, fine-loamy, mixed, mesic
Typic Hapludolls
0.24 212
10 Corn
Nicollet, Fine-loam
y
, mixed, mesic
Aquic Hapludolls
0.16 220
11 Soybean
Harps, Fine-loamy, mesic Typic
Calciaquolls
0.18 221
13 Soybean
Harps, Fine-loamy, mesic Typic
Calciaquolls
0.12 221
14 Soybean
Clarion, fine-loamy, mixed, mesic
Typic Hapludolls
0.24 212
25 Corn
Spillville, Fine-loamy, mixed,
mesic Cumulic Hapludolls
0.41 214
33 Corn
Nicollet, Fine-loam
y
, mixed, mesic
Aquic Hapludolls
0.10 220
151 Corn
Clarion, fine-loamy, mixed, mesic
Typic Hapludolls
0.34 212
152 Corn
Canisteo, Fine-loamy, mixed
(calcareous), mesic Typic
Haplaquolls
0.33 209
161 Soybean
Clarion, fine-loamy, mixed, mesic
Typic Hapludolls
0.35 212
162 Soybean
Clarion, fine-loamy, mixed, mesic
Typic Hapludolls
0.35 212
Table 1.
3. Observations across scales
3.1 Temporal variation among years
Variation among years for evapotranspiration in rainfed areas is dependent upon the
amount of precipitation stored within the soil profile. If there is adequate storage capacity,
then annual variation in evapotranspiration will more dependent upon the available energy
than upon the amount of available water. In areas with soils with limited soil water holding
capacity then a more direct relationship will be evident. Across central Iowa, which would
be typical of the Corn Belt, there is large annual variation in evapotranspiration as
evidenced in the data from 1998 (Fig.2), 1999 (Fig. 3), and 2000 (Fig. 4).
Two important details are evident from these three years which represent fairly typical years
in central Iowa. First, there is little evapotranspiration occurring the winter months and fall as
evidenced by the relatively small cumulative values during these intervals. Evapotranspiration
does not begin to become significant portion of the energy balance (Eq. 2) until about DOY 100
and begins to diminish after DOY 300 (Figs. 2, 3 and 4). These seasonal patterns are consistent
among years with very similar times in which evapotranspiration values begin to increase in
Spatial and Temporal Variation in Evapotranspiration
9
the spring and decrease in the fall. Second, cumulative values of evapotranspiration are
relatively smooth compared to precipitation values, which occur in infrequent storms, not
every day, and throughout the year. Third, annual total values of evapotranspiration are more
similar among years than are annual precipitation totals. As an example, total
evapotranspiration for 1998 was 476 mm, 1999 – 500 mm, and 2000 – 433 mm while total
precipitation for 1998 was 933, for 1999 – 743, and for 2000 – 454 mm. Temporal variation in
evapotranspiration among years will be dependent upon the energy available and at the
annual time scale there are minor differences among years.
1998
Day of Year
0 100 200 300 400
Cumulative Precipitation or Evapotranspiration (mm)
0
200
400
600
800
1000
Precipitation
Evapotranspiration
Fig. 2. Annual cumulative precipitation and evapotranspiration for a corn production field
for Central Iowa in 1998.
1999
Day of Year
0 100 200 300 400
Cumulative Precipitation or Evapotranspiration (mm)
0
200
400
600
800
Precipitation
Evapotranspiration
Fig. 3. Annual cumulative precipitation and evapotranspiration for a corn production field
for Central Iowa in 1999.
Evapotranspiration – From Measurements to Agricultural and Environmental Applications
10
2000
Day of Year
0 100 200 300 400
Cumulative Precipitation or
Evapotranspiration (mm)
0
100
200
300
400
500
Precipitation
Evapotranspiration
Fig. 4. Annual cumulative precipitation and evapotranspiration for a corn production field
for Central Iowa in 2000.
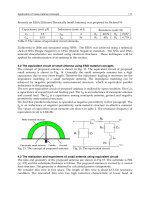
3.2 Spatial variation within production fields
Spatial variation of evapotranspiration within fields is more significant than often thought
based on the results shown in Figs 2, 3, and 4. It is assumed that evapotranspiration across a
field would be relatively consistent because the energy balance components would be
consistent. We have examined this aspect across both corn and soybean fields and found
there is a large spatial variation induced by soil water holding capacity. An example of this
variation is shown in Fig. 5 for evapotranspiration from a corn crop in an Okoboji soil
compared to a Clarion soil and a Nicollet soil. The Okoboji soil is a high organic matter soil
(soil organic matter of 7-9%) compared to a Nicollet soil (soil organic matter of 3-5%) and a
Clarion soil (soil organic matter of 1-2%). These soils represent three different positions on
the landscape with the Clarion soil being the upper part of the landscape in the Clarion-
Nicollet-Webster soil association while the Okoboji soils are the lower part of the landscape
and often considered to be poorly drained soils while the Nicollet soil is about midway on
the slope.
There are large differences in the seasonal totals among these three soils (Fig. 5). The
seasonal totals for the Okoboji and Nicollet soils are quite similar at 575 and 522 mm,
respectively while the Clarion soil has an annual total of 310 mm. There are differences
among the patterns of evapotranspiration throughout the year for the three soils. These
types of patterns are not uncommon based on our multiple years of measurements across
this field in which we have measured evapotranspiration in different soils. In this field, the
evapotranspiration from the Okoboji soil begins slower at the beginning of the season
because the tillage practice leaves this area with crop residue which decreases soil water
evaporation rates and also the plant growth tends to be slower in this area of the field. In the
Nicollet soils, there is more soil water evaporation and earlier plant growth because these
areas of the field show an increased rate of growth because of the more favorable growth
conditions. In contrast, the Clarion soils behave similar to the Nicollet soils in the early
season but then at as the crop grows there is insufficient soil water to maintain the water
Spatial and Temporal Variation in Evapotranspiration
11
supply and evapotranspiration becomes limited. This is a common occurrence in these fields
and we often observe evapotranspiration totals in the Clarion soils at least half of the soils
with the higher water holding capacity. These areas of the field also exhibit water deficits
throughout the growing season because the soil is unable to supply the water required to
meet the atmospheric demand and the canopy resistance term (Eq. 1) is much higher in
these plants than in other soils within the field. There is a spatial variation of
evapotranspiration within a field induced by the soil water holding capacity and this will
influence the ability of the plant to be able to extract water to meet atmospheric demand.
1997 Corn
150 kg ha
-1
N
Day of Year
100 150 200 250 300
Evapotranspiration (mm)
0
100
200
300
400
500
600
700
Clarion Soil
Okoboji Soil
Nicollet Soil
Fig. 5. Seasonal cumulative evapotranspiration from a corn crop grown in an Okoboji and
Clarion soil within an individual field during 1997.
Spatial variation of evapotranspiration within a field can be affected by the effect of soil
management practices on the crop growth patterns. We have investigated the interactions of
nitrogen management with evapotranspiration across production fields. These seasonal
totals are confined to the growing season because of the minimal amount of
evapotranspiration during the other times of the year as shown in the earlier section.
Nitrogen management interacted with soil type in the seasonal evapotranspiration totals
reflective of the effect of nitrogen on growth in the different soils. In this study, we
compared water use and crop growth in a Webster and Clarion soil. The Webster soil is
similar to the Nicollet soil with soil organic matter contents of 3-5%. In this study, the
seasonal evapotranspiration totals for both the fall and spring nitrogen application rates
showed differences among soils with the Clarion soil having less evapotranspiration than
the Webster soils (Fig. 6). There is an interesting effect of nitrogen application rates in this
study because the application of 200 kg ha
-1
on the Clarion soil actually reduced
evapotranspiration compared to the 100 kg ha
-1
rate (Fig. 6). We have observed this response
in different years because the low water holding capacity soils cannot supply adequate
water for evapotranspiration and there is actually a reduction in plant growth from the
excess nitrogen applied. The reverse effect is found in the Webster soil where there is no
Evapotranspiration – From Measurements to Agricultural and Environmental Applications
12
difference in evapotranspiration rates until late in the growing season when the additional
nitrogen from the 200 kg ha
-1
rate is able to sustain growth and maintain evapotranspiration
rates compared to the 100 kg ha
-1
rate (Fig. 6).
Corn Water Use 2000
Day of Year
100 120 140 160 180 200 220 240 260 280
Water Use (mm)
0
100
200
300
400
500
600
Clarion Spring N (100 kg/ha)
Webster Spring N (100 kg/ha)
Clarion Fall N (200 kg/ha)
Webster Fall N (200 kg/ha)
Fig. 6. Seasonal cumulative evapotranspiration values for corn in central Iowa from two
different soils in 2000 with different nitrogen rates and application times.
Spatial variation patterns within a field have often been assumed to be minimal; however,
these differences are larger than expected because of the differences in soil water holding
capacity. The seasonal evapotranspiration patterns represent the combined effects of soils
and management and these differences will affect the ability of a crop to endure water stress
during the growing season. In rainfed environments, it is critical for precipitation events to
maintain the soil water supply at an optimum level and if there is a limitation in the ability
of the soil to store water and meet the evapotranspiration rate then crops will undergo water
deficit stress.
3.3 Spatial variation among production fields
There have been few studies which have attempted to quantify the differences in
evapotranspiration rates among fields. The primary reason is the expense of the array of
equipment and the labor requirements to establish this observational network. As part of
the SMEX2002 experiment described by Kustas et al. (2003) we were able to establish a
network of energy balance stations and eddy correlation equipment across Walnut Creek
watershed in central Iowa as shown in Fig. 1. The details of the study have been reported
by Hatfield et al. (2007) and they observed variability among fields was due to three
factors. Within a day, differences in the energy balance components and
evapotranspiration was caused by the presence of cumulus clouds. Clouds are not evenly
distributed across the watershed and differentially shade one area of the watershed more
than another. These effects do not persist from one day to the next because the presence of
clouds over a given field changes among days. However, these effects do induce
evapotranspiration differences among fields.
Spatial and Temporal Variation in Evapotranspiration
13
The second factor which caused differences among fields was the spatial variation in
precipitation events across the watershed. In temperate climates it is not unusual for
convective rainfall amounts to be variable across space and this changes the amount of
water available for evaporation. The scale of differences induced by variable precipitation is
difficult to assess and across a small area (10 km
2
) there could large differences in
evapotranspiration. These differences may occur as a result of increased soil water
evaporation from the soil surface when the plants are small because of the exposed soil.
These differences caused by differential rainfall would be expected to diminish as the crop
canopy develops because the amount of exposed soil would decrease and
evapotranspiration would be dominated by transpiration from the canopy.
The third factor which caused a difference in the spatial variation in evapotranspiration is
related to the soil water holding capacity as shown in Table 1. Across the different sites for
the experiment in 2002, Hatfield et al. (2007) observed differences among sites as shown in
Figs. 7 and 8. These differences were large for the short-term observations in this study.
Walnut Creek 2002
Day of Year
160 170 180 190 200 210 220 230 240
Cumulative Evapotranspiration (mm)
0
50
100
150
200
250
300
Corn Site 6
Corn Site 151
Corn Site 24
Corn Site 25
Fig. 7. Cumulative evapotranspiration across four corn fields with detailed measurements in
Walnut Creek watershed in 2002.
These observations reveal important components of factors which induce spatial variation in
evapotranspiration. For the four corn fields, there was a significant difference in the
cumulative evapotranspiration for field 25 compared to the other fields (Fig. 7). In addition
to the measurements being made in the soil with a lower water holding capacity, this field
also had less rainfall during this portion of the growing season. These differences occurred
early in the season and persisted throughout the period of measurements. This is in contrast
to the other three fields in which there were similar evapotranspiration values until late in
the growing season in which soil water holding capacity became the dominant factor. This
Evapotranspiration – From Measurements to Agricultural and Environmental Applications
14
degree of differential response would be expected if the energy input and rainfall amounts
were the same but the storage factor changed.
In the soybean fields, there was little difference in the early season evapotranspiration
among field and the differences among fields began to appear when the growth of the plant
achieved full cover and water use rates were at their peak (Fig. 8). Separation among the
fields was due to the soil water holding capacity of the field in which measurements were
being made. The differences among fields were as large as 25-30 mm which is significant in
terms of crop water use requirements and crop growth.
2002
Day of Year
160 170 180 190 200 210 220 230 240
Cumulative Evapotranspiration (mm)
0
50
100
150
200
250
300
Soybean Site 3
Soybean Site 161
Soybean Site 162
Fig. 8. Cumulative evapotranspiration across four soybean fields with detailed
measurements in Walnut Creek watershed in 2002.
In both the corn and soybean observations, there are some notes of caution in terms of
understanding spatial and temporal variation in evapotranspiration. Spatial variation of
evapotranspiration is a result of a combination of factors and care must be exercised in the
placement of energy balance and evapotranspiration equipment within fields and across
landscapes in order to capture information from sites representative of the area. These
differences can be controlled; however, rainfall patterns and cumulus cloud formation on
the shorter time intervals cannot be controlled but should be measured to ensure proper
comparisons among sites can be conducted. Overall, the spatial variation in
evapotranspiration is due to a complex set of interactions affected the evapotranspiration
at a given site. One of the overlooked factors is the soil water holding capacity and the
depth of the water extraction caused by differences in rooting depth. These are often
considered to be small; however, in our observations these factors can account for 100-200
mm of seasonal water use differences among sites. These differences coupled with spatial
variation in rainfall during the growing season can lead to even greater differences among
Spatial and Temporal Variation in Evapotranspiration
15
sites. In temperate regions, the spatial pattern of rainfall is a random event while the
spatial variation in soil characteristics is a fixed position on the landscape causing the
exact seasonal pattern of evapotranspiration for a given year to be a combination of the
soil and weather patterns. Understanding the factors causing spatial variation in
evapotranspiration will lead to improved capabilities for water management in cropping
systems.
4. References
Eichinger, W.E., Cooper, D.I., Hipps, L.E., Kustas, W.P., Neale, C.M.N. & Prueger, J.H.
(2006). Spatial and temporal variation in evapotranspiration using Raman lidar.
Adv. Water Res. 29: 369-381.
Farmer, D., Sivapalan, M. & Jothityangkoon, C. (2003). Climate, soil, and vegetation controls
upon the variability of water balance in temperate and semiarid landscapes. Water
Resource Res. 39:1035, doi:10.1029/2001WR00003238.
Hatfield, J.L., Prueger, J.H. & Kustas, W.P. (2007). Spatial and temporal variation of energy
and carbon fluxes in Central Iowa. Agron. J. 99:285-296.
Hatfield J.L., Jaynes, D.B., Burkart, M.R., Cambardella, C.A., Moorman, T.B., Prueger, J.H. &
Smith, M.A. (1999). Water Quality in Walnut Creek Watershed: Setting and
Farming Practices. J. Environ. Qual. 28:11-24.
Hernandez-Ramirez, G., Hatfield, J.L., Parkin, T.B., Prueger, J.H. & Sauer, T. J. (2010).
Energy balance and turbulent flux partitioning in a corn-soybean rotation in the
Midwestern U.S. Theor. Appl. Climatol. 100:79-92.
Kustas, W.P. & Albertson, J.D. (2003). Effects of surface temperature on land atmosphere
exchange: A case study from Monsoon 90. Water Resource Res. 39:1159,
doi:10.1029/2001WR001226.
Kustas, W.P., Hatfield, J.L. & Prueger, J.H. (2005). The Soil Moisture Atmosphere Coupling
Experiment (SMACEX): Background, Hydrometeorological Conditions and
Preliminary Findings. J. Hydrometeorol. 6:791-804.
Kustas, W.P., Prueger, J.H., Hatfield, J.L., MacPherson,J.I., Wolde, M., Neale, C.M.U.,
Eichinger, W.E., Cooper, D.I., Norman, J.M. & Anderson, M. (2003). An overview
of the Soil-Moisture-Atmospheric-Coupling-Experiment (SMACEX) in central
Iowa. American Meteorological Society, 17
th
Conference on Hydrology, Long
Beach, CA Feb. 09-12, pp 1-5.
Li, Z.Q., Yu, G.R., Li, Q.K., Fu, Y.L & Li, Y.N. (2006). Effect of spatial variation on areal
evapotranspiration in Haibei, Tiber plateau, China. Int J. Remote Sens. 27:3487-
3498.
Mo, X.G., Liu, S.X., Lin, Z.H. & Zhao, W.M. (2004). Simulating temporal and spatial
variation in evapotranspiration over the Lushi Basin. J. Hydrology. 285:125-142.
Zhang, S.W., Yei, Y.P., Li, H.J. & Wang, Z. (2010). Temporal-spatial variation in crop
evapotranspiration in Hebei Plain, China. J. Food Agric. Environ. 8:672-677.
Zhang, X.Q., Ren, Y., Yin, Z.Y., Lin, Z.Y, & Zheng, D. (2009). Spatial and temporal
variation patterns of reference evapotranspiration across the Qingahi-Tibetan
Plateau during 1971-2004. J Geophysical Res. Atmos. 114: D15105.