Curcumin i knoevenagel’s condensates and their schiff’s bases as anticancer agents
Bạn đang xem bản rút gọn của tài liệu. Xem và tải ngay bản đầy đủ của tài liệu tại đây (1.61 MB, 13 trang )
Curcumin-I Knoevenagel’s condensates and their Schiff’s bases
as anticancer agents: Synthesis, pharmacological and simulation
studies
q
Imran Ali
a,
⇑
, Ashanul Haque
a
, Kishwar Saleem
a
, Ming Fa Hsieh
b
a
Department of Chemistry, Jamia Millia Islamia (Central University), New Delhi 110025, India
b
Department of Biomedical Engineering, Chung Yuan Christian University 200, Chung Pei Rd., Chung Li, Taiwan
article info
Article history:
Received 17 February 2013
Revised 8 April 2013
Accepted 9 April 2013
Available online 18 April 2013
Keywords:
Anticancer agents
Curcumin-I derivatives
Docking studies
DNA binding and hemolysis and cell line
profiles
abstract
Pyrazolealdehydes (4a–d), Knoevenagel’s condensates (5a–d) and Schiff’s bases (6a–d) of curcumin-I
were synthesized, purified and characterized. Hemolysis assays, cell line activities, DNA bindings and
docking studies were carried out. These compounds were lesser hemolytic than standard drug doxorubi-
cin. Minimum cell viability (MCF-7; wild) observed was 59% (1.0
l
g/mL) whereas the DNA binding con-
stants ranged from 1.4 Â 10
3
to 8.1 Â 10
5
M
À1
. The docking energies varied from À7.30 to À13.4 kcal/mol.
It has been observed that DNA-compound adducts were stabilized by three governing forces (Van der
Wall’s, H-bonding and electrostatic attractions). It has also been observed that compounds 4a–d pre-
ferred to enter minor groove while 5a–d and 6a–d interacted with major grooves of DNA. The anticancer
activities of the reported compounds might be due to their interactions with DNA. These results indicated
the bright future of the reported compounds as anticancer agents.
Ó 2013 Elsevier Ltd. All rights reserved.
1. Introduction
Cancer is considered as the second most lethal disease respon-
sible for $21% annual deaths globally.
1
Approximately, 7.6 million
die every year worldwide due to cancer, which is expected to reach
up to 13 million in 2030. In the developing and under developed
countries lung, breast, colorectal, stomach and liver cancers are
most common ones. On the other hand, lung and breast cancers
among men and women are more prevalent in developed coun-
tries. About 1.63 million new cancer cases were expected to be
diagnosed in US alone in 2012.
2
As per a report published in The
Lancet,
3
total deaths due to cancer were 0.55 million in 2010 in In-
dia. It has been observed that nearly 23% deaths occurred due to
oral cancer among men. On the other hand, the death percentages
were 12.6% and 11.4% due to stomach and lung cancers in men. In
women, 17.0% and 10.2% cases of cervical and breast cancers were
reported. In this way, number of cancer patients is increasing at an
alarming rate. Therefore, there is an urgent need to curb this men-
ace. For this purpose, chemotherapy is the most commonly used
treatment worldwide.
4
But it has several serious side effects and
problems. These include promiscuity (binding to unwanted
targets), lack of selectivity and effectiveness (especially at late
stages). These limitations are compelling scientists to discover
more safe and effective anticancer agents. Recently, Newman and
Cragg,
5
emphasized the importance of natural products in cancer
drug development. As per the authors, out of 175 anticancer agents
(in the market as well as in clinical trials), 85 are directly derived
from nature. Besides, 131 are also indirectly connected to the nat-
ural sources.
5
Some other reviews
6,7
also highlighted the impor-
tance of natural products in cancer chemotherapy. The natural
products (with no or least side effects) are being exploited for
developing effective anti-cancer drugs, especially, by modifying
their molecular structures. Among several natural products, the ac-
tive constituent of Curcuma longa, (curcumin) is used as precursor
for developing various medicines. It is due to its fair pharmaceuti-
cal properties including anticancer.
8–10
Low pharmaceutical activ-
ities of curcumin-I are due to its low plasma concentration and
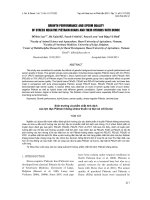
poor membrane permeation. From the structure activity relation-
ship (SAR), it has been established that two C@C bonds between
1,3-dicarbonyl and 3-methoxy, 4-hydroxyphenyl moieties on each
side (Fig. 1) are important sites to enhance the pharmaceutical
activities
11,12
of curcumin-I.
Several modifications, especially, at the methylene centre of
curcumin-I have been reported to increase its biological activ-
ity.
13,14
Knoevenagel’s condensates of curcumin-I are considered
to be the effective derivatives. Qiu et al.
15
reported 4-arylidene
analogues of curcumin-I, which showed better anticancer activity
than native curcumin-I. Simoni et al.
16
developed isoxazole
0968-0896/$ - see front matter Ó 2013 Elsevier Ltd. All rights reserved.
/>q
Part of this paper was presented in ‘‘International Conference on Chemistry
Frontiers and Challenges-2013’’, Department of Chemistry, Aligarh Muslim Univer-
sity, Aligarh (UP), India.
⇑
Corresponding author. Tel.: +91 9211458226.
E-mail addresses: , (I. Ali).
Bioorganic & Medicinal Chemistry 21 (2013) 3808–3820
Contents lists available at SciVerse ScienceDirect
Bioorganic & Medicinal Chemistry
journal homepage: www.elsevier.com/locate/bmc
derivative of curcumin-I, which inhibited the growth of MCF-7
(MDR) human cancer cell lines moderately. Earlier, we have also
reported Knoevenagel’s condensates of curcumin-I and their ruthe-
nium metal ion complexes. It was observed that the synthesized
compounds had good anticancer activities for MDR-MB-231,
HepG2, HeLa and HT-29 cell lines.
17
The literature survey and
our own experience dictate us that the inclusion of a heterocyclic
moiety increases the activity of the molecules in most of the cases.
Among heterocycles, pyrazoles have gained good reputation, espe-
cially, in the field of anticancer drug development.
18–20
Figure 2
shows some of the pyrazole moieties, which are under study
worldwide.
18–24
In view of these facts, attempts have been made to incorporate
pyrazolealdehyde moieties into curcumin-I via Knoevenagel’s con-
densation. The resulting derivatives were allowed to react with
semicarbazide to form disemicarbazones (Schiff’s bases). The
developed molecules were purified and characterized by chro-
matographic and spectroscopic techniques. DNA binding studies,
CH
3
H
3
C
O
HO OH
O
OO
Important group to show
anticancer activities.
Substitution at active methylene centre yields
better cytotoxic compounds than curcumin
.
1,3
β
-diketone system substitution also enhances its
biological application.
Figure 1. Important sites of the curcumin molecule responsible for its anticancer activities.
Figure 2. Structure of some pharmacologically active compounds bearing (anticancer) pyrazoles moiety.
I. Ali et al. /Bioorg. Med. Chem. 21 (2013) 3808–3820
3809
hemolytic assays and anticancer studies on MCF-7(wild) cell line
have also been carried out. In vitro DNA bindings and anticancer
activities of the developed compounds have been verified by sim-
ulation studies. The efforts have also been made to develop the
mechanism of action (interactions with DNA grooves) at supramo-
lecular level using the data of above cited studies. Besides, the fu-
ture perspectives of the reported compounds were also predicted.
The results of these findings are discussed herein.
2. Results
2.1. Chemistry
Phenyl hydrazones were prepared by using phenyl hydrazine
(1) ortho, meta and para substituted acetophenone (2a–d). The so
formed ortho, meta and para-phenyl hydrazones (3a–d) were used
to synthesize ortho, meta and para-substituted pyrazolealdehydes
(4a–d) by employing Vilsmeier–Haack’s reaction. Knoevenagel’s
condensates (5a–d) were prepared by the reaction of pyrazolealde-
hydes with curcumin-I in the presence of catalytic amount of
piperidine. The final products (6a–d; Scheme 1) were prepared
by the reaction of Knoevenagel’s condensates (5a–d) with semi-
carbazide hydrochloride. These compounds were washed with
petroleum ether, hexane and DCM/MeOH (99:1 v/v). Furthermore,
the purities of these compounds were confirmed by recording their
melting points, UV–vis spectra and elemental analyses. The struc-
tures of the synthesized compounds were determined by FT-IR,
1
H
NMR and ESI-MS spectral studies.
2.2. Discussion
2.2.1. Characterization of the products
The products (4a–d) were characterized by the presence of a
characteristic
1
H NMR signal of pyrazole protons in the range of
8.52–9.21 ppm, while aldehydic proton appeared in the range of
9.90–10.10 ppm. A strong IR stretching frequency in the region
of 1690–1680 cm
À1
was observed in compounds 4a–d, indicating
the presence of carbonyl groups. The values of ESI-MS (m/z) were
found 293.94 for 4a, 287.17 for 4b, 316.20 for 4c and 283.15 for
4d; confirming the formation of pyrazolealdehydes. The forma-
tion of compounds 5a–d via Knoevenagel’s condensation was
confirmed by the absence of aldehydic protons (at 10.10 ppm)
and the presence of arylidene proton (@CH-Ar) in the range of
7.77–7.82 (s, @CH-Ar). It was observed that C–H stretching fre-
quency (methylene center, both assym./symm.) of curcumin was
replaced by new conjugated –C@CH-Ar stretching frequency
(1601 cm
À1
). ESI-MS spectra of Knoevenagel’s condensates (5a–
d) showed a molecular ion peak at (m/z) 642.30 for 5a, 633.12
for 5b, 666.88 for 5c and 633.21 for 5d. These results were con-
crete indication of reaction completion as per Scheme 1. The
resulting condensates (5a–d) were converted to their correspond-
ing Schiff’s bases (6a–d), which were characterized by the shifting
of C@O frequency at 1687–1598 cm
À1
(C@N– stretching fre-
quency). The values of ESI-MS were found to be m/z 727.39 for
6a, 729.29 for 6b, 727.80 for 6c and 748.56 for 6d. All these spec-
tral studies confirmed that the compounds 4a–6d were formed as
per Scheme 1.
H
3
C O
R
NH
H
2
N
CH
3
N
N
H
R
N
N
H
O
R
N
N
H
O
R
O
HO
OO
O
OH
H
3
C
CH
3
O
HO
OO
O
OH
H
3
C
CH
3
H
N
N
R
O
HO
OO
O
OH
H
3
C
CH
3
H
N
N
R
N
H
H
2
N
NH
2
O
O
HO
NN
O
OH
H
3
C
CH
3
H
N
N
R
HN
H
2
N
O
NH
NH
2
O
CHCl
3
, Reflux
5a-d
+
2
Reflux
6a-d
R = 4-NO
2
2-OH
3-NO
2
4-Cl
4a-d
+
R = 4-NO
2
2-OH
3-NO
2
4-Cl
Curcumin
5a-d
+
EtOH, Reflux
POCl
3
, DMF
4a-d
3a-d
R = 4-NO
2
2-OH
3-NO
2
4-Cl
2a-d
1
where 4a = 4-NO
2
, 4b = 2-OH, 4c = 3-NO
2
, 4d = 4-Cl
Scheme 1. Synthesis of pyrazolealdehydes (4a–d), curcumin based Knoevenagel condensates (5a– d) and their Schiff bases (6a–d).
3810 I. Ali et al. /Bioorg. Med. Chem. 21 (2013) 3808–3820
2.3. Pharamacological activities
2.3.1. Hemolytic assay
In vitro hemolytic assay is the preliminary method to evaluate
the cytotoxicity of the new compounds.
25
It is an acceptable
screening tool for gauging possible in vivo toxicity to the host
cells.
26
Mammalian RBCs were used to determine the toxicity of
the synthesized compounds due to their freely availability and
easy detection of the lyses products.
As per the standard hemolytic index (ASTM), compounds with
0–2%, 2–10%, 10–20% and 20–40% are considered as non, slightly,
moderate and markedly hemolytic, respectively. On the other
hand, compounds with hemolytic index above 40% are supposed
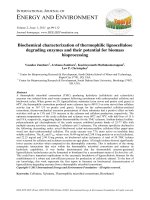
as highly hemolytic in nature. The hemolytic activity of the synthe-
sized compounds, that is, pyrazolealdehydes (4a–d), Knoevenagel’s
condensates of curcumin (5a–d) and their Schiff’s bases (6a–d) are
shown in Figure 3. It is clear from this figure that 610%, 15%, 20%
and 25% toxicities were shown by 4a, 4c, 4d and 5a; 5c and 6a;
4b, 5b, 5d, 6c and 6d; 6b, respectively, at concentration100
l
g/
mL. These results indicated the order of increasing toxicities as
6b > 5b > 4b > 6d > 6c = 5d > 5c > 6a = 5a > 4c > 4d > 4a. Standard
drug doxorubicin had 42% hemolysis activity at 100
l
g/mL. There-
fore, it may be concluded that compounds 4a, 4c and 4d are
slightly hemolytic, 5a, 6a, 5c, 4b, 5d, 6c and 6d moderately hemo-
lytic and 5b and 6b markedly hemolytic in nature.
2.3.2. DNA binding
UV–vis spectroscopy is one of the most commonly used meth-
ods for the investigation of the interactions of a compound with
DNA.
27
DNA is the primary pharmacological target for many anti-
tumor compounds. Therefore, the study of the interaction of the
new compounds with DNA is quite essential to assess their anti-
cancer activities and a possible mechanism of action. A compound
can bind to DNA either via covalent (in which a labile ligand is re-
placed with a nitrogen atom of DNA base, such as N
7
of guanine) or
non-covalent (such as intercalative, electrostatic and groove bind-
ing) interaction. Normally, a compound bound to DNA through
intercalation results in hypochromism (decrease in absorbance)
and bathochromism (red shift). It is due to the fact that intercala-
tive mode involves a strong stacking interaction between aromatic
chromophore and the base pairs of DNA.
28
It is believed that the
extent of hypochromism depends on the strength of intercala-
tion.
29–32
Generally, electrostatic interaction of a compound with
DNA shows lower hypochromicity with no bathochromic shift
33
(due to decrease of the
p
?
p
⁄
transition energy as
p
⁄
orbital of
the intercalated ligand couples with the orbital of the base pairs).
On the other hand, a compound bound to DNA through covalent
binding results in hyperchromism and red shift owing to breakage
of secondary structure of DNA. The occurrence of red shift indi-
cated the coordination of a compound with DNA through N
7
posi-
tion of guanine.
34
Overall, the outside groove binding is
characterized by no or minor change in UV–vis spectra; occasion-
ally with some hyperchromicity. Contrarily, outside binding with
self-stacking shows quite similar characteristics as the intercala-
tive binding mode but to a lesser extent.
35–37
The absorption spec-
tra of compounds 4a–6d in the absence and presence of DNA are
shown in Figure FS1 (a–l) (Supplementary data). The absorption
spectra of compounds exhibited peaks in the range of 200–
500 nm. The compounds of series 4a–d had one absorption band
in the range of 251–266 nm, while compounds of series 5a–d
and 6a–d showed two bands (Supplementary data, Table TS1). In
series 5a–d, first and second bands ranged from 261 to 275 nm
and 355 to 380 nm. Similarly, in series 6a–d first and second bands
appeared at 265–370 nm and 350–450 nm, respectively (Supple-
mentary data, Table TS1). The band shifting was observed in the re-
gion of 200–450 nm by the addition of DNA. Small shifting of
second band of the compounds of series 6a–d was due to intra li-
gand
p
?
p
⁄
transitions.
38,39
The compounds with different substi-
tuent’s showed different absorption bands, that is, $248–275 nm
for 4a–d (273 nm for 4a , 258 nm for 4b, 256 nm for 4c and
248 nm for 4d). For compounds 5a–6d, two absorptions peaks
were observed, one around 250–260 nm (for 5a–d) and another
in the region of 350–450 nm (for 6a–d). These data indicated bath-
ochromic shift of all the compounds due to the interactions with
DNA. It was also observed that with the addition of different con-
centrations of DNA [0.4–1.2 Â 10
À4
M], the absorption peaks
underwent hyper- and hypo-chromicities for compounds (4a–6d)
(Fig. FS1, Supplementary data), thus, indicating the formation of
DNA-compound adducts.
35
Furthermore, it is interesting to note
that in all the cases, hyper and hypochromic effects were observed
with varying concentrations of DNA, which might be due to differ-
ent types of bonding (covalent and non-covalent).
36
The hyper-
chromic shift at higher concentration of the bands might be due
to the uncoiling of DNA (more bases embedding in DNA ex-
posed).
40
UV–vis data for compounds 4a–6d are given in Table 1
and Table TS1 (Supplementary data). More than one type of
DNA-compound interactions have been formed (partial intercala-
tion + electrostatic attraction) as indicated by the absence of any
fixed isobestic points in titration experiment.
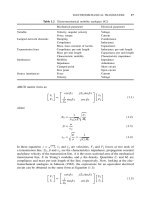
For a ready reference, the absorption spectra of first compound
(4a, 5a and 6a; 2.0 Â 10
À4
M) of all three series; in both absence
and presence (0.4–1.2 Â 10
À4
M) of calf-thymus DNA; are given
in Figure 4a–c. The values of DNA binding constants of these com-
pounds varied from 1.4 Â 10
3
to 8.1 Â 10
5
M
À1
, indicating good
interaction with DNA. The regression analysis was carried out
4a 4b 4c 4d 5a 5b 5c 5d 6a 6b 6c 6d
0
5
10
15
20
25
30
Hemolysis (%)
Compound
Figure 3. Hemolysis assay of the synthesized compounds on rabbit RBC.
Table 1
UV–vis spectral data of the compounds 4a–6d
Compounds
D
k
max
a
(nm) % Hypochromism
b
K
b
(M
À1
)
4a 8 7.7 1.9 Â 10
3
4b 2 6.2 1.4 Â 10
3
4c 2 5.2 2.5 Â 10
3
4d 2 5.6 7.6 Â 10
4
5a 4 12.3 1.4 Â 10
4
5b 1 13 2.1 Â 10
4
5c 1 29 9.4 Â 10
4
5d 3 8.1 7.8 Â 10
5
6a 1 8 2.6 Â 10
4
6b 3 10 3.0 Â 10
4
6c 4 9 9.1 Â 10
4
6d — 11 8.1 Â 10
5
a
For details of wavelength shifts, please see Supplementary data.
b
% Hypochromicity (H%) = [(A
f
À A
b
)/A
f
] Â 100, where A
f
and A
b
represent the
absorbance of free and bound compounds.
I. Ali et al. / Bioorg. Med. Chem. 21 (2013) 3808–3820
3811
200 250 300 350 400 450 500
0.0
0.2
0.4
0.6
0.8
1.0
Absorbance
Wavelength (nm)
A
5.20E-08
5.40E-08
5.60E-08
5.80E-08
6.00E-08
6.20E-08
6.40E-08
0.00E+00 2.00E-05 4.00E-05 6.00E-05 8.00E-05 1.00E-04 1.20E-04 1.40E-04
[DNA]/(ε
a
− ε
f
) M
2
cm
[DNA] M
200 250 300 350 400 450 500
0.0
0.2
0.4
0.6
0.8
1.0
1.2
Absorbance
Wavelength (nm)
B
0.00E+00
1.00E-09
2.00E-09
3.00E-09
4.00E-09
5.00E-09
6.00E-09
0.00E+00 2.00E-05 4.00E-05 6.00E-05 8.00E-05 1.00E-04 1.20E-04 1.40E-04
[DNA]/(ε
a
− ε
f
) M
2
cm
[DNA] M
200 250 300 350 400 450 500
0
1
2
3
4
5
Absorbance
Wavelength (nm)
C
0.00E+00
1.00E-09
2.00E-09
3.00E-09
4.00E-09
5.00E-09
6.00E-09
7.00E-09
8.00E-09
0.00E+002.00E-05 4.00E-05 6.00E-05 8.00E-05 1.00E-04 1.20E-04 1.40E-04
[DNA]/(ε
a
− ε
f
) M
2
cm
[DNA] M
Figure 4. Absorption spectra of compound (A) DNA binding spectra of compound 4a, (B) DNA binding spectra of compound 5a and (C) DNA binding spectra of compound 6a
in the presence of increasing amount of Ct-DNA. Inset: plots of [DNA]/
e
a
À
e
f
(M
2
cm
À1
) versus [DNA] for the titration of CT DNA with compounds. Experimental data points;
full lines, linear fitting of the data. [Compounds] 2.0 Â 10
À4
M, [DNA] 0.4–1.2 Â 10
À4
M.
3812 I. Ali et al. / Bioorg. Med. Chem. 21 (2013) 3808–3820
using Microsoft Excel programme for DNA binding studies. It has
been found that the standard deviation (SD) ranged from ±0.10
to ±0.11 while the correlation coefficient (R
2
) and confidence levels
were 0.9996–0.9999% and 98.5–99.5%, respectively. The order of
DNA binding constants for these compounds was
6d > 5d > 5c > 6c > 4d > 6b > 6a > 5b > 5a > 4c > 4a > 4b. It can be
concluded from these results that the compounds 4a–6d partially
intercalated (4a–d through minor groove while 5a–6d through
major groove, depending upon their sizes) with Ct-DNA.
41
These
results were interesting as pyrazolealdehydes (4a–d) favored to
enter minor grooves while curcumin embedded pyrazole (5a–d)
and their Schiff’s bases (6a–d) preferred major grooves. Literature
data indicated that the compound, forming complex with DNA
minor groove, is stabilized mainly by hydrogen bonds and hydro-
4a 4b 4c 4d 5a 5b 5c 5d 6a 6b 6c 6d
0
20
40
60
80
100
120
Viability
Compound
1 µg/mL
0.1 µg/mL
0.01 µg/mL
0.001 µg/mL
0.0001 µg/mL
Figure 5. MCF-7 percent cell line viabilities of the synthesized compounds at 1.0, 0.1, 0.01, 0.001 & 0.0001
l
g/mL concentrations.
Figure 6a. 3D- and 2D-docking images of compound 4a, depicting its vicinity with DNA.
I. Ali et al. / Bioorg. Med. Chem. 21 (2013) 3808–3820
3813
phobic interactions.
42,43
This fact is well established by DNA titra-
tion experiments and docking studies and can be seen in Fig-
ure 6a–c and Figure FS2–S4 (Supplementary data).Itis
interesting to note that the compounds containing halogen group
(chloro) (4d, 5d and 6d) had high affinity for DNA (higher K
b
val-
ues). On the other hand, compounds containing nitro group had
better DNA affinity than compounds having hydroxyl group. These
results are in the agreement of the earlier reported work.
32
2.3.3. Cell line profiles
The potential anticancer efficacy of the developed derivatives
was ascertained in term of % viability on human breast cancer cell
line (MCF-7, wild-type). The % viabilities of the synthesized com-
pounds (4a–6d); at varying concentrations (0.0001, 0.001, 0.01,
0.1 and 1.0
l
g/mL) were determined (Fig. 5).
From the figure, it can be concluded that the pyrazolealdehydes
derivatives (4a–d) had viability of 80%, 79%, 75% and 59% at 1.0
l
g/
mL, respectively. On the other hand, compound 5a–d showed 90%,
88%, 70% and 65% viability at the same concentration. Schiff’s bases
of the Knoevenagel’s condensates (6a–d) showed viabilities of 98%,
87%, 74% and 67%, respectively. Thus, compounds 4d, 5d and 6d
had poor viability (4d > 5d > 6d) indicating good anti-cancer po-
tential. The increase in viability of the cell line might be attributed
to the increased molecular weights and hydrophobicities of the re-
ported compounds. Recently, Bayomi et al.
44
assessed % viability of
some derivatives of curcumin-I on human breast cancer cell line
Figure 6b. 3D- and 2D-docking images of compound 5a, depicting its vicinity with DNA.
Figure 6c. 3D- and 2D-docking images of compound 6a, depicting its vicinity with DNA.
3814 I. Ali et al. / Bioorg. Med. Chem. 21 (2013) 3808–3820
(MCF-7; MDR). It was observed that cell line viabilities of these
compounds were 19–94% at 20
l
g/mL. It is interesting to note that
this concentration was higher than the reported ones in this article
(59% viability at 1.0
l
g/mL; low concentrations).
2.4. Molecular simulation
2.4.1. DNA docking
The combinatorial chemistry and virtual screening have
achieved good reputation in drug discovery by reducing extremely
time-consuming steps of synthesis and biological screening. Be-
sides, docking approach is a good tool for predicting the interac-
tions of drugs at bio-molecular level. Most biologically prevalent
type of DNA is B-form, which has characteristic wide and deep ma-
jor grooves and narrow and deep minor grooves. Base pairing be-
tween two DNA strands gives rise to the distinct hydrogen bond
acceptor/donor patterns in the major and minor grooves. The rigid
molecular DNA docking of the compounds had been carried out
using AutoDock 4.0 tool to find out the possible sites of DNA inter-
actions with the reported compounds. The docking studies of the
compounds were performed with DNA dodecamers
d(CGCGAATTCGCG)
2
(PDB ID: 1BNA). The docking energies of the
synthesized compounds followed the order:
6d > 6a > 6b > 6c > 5d > 5b > 5c > 5a > 4d > 4b > 4a > 4c. The
docked models of first members of all the three series (4a, 5a
and 6a) are shown in Figure 6a–c. It is clear from these figures that
low molecular weight compounds (4a) preferred DNA minor
grooves. Besides, it is interesting to note that the binding sites
shifted from minor to major grooves as the size of the molecules
increased. Therefore, compounds 5a and 6a interacted through
the major grooves of DNA.
The numbers of H- bonds formed by the compounds 4a–6d are
given in Table 2. Other bondings such as Van der Waal’s forces,
electrostatic and hydrophobic interactions are given in Table TS2
(Supplementary data). The number of hydrogen bonds were one
(4a and 4c), two (4b and 4d), four (5a–d), six (6a), four (6b and
5d) and three (6c). During the process of DNA interaction, com-
pounds 4a–d oriented themselves in such a fashion that their N-
phenyl rings and formyl groups were inside DNA minor groove
while other phenyl rings; carrying functional groups; were outside
the groove. This molecular arrangements led to the formation of
two H-bonds (A: DT8:O3
0
::O of hydroxyl group & B: DA18:H3::O
of carbonyl group) in 4b and one in 4c (A: DG4:H22::O of carbonyl
group). In compound 4a, the ring carrying functional group got
twisted and formed one H bond (A: DG4:H22::O of nitro group)
with guanine moiety. This twisting of the ring might be due to
two reasons (i) GC rich region has large positive potential respon-
sible for molecular attraction
45
and (ii) more repulsion from back-
bone phosphate groups; compelling the ring to twist from normal
planar geometry. On the insertion of curcumin (5a–d), the only ef-
fect was increase in the molecular size shifting DNA interaction
from minor to major grooves. In these compounds, total four
hydrogen bonds were formed with common bonds between car-
bonyl and methoxy groups of the curcumin. The order of docking
energy among these compounds was: 5d > 5b > 5c> 5a; similar to
the compounds of previous series (chloro derivative more interact-
ing than the compounds of respective series). Furthermore, in
Schiff’s bases of Knoevenagel’s condensates (6a–d), the order of
docking energy was 6d > 6a > 6b > 6c. The replacement of carbonyl
groups by disemicarbazone moiety increased the tendency of the
molecules to form more hydrogen bonds. Therefore, the numbers
of hydrogen bonds were six, four, three and four in 6a, 6b, 6c
and 6d, respectively. Greater numbers of hydrogen bonds were ob-
served in the case of 6a due to the presence two oxygen (Nitro
group). The carbonyl and amino moieties were the common groups
involved in H-bonding in this series. Briefly, the experimental re-
sults of DNA binding are well supported by the results of docking
studies. Compound bearing 3-nitro substituent in phenyl ring
had less affinity (high binding energy À7.44 kcal/mol), while com-
pounds having 4-nitro and 2-hydroxy had more affinity (low bind-
ing energy À7.74 and À7.96 kcal/mol, respectively). These
phenomena can be explained by considering the non-covalent
interactions such as hydrogen bonds, Van der Waal’s forces, elec-
trostatic and hydrophobic bonds. The docking energy (
D
G
binding
)
produced by AutoDock is sum of various factors as:
D
G
binding
¼
D
G
vdW
þ
D
G
elec
þ
D
G
hbond
þ
D
G
desolv
þ
D
G
tors
Interestingly, it can be seen that, the sum of Vdw + Hb + dissolva-
tion energy is quite high (Table TS2, Supplementary data) in the case
of 3-nitro substituent’s (4c, 5c and 6c). Van der Wall’s contacts of the
first compounds of each series are shown in Figures FS2–FS4 (Sup-
plementary data). It is clear from the figures binding site is shifted
from minor to major grooves on increasing size of molecule. Fur-
thermore, it may be observed from these figures that Van der Wall’s
contacts decreased on increasing molecular size. In the present
study the docking energies and in vitro cell line viabilities were esti-
mated. Regression analyses results were found to be satisfactory
with ±0.08, ±0.10, 0.9997–0.9999% and 99.0–99.5% values of stan-
dard deviation, correlation coefficient (R
2
) and confidence levels,
respectively. Basically, the presence of 3-nitro group into the ring
destabilizes DNA–ligand adduct by varying these terms
(Table TS2, Supplementary data). Hence, it is clearly indication that
electrostatic interactions (including H-bonding) and Van der Wall’s
interactions were the major factor which determines the site of DNA
binding with the compounds. All these results are in agreement
with the observations obtained from experimental results. Based
on these facts, it may be concluded that the docking results are com-
parable with the DNA binding studies.
2.4.2. Mechanism of action at supramolecular level
UV–vis spectroscopic data indicated that the reported com-
pounds formed adducts with DNA due to covalent and non-cova-
lent bindings. The docking studies had also shown that
compounds 4a–d interacted with the nucleic acid in the minor
grooves of DNA. On the other hand, larger sizes of the compounds
5a–6d compelled them to interact with in major groves. These re-
sults tallied well with the finding of Hamilton et al.
46
Therefore,
compounds of series 4a–d were attracted towards minor groves
while compounds of series 5a–d and 6a–d for major grooves. A
deep insight of interactions at supramolecular level was visualized
and developed by docking studies. For this purposes 3-D docking
models were developed for all the compounds and only three are
shown in Figure 6a–c (first compounds of each series). The critical
evaluation and 3D visualization of compound 4a model (Figure 6a)
indicated that 4-nitro-phenyl moiety is inside the minor groove
while the remaining part is outside. Nitro group was forming one
hydrogen bond with guanine-cytosine base pair (Table 2). The
hydrogen bonding involved the participation of oxygen atom of ni-
tro group and hydrogen atom of guanine. Similarly, in case of com-
pound 5a (Figure 6b), 4-nitro-phenyl moiety was inside the major
groove while the remaining part stay outside the groove. Total four
hydrogen bonds were formed in this process (three inside and one
outside of groove). Inside hydrogen bonds were formed between (i)
oxygen atom of nitro group and hydrogen atom of adenine, (ii)
oxygen atom of methoxy group and hydrogen atom of guanine
and (iii) nitrogen atom of pyrazole ring and hydrogen atom of ade-
nine. On the other hand, outside hydrogen bonds were formed be-
tween hydrogen atom of hydroxyl group and oxygen of phosphate
group (Table 2). In case of compound 6a (Figure 6c), five hydrogen
bonds were formed inside major groove while one outside grooves.
The inside hydrogen bonds were formed between (i) hydrogen of
hydroxyl group at curcumin part and oxygen of thymine,
I. Ali et al. / Bioorg. Med. Chem. 21 (2013) 3808–3820
3815
(ii) oxygen of methoxy group at curcumin part and hydrogen of
adenine, (iii) oxygen of amide and hydrogen of guanine, (iv) oxy-
gen of nitro group and hydrogen of cytosine and (v) oxygen of nitro
group and hydrogen of cytosine. Outside hydrogen bond was
formed between hydrogen of amino group of compound and oxy-
gen of phosphate group of DNA. Therefore, it might be concluded
that hydrogen bonding was the major force for the interactions
of the reported compounds with DNA. Besides, other forces such
as Van der Waal’s, steric effect, etc. are contributing in binding of
ligands to the DNA. Based on the above discussion, it can be con-
cluded that the compounds of series 6a–d had stronger affinity to-
wards DNA than the compounds of series4a–d and 5a–d, which
was in accordance with the experimental UV–vis spectroscopic
data.
3. Future perspectives of the reported compounds
The future perspectives of the reported compounds can be as-
sessed and predicted by considering their various properties such
as hemolysis, cell line viabilities, DNA binding constants and
Table 2
DNA docking data of compounds 4a–6d
Compounds No. of H-bond with DNA Residues involved in H-bonding bonding (Bond length)
4a 1 A: DG4:H22::O of nitro
(1.69)
4b 2 A: DT8:O3
0
::O of hydroxyl group
(2.70)
B: DA18:H3::O of carbonyl group
(2.07)
4c 1 A: DG4:H22::O of carbonyl group
(2.31)
4d ——
5a 4 A: DA5:OP
2:
:O of hydroxyl group
(2.83)
A: DA6:H7::O of nitro group
(2.07.)
B: DG16:H7::UNK0:O of methoxy group
(1.78)
B: DA18:H7::UNK0:N of pyrazole ring
(1.89)
5b 4 B: DA18:H7::UNK0:O of carbonyl group
(2.09)
A: DA5:H7::UNK0:O of hydroxyl of pyrazolealdehydes
(1.73)
A: DA6:H7::UNK0:O of methoxy group
(2.08)
A: DG4:H7::UNK0:N of pyrazole ring
(2.19)
5c 4 A: DA5:H62::UNK0:O of Nitro group
(2.09)
B: DG16:H7::UNK0:O of methoxy group
(2.33)
A: DA5:H7::UNK0:O of nitro group
(1.83)
B: DA17:H7::UNK0:O of carbonyl group
(1.70)
5d ——
6a 6 B: DT19:O4 H UNK0::O of hydroxyl of curcumin
(3.10)
A: DA5:H62::UNK0:O of methoxy group
(2.42)
A: DG4:OP2:UNK0:N of amino group
(2.70)
A: DG4:H7::UNK0:O of carbonyl of amide group
(1.89)
B: DC21:H41::UNK0:O of nitro group
(2.04)
A: DC3:H4::UNK0:O of nitro group
(2.14)
6b 4 B: DT19:OP2 H::UNK0:O of hydroxyl of curcumin
(2.58)
A: DG4:H7::UNK0:O of carbonyl of amide group
(2.02)
A: DG2:OP
2
::UNK0:O of hydroxyl groupof pyrazolealdehyde
(3.0)
B: DG22:H7 -:UNK0:O of methoxy group
(2.19)
6c 3 B: DG16:OP
1
::UNK0:N of amide group
(2.89)
B: DA18:H7::UNK0:O of nitro group
(2.20)
B: DA18:OP
2
::UNK0:O hydroxyl of curcumin
(2.72)
6d — —
Where ‘A’&‘B’ refers to the chains of DNA while ‘UNKO’ refers to the respective ligands.
3816 I. Ali et al. / Bioorg. Med. Chem. 21 (2013) 3808–3820
docking energies. For this purpose, these properties are summarized
in Table 3. It is clear from this table that hemolysis values ranged
from 7% to 25%, which is much lower than the standard doxorubicin
drug ($42% at 100
l
g/mL). Therefore, the reported compounds are
less toxic to normal cells in comparison to the standard drug. The
anticancer profiles in terms of % viabilities ranged from 59% to
79% at 1.0
l
g/mL; indicating quite good potential of their anticancer
candidatures. The values of DNA binding constant ranged from
1.4 Â 10
3
to 8.1 Â 10
5
M
À1
, indicating the compounds as potential
anticancer agents. These results have also been supported by the
docking data. It is interesting to note that DNA binding constants
were in the order: series 6a–d>series 5a–d>series 4a–d, but the
order of the anticancer activities was just reverse. The possible rea-
son for above said behavior of these compounds is the direct binding
with DNA without any hurdle (biological membranes and other en-
zymes). On the other hand, in case of cell line viabilities, these com-
pounds had to pass the cell and nuclear membrane barriers via
passive transport mechanism. Probably, the compounds of series
6a–d and 5a–d were less allowed to pass through these membranes
due to their bigger size, while the compounds of series 4a–d might
be able to pass these barriers efficiently due to small size. Based on
these discussions, the future of the developed compounds seems to
be quite bright as anticancer agents.
4. Experimental section
4.1. Materials and methods
4.1.1. Chemicals and reagents
The rhizome of C. longa was collected from the agricultural field,
New Delhi, India. The plant was identified by observing its taxo-
nomical features. Phenyl hydrazine, ortho-hydroxyacetophenone,
para-nitroacetophenone, meta-nitroacetophenone, para-chloroace-
tophenone, phosphorus oxychloride and dimethylformamide were
obtained from Spectrochem Ltd, Mumbai, India. Semicarbazide
hydrochloride and tris-(hydroxymethyl)aminomethane were ob-
tained from Sisco Research Lab., Mumbai, India and S.D. Fine Chem.
Ltd, New Delhi, India. Ethanol, methanol, chloroform, dichloro-
methane and hexane of HPLC grades were purchased from Merck,
Mumbai, India. Ct-DNA (as sodium salt) was obtained from SRL Pvt.
Ltd, Mumbai, India. The concentrations of DNA were determined
spectrometrically with an extinction coefficient of 6600 M
À1
cm
À1
at 258 nm. Silica gel G (10–40
l
m) for thin layer chromatography
(TLC) and normal silica gel (60–120
l
m) for column chromatogra-
phy were supplied by Merck, Mumbai, India. Tris–HCl buffer
(2.0 Â 10
À2
M) was prepared in Millipore water at pH range of
7.2–7.3.
4.2. Instruments used
Elemental analyses were determined by using Vario EL elemen-
tal analyzer. UV–vis spectra were obtained by T80 UV–vis spectro-
photometer. FT-IR spectra were obtained in the range of 4000–
400 cm
À1
on a Nicolet FT-IR spectrometer.
1
H nuclear magnetic
resonance (
1
H NMR) spectra were recorded using Bruker
300 MHz instrument. ESI-MS were performed by micrOTOF-Q II
Electrospray ionization mass spectrometer (Bruker). Ultraviolet
(UV) cabinet was used to view thin layer chromatograms. pH meter
of control dynamics was used to record pH of the solutions. Melt-
ing points were determined on Veego instrument and were uncor-
rected. HPLC system of ECOM (Czech Republic) consisting of
solvent delivery pump (Alpha 10), manual injector, absorbance
detector (Sapphire 600 UV–Vis), chromatography I/F module data
integrator (Indtech. Instrument, India) and Winchrome software
was used to determine the purity of compounds. The column used
was Sunniest C
18
(150 Â 4.5 mm, 5.0
l
m) Chromanik, Japan.
4.3. Separation of curcumin
Curcumin-I was separated by earlier reported method.
47
Briefly,
a mixture of curcumin was loaded onto a silica gel column impreg-
nated with NaHCO
3
and eluted with pure dichloromethane. The
purity of the eluted component was checked by HPLC.
4.4. Procedure of the preparation of phenyl hydrazones
1:1 Mixture of phenylhydrazine (1) and substituted acetophe-
none (2a–d) was refluxed in ethanol for 8–12 h. The progress of
the reaction was monitored by TLC. After the completion of the
reaction, the solid product was filtered and washed with cold
ethanol.
4.4.1. Procedure of the preparation of 3-substituted-1-phenyl-
1H-pyrazole-4 carbaldehydes
Vilsmeier–Haack reaction: POCl
3
(50 mM) was added drop wise
to anhydrous DMF (50 mM) in round bottom flask (250 mL) at 0 °C.
The reaction mixture was stirred for 30–45 min until the formation
of Vilsmeier’s complex appeared. The corresponding phenylhyd-
razone (3a–d, 25 mM) was dissolved in minimum amount of
DMF and added to Vilsmeier’s complex (50 mM). The reaction mix-
ture was stirred for 30 min at room temperature and then refluxed
for 15–16 h. The reaction mixture was poured into water/ice and
kept for 5–10 min. The reaction mixture was neutralized by 2.0 N
NaOH with stirring for 30 min. The precipitated product was fil-
tered and the solid obtained crystallized using chloroform.
Table 3
The comparative properties of the synthesized compounds (4a–6d)
Compd % Hemolysis % Viabilities (
l
g/mL) DNA Binding const. (K
b
,M
À1
) % Hypochromism Docking energy (kcal/mol)
1 0.1 0.01 0.001 0.0001
4a 7 80 96 86 97 106 1.9 Â 10
3
7.7 À8.26
4b 18 79 73 92 97 96 1.4 Â 10
3
6.2 À8.45
4c 10 75 86 89 89 89 2.5 Â 10
3
5.2 À7.39
4d 9 59 90 98 98 100 7.6 Â 10
4
5.6 —
5a 10 90 92 95 98 98 1.4 Â 10
4
12.3 À10.59
5b 20 88 91 93 97 100 2.1 Â 10
4
13 À11.72
5c 14 70 85 88 96 99 9.4 Â 10
4
29 À10.88
5d 16 65 72 75 81 95 7.8 Â 10
5
8.1 —
6a 11 98 92 95 105 110 2.6 Â 10
4
8 À13.48
6b 25 87 86 91 91 92 3 Â 10
4
10 À12.64
6c 16 67 68 86 89 91 9.1 Â 10
4
9 À12.48
6d 17 74 78 81 81 87 8.1 Â 10
5
11 —
I. Ali et al. / Bioorg. Med. Chem. 21 (2013) 3808–3820
3817
4.4.1.1. 3-(4-Nitrophenyl)-1-phenyl-4,5-dihydro-1H-pyrazole-4-
carbaldehyde (4a).
Yield: 80%, mp 158–160–162 °C; Anal.
Calcd: C (65.53%), H (3.78%), N (14.33%), O (16.37%), found:
(65.56%), H (3.80%), N (14.35%), O (16.36%) IR
m
max
(cm
À1
): 3110
(Ar-H), 1686 (CHO), 1627 (C@N), 1584 (C@C), N–O (1345).
1
H
NMR (CDCl
3
) d (ppm): 10.10 (s, 1H, CHO), 8.60 (s, 1H, pyrazole-
H), 8.38 (d, 2H, J = 8.7 Hz, Ar-H), 8.20 (d, 2H, J = 6.9 Hz, Ar-H),
7.84 (t, 3H, J = 8.1 Hz Ar-H), 6.69–7.62 (m, 2H, Ar-H). ESI-MS (m/
z) Calcd for C
16
H
11
N
3
O
3
: 293.27, found: 293.94.
4.4.1.2. 3-(2-Hydroxyphenyl)-1-phenyl-4,5-dihydro-1H-pyrazole-4-
carbaldehyde (4b).
Yield: 75%, mp 208–210 °C; Anal. Calc d: C
(72.72%), H ( 4.58%), N ( 10.6%), O (12.11%), found: C (72.71%), H
(4.58%), N (10.5%), O (12.10%). IR
m
max
(cm
À1
): 3550 (OH), 3125 (Ar-
H), 1680 (CHO), 1625 (C@N), 1590 ( C@C).
1
HNMR(CDCl
3
) d (ppm):
9.938 (s, 1H, CHO), 8.92 (s, 1H, OH), 8.52 (s, 1 H, pyrazole-H), 7.80–
7.73 (m, 4H, Ar-H), 7.60 (t, 2H, J = 7.2 Hz, Ar-H), 7.39 (t, 1H, J =6.9Hz,
Ar-H), 6.98 (d, 2 H, J = 8.4 Hz, Ar-H). ESI-MS (m/z) Calcd for
C
16
H
12
N
2
O
2
[M+Na]: 287.26, found: 287.17.
4.4.1.3. 3-(3-Nitrophenyl)-1-phenyl-4,5-dihydro-1H-pyrazole-4-
carbaldehyde (4c).
Yield: 68%, mp 141–142 °C; Anal. Calcd: C
(65.53%), H (3.78%), N (14.33%), O (16.37%), found: C (65.54%), H
(3.79%), N (14.36%), O (16.38%). IR
m
max
(cm
À1
): 3120 (Ar-H),
1688 (CHO), 1583 (C@C), 1620 (C@N), 1347 (N–O).
1
H NMR
(CDCl
3–
300 MHz) d (ppm): 10.09 (s, 1H, CHO), 8.58 (s, 1H, pyra-
zole-H), 8.35–8.29 (m, 2H, Ar-H), 7.83 (t, 2H, J = 7.2 Hz, Ar-H),
7.70–7.65 (m, 1H, Ar-H), 7.58–7.52 (m, 3H, Ar-H), 7.49–7.41 (m,
1H, Ar-H). ESI-MS (m/z) Calcd for C
16
H
11
N
3
O
3
[M+Na]
+
: 316.26,
found: 316.20.
4.4.1.4. 3-(4-Chlorophenyl)-1-phenyl-4,5-dihydro-1H-pyrazole-
4-carbaldehyde (4d). Yield: 85%, mp 147–148 °C; Anal.
Calcd: C (67.97%), H (3.92%), Cl (12.54%), N (9.91%), O (5.66%),
found: C (68.10%), H (3.98%), Cl (12.55%), N (9.92%), O (5.67%). IR
m
max
(cm
À1
): 3115 (Ar-H), 1690 (CHO), 1625 (C@N), 1579 (C@C).
1
H NMR (CDCl
3
) d (ppm): 9.97 (s, 1H, CHO), 7.64 (d, 2H,
J = 7.2 Hz, Ar-H), 7.48 (t, 2H, J = 6.6 Hz, Ar-H), 6.91 (d, 2H,
J = 7.5 Hz, Ar-H), 6.31–6.12(m, 3H, Ar-H), 9.21 (s, 1H, pyrazole-H).
ESI-MS (m/z) Calcd for C
16
H
11
ClN
2
O: 282.72, found: 283.15.
4.4.2. Procedure for the synthesis Knoevenagel condensates of
curcumin-I
3-(Substituted)-1-phenyl-1H-pyrazole-4-carbaldehyde
(1.0 mM in 25 mL chloroform) was added into a solution of curcu-
min (1.0 mM in 25 mL chloroform) in round bottom flask (100 mL).
Piperidine (2–5%) was added in the mixture and stirred at room
temperature for 48–55 h. After the completion of the reaction,
chloroform was reduced and the solid product was washed with
DCM/MeOH (99:1, v/v) to remove impurities.
4.4.2.1. 1,7-Bis(4-hydr oxy-3-methoxyphenyl)-4-{[3-(4-nitrophenyl)-
1-phenyl-1H-pyrazol-4-yl]methylidene}hepta-1,6-diene-3,5-dione
(5a).
Yield: 65%, 141–142, mp 91 °C; Anal. Calcd: C (69.04%), H
(4.54%), N (6.53%), O (19.89%), found: C (69.06%), H (4.58%), N
(6.52%), O ( 19.90%). IR
m
max
(cm
À1
): 3506 ( OH), 1687 (C@O), 1454
(C@C), 1338 (NO
2
), 1026 (Ar-O–C).
1
HNMR(CDCl
3
) d (ppm): 8.18 (d,
2H, J = 7.5 Hz, A r-H), 8 .11 ( s, 2H, Ar-H), 8 .03 (d, 2H, J = 6.6 Hz, Ar-H),
7.77 (s, 1H, @CH-Ar), 7.66–7.56 (m, 2H, Ar-H), 7.36 (d, 2H, J =6.9Hz,
Ar-H), 6.62 (d, 3H, J = 8.1 Hz, Ar-H), 6.62–6.59 (m, 3H, Ar-H), 6.56 (d,
2H, J = 13.2 Hz, HC@C–), 7.83 (d, 2H, J = 15.6 Hz, HC@C–C@O), 8. 59 (s,
pyrazole-H), 3.98 (s, 6H, OCH
3
). ESI-MS (m/z) Calcd for C
37
H
29
N
3
O
8
:
643.64, found: 642.30.
4.4.2.2. 1,7-Bis(4-hydroxy-3-methoxyphenyl)-4-{[3-(2-hydroxy-
phenyl)-1-phenyl-1H-pyrazol-4-yl]methylid ene}hepta-1,6-
diene-3,5-dione (5b).
Yield: 69%, mp 101–102 °C; Anal.
Calcd: C (72.3%), H (4.92%), N (4.56%), O (18.22%), found: C
(72.1%), H (4.93%), N (4.55%), O (18.26%); IR
m
max
(cm
À1
): 3510
(OH), 1685 (C@O), 1490 (C@C), 1024 (Ar-O–C).
1
H NMR (CDCl
3
) d
(ppm): 8.52 (s, pyrazole-H), 8.21 (d, 2H, J = 7.2 Hz, Ar-H) 8.04 (s,
2H, Ar-H), 7.83 (d, 2H, J = 15.2 Hz, HC@C–C@O), 7.82–7.73 (m,
4H, Ar-H), 7.76 (s, 1H, @CH-Ar), 7.61 (d, 2H, J = 8.1 Hz Ar-H), 7.41
(t, 2H, J = 6.9 Hz, Ar-H), 6.65–6.63 (m, 3H, Ar-H), 6.51 (d, 2H,
J = 12.6 Hz, HC@C–),3.80 (s, 6H, OCH
3
). ESI-MS (m/z) Calcd for
C
37
H
30
N
2
O
7
: 635.61 [M+NaÀ2H]
+
, found: 633.12.
4.4.2.3. 1,7-Bis(4-hydroxy-3-methox yphenyl)-4-{[3-(3- nitrophenyl)-
1-phenyl-1H-pyrazol-4-yl]methylidene} -hepta-1,6-diene-3,5-dione
(5c).
Yield: 63%, m p 110–112 °C; Anal. C alcd: C (69.04%), H
(4.54%), N (6.53%), O (19.89%), Found: (69.2%), H ( 4.72%), N (6.55%), O
(19.91%), IR
m
max
(cm
À1
): 3468 (OH), 1689 (C@O), 1472 (C@C), 1347
(NO), 1025 ( Ar-O–C),
1
HNMR(CDCl
3
) d (ppm): 8.58 (s, pyrazole-H),
8.37–8.27 (m, 2H, Ar-H), 8.16 (d, 2H, J = 12.3 Hz, HC@C–C@O), 7.92
(s, 1H, Ar-H), 7.76 (s, 1H, @CH-Ar), 7.39 (d, 2H, J =12Hz, HC@C–),
7.69 (t, 3H, J = 8.1 Hz, A r-H), 7.44 (d, 3H, J = 7.2 Hz, Ar-H), 6.64 (t, 1H,
J = 6.0 Hz, Ar-H), 6 .63–6.52 (m, 3H, Ar-H), 3.99 (s, 6H, OCH
3
). ESI- MS
(m/z) Calcd for C
37
H
29
N
3
O
8
: 666.63 [M+Na]
+
, found: 666.88.
4.4.2.4. 1,7-Bis(4-hydroxy-3-methoxyphenyl)-4-{[3-(4-chloro-
phenyl)-1-phenyl-1H-pyrazol-4-yl]methylidene}-hepta-1,6-
diene-3,5-dione (5d).
Yield: 60%, mp; 115–117 °C; Anal.
Calcd: C (70.19%), H (4.62%), Cl (5.6%), N (4.42%), O (15.16%),
Found: C (70.22%), H (4.68%), Cl (5.7%), N (4.44%), O (15.18%) IR
m
max
(cm
À1
): 3507 (OH), 1718 (C@O), 1424 (C@C), 1330 (NO
2
),
1033 (Ar-O–C).
1
H NMR (CDCl
3
) d (ppm):8.62 (s, pyrazole-H),
8.31 (d, 2H, J = 8.1 Hz, Ar-H,) 8.10 (s, 2H, Ar-H), 7.87–7.86 (m, 3H,
Ar-H), 7.82 (d, 2H, J = 15.3 Hz, HC@C–C@O), 7.82 (s, 1H, @CH-Ar),
7.60 (d, 2H, J = 7.5 Hz Ar-H), 6.67 (t, 2H, J = 7.2 Hz, Ar-H), 6.56–
6.54 (m, 4H, Ar-H), 6.43 (d, 2H, J = 12.3 Hz, HC@C–), 3.70 (s, 6H,
OCH
3
). ESI-MS (m/z) Calcd for C
37
H
29
ClN
2
O
6
: 633.08, found:
633.21.
4.4.3. Procedure for the synthesis of Schiff base of Knoevenagel
Condensates
Each curcumin-I condensate (5a–d); (1.0 mM) was dissolved in
minimum amount of chloroform. Semicarbazide hydrochloride
(2.0 mM; in 20 mL methanol with a drop of water to dissolve the
salt) was added to the curcumin condensate solution drop wise.
A small amount of catalyst (piperidine) was also added to the
above reaction mixture. The reaction mixture was stirred for
24 h. After the completion of the reaction, the product was concen-
trated and washed repeatedly.
4.4.3.1. 5-[(Carbamoylamino)imino]-1,7-bis(4-hydroxy-3-methoxy-
phenyl)-4-{1-[3-(4-nitroyphenyl)-1-phenyl-4,5-dihydro-1H-pyrazol-
4-ylidene]ethyl}hepta-1,6-dien-3-ylidene]amino]urea
(6a).
Yield: 60%, mp 125–126 °C; Anal. C alcd: C (61.82%), H
(4.66%), N (16.64%), O (16.89%), Found: C (61.62%), H (4.56%), N
(16.54%), O ( 16.29%), IR
m
max
(cm
À1
): 3580 (NH), 3512 (OH), 1699
(C@O), 1598 (C@N), 1337 (Ar-N–O), 1450 (C@C), 1338 (NO
2
), 1020
(Ar-O–C).
1
HNMR(CDCl
3
) d (ppm): 8.57 (s, p yrazole-H), 8.17 (d, 2H,
J = 7.5 Hz, Ar-H), 8.10 (s, 2H, Ar-H), 8.13 (d, 2H, J = 7.2 Hz, Ar-H), 7.83
(d, 2H, J = 15.6 Hz, HC @C–C@O), 7 .78 ( s, 1H, @CH-Ar), 7.65–7.62 (m,
2H,Ar-H),7.40(d,2H,J = 6.9 Hz, Ar-H), 6 .61 (d, 3H, J = 8.1 Hz, Ar-H),
6.54–6.52 (m, 3H, Ar-H), 6.36 (d, 2H, J = 13.2 Hz, HC@C–), 3.98 (s, 6H,
OCH
3
)2.68(bs,4H,NH
2
). ESI-MS (m/z) Calcd for C
39
H
35
N
9
O
8
[MÀOCH
3
]
+
: 727.72, found: 727.39.
3818 I. Ali et al. / Bioorg. Med. Chem. 21 (2013) 3808–3820
4.4.3.2. 5-[(Carbamoylamino)imino]-1,7-bis(4-hydroxy-3-methoxy-
phenyl)-4-{1-[3-(2-hydroxyphenyl)-1-phenyl-4,5-dihydro-1H-pyra-
zol-4-ylidene]ethyl}hepta-1,6-dien-3-ylidene]amino]urea
(6b).
Yield: 65%, mp; 130–131 °C; Anal. Calcd: C (64.28%), H
(4.98%), N (15.38%), O (15.37%), Found: C (64.22%), H (4.80%), N
(15.30%), O (15.39%). IR
m
max
(cm
À1
): 3515 (OH), 1690(C@O), 1490
(C@C), 1596 (C@N) 1022 (Ar-O–C),
1
HNMR(CDCl
3
) d (ppm): 8.53 (s,
pyrazole-H), 8.21 (d, 2H, J = 7.5 Hz, A r-H,) 8.14 (s, 2H, Ar-H), 7.83 (d,
2H, J = 15.0 Hz, HC@C–C@O), 7.82–7.71 (m, 4H, Ar-H), 7.76 (s, 1H,
@CH-Ar), 7.60 (d, 2H, J = 7.21 Hz Ar-H), 7.41 (t, 2H, J = 8.1 Hz, Ar-H),
6.65–6.63 (m, 3H, Ar-H), 6.51 (d, 2H, J = 12.6 Hz, HC@C–), 3.80 (s,
6H, OCH
3
), 2.568 (bs, 4H, NH
2
). ESI- MS ( m/z) C alcd for C
39
H
36
N
8
O
7
:
729.75 [M+1], found: 729.29.
4.4.3.3. 5-[(Carbamoylamino)imino]-1,7-bis(4-hydroxy-3-methoxy-
phenyl)-4-{1-[3-(3-nitrophenyl)-1-phenyl-4,5-dihydro-1H-pyrazol-
4-ylidene]ethyl}hepta-1,6-dien-3-ylidene]amino ]urea
(6c).
Yield: 63%, mp; 118–119 °C; Anal. Calcd: C (61.82%), H
(4.66%), N (16.64%), O ( 16.89%), Found: C (61.78%), H (4.68%), N
(16.60%), O (16.92%), IR
m
max
(cm
À1
): 3486 (OH), 1696 (C@O), 1585
(C@N), 1472 (C@C), 1347 (NO), 1 025 (Ar-O–C).
1
HNMR(CDCl
3
) d
(ppm): 8.57 (s, pyrazole-H), 8.26–8.14 (m, 2H, Ar-H), 8.11 (d, 2H,
J = 12.3 Hz, HC@C–C@O),7.67 (s, 1H, @CH-Ar), 7.38 (d, 2H, J =12Hz,
HC@C–), 7.68 (t, 4H, J = 7.5 Hz, Ar-H), 7.71 (d, 3H, J = 6.6 Hz, Ar-H),
6.62 (t, 2H, J = 8.1 Hz, Ar-H), 6 .52–6.52 (m, 2H, Ar-H), 3.98 (s, 6H,
OCH
3
), 2.98 (bs, 4H, N H
2
). ESI-MS (m/z) Calcd for C
39
H
35
N
9
O
8
[MÀOCH
3
]
+
: 727.72, found: 727.80.
4.4.3.4. 5-[(Carbamoylamino)imino]-1,7-bis(4-hydroxy-3-
methoxyphenyl)-4-{1-[3-(4-chloroyphenyl)-1-phenyl-4,5-dihy-
dro-1H-pyrazol-4-ylidene]ethyl}hepta-1,6-dien-3-yli-
dene]amino]urea (6d).
Yield: 67%, mp; 120–121 °C; Anal.
Calcd: C (62.69%), H (4.72%), Cl (4.74%), N (15.0%), O (12.85%),
found: C (62.60%), H (4.65%), Cl (4.64%), N (14.8%), O (12.90%). IR
m
max
(cm
À1
): 3510 (OH), 1718 (C@O), 1580 (C@N), 1429 (C@C),
1018 (Ar-O–C),
1
H NMR (CDCl
3
) d (ppm): 8.62 (s, pyrazole-H),
8.31 (d, 2H, J = 8.1 Hz, Ar-H,) 8.10 (s, 2H, Ar-H), 7.87–7.86 (m, 3H,
Ar-H), 7.82 (s, 1H, @CH-Ar), 7.82 (d, 2H, J = 15.3 Hz, HC@C–C@O),
7.60 (d, 2H, J = 7.5 Hz Ar-H), 6.67 (t, 2H, J = 7.2 Hz, Ar-H), 6.56–
6.54 (m, 2H, Ar-H), 6.43 (d, 2H, J = 12.3 Hz, HC@C–), 3.70 (s, 6H,
OCH
3
), 2.72 (bs, 4H, NH
2
). ESI-MS (m/z) Calcd for C
39
H
36
N
8
O
7
:
747.79 [M+NH
4
+H], found: 748.56.
4.5. Pharmacological activities
4.5.1. Hemolysis profiles
The experimental procedure employed for the hemolytic assays
of the compounds is an adjustment of ASTM standard F-756-00;
48
based on colorimetric detection of Drabkin’s solution. 1.5 mL test
compound was incubated in 0.214 mL of dilute blood (0.1 mL rab-
bit whole blood mixed with 0.9 mL PBS) at 37 °C for 3 h. Harvested
hemoglobin of rabbit blood was found to be less than 220
l
g/mL
(basal level for hemolytic test), confirming the fresh rabbit blood
use in test. After incubation, the solution was centrifuged at
3800 rpm for 15.0 min. To determine the supernatant hemoglobin,
0.8 mL of Drabkin’s solution was added to 0.2 mL of supernatant
and the sample was allowed to stand for 15 min. The amount of
cyanmethemoglobin in the supernatant was measured at 540 nm
and compared with standard curve (hemoglobin concentrations
ranging from 32 to 1068 mg/mL). The percent hemolysis refers to
the ratio of hemoglobin concentrations in the supernatant of a
blood samples not treated and treated with test compounds. Addi-
tionally, the absorption of the test compounds was determined at
540 nm in order to eliminate the effect of absorption of test com-
pounds. Finally, saline solution and double distilled water were
used as negative and positive controls, respectively.
4.5.2. DNA binding
The stock solution of disodium salt of Ct-DNA was prepared in
tris–HCl buffer (pH 7.2–7.3) and stored at 4 °C temperature. Once
prepared, the stock solution was used within 4 days. The concen-
tration of the solution was determined spectrometrically. The ratio
of absorbance at 260 and 280 (P1.8) indicated that DNA was suf-
ficiently free of protein. The concentration of DNA was measured
using its extinction coefficient at 260 nm (6600 M
À1
cm
À1
) after
dilutions. For the titration purpose, DNA stock solution was diluted
using tris–HCl buffer. The compounds were dissolved in minimum
amount of methanol (2.0 Â 10
À4
M). UV–vis absorption spectra
were recorded after each addition of different concentrations of
DNA. Absorption titration was conducted by adding varying con-
centrations (0.3–2.1 Â 10
À4
) of DNA. The intrinsic binding constant
(K
b
) was determined by Eq. 1, which was originally known as Ben-
essi–Hilderbrand equation and further modified by Wolfe et al.
49
½DNA=ð
e
a
À
e
f
Þ¼½DNA=ð
e
a
À
e
f
Þþ1=K
b
ð
e
b
À
e
f
Þð1Þ
where the apparent absorption coefficients
e
a
,
e
f
, and
e
b
correspond
to A
obs
/[compounds], the extinction coefficient for the compounds,
and the extinction coefficient for the compounds in the fully bound
form, respectively. In plots of [DNA]/(
e
a
À
e
f
) versus [DNA], K
b
is gi-
ven by the ratio of the slope to the intercept.
4.5.3. Anticancer assays
In vitro anticancer profiles of the synthesized compounds were
determined against human breast cancer cell line (MCF-7) by a cell
viability assay (MTT assay).
50
DMEM (low glucose), 10% fetal bo-
vine serum and antibiotic/anti-mycotic formed the main constitu-
ents of the culture medium. MCF-7 cells were seeded in 96-well
plate at a density of 2 Â 10
3
cells/well. These were incubated at
37 °C under a humidified atmosphere containing 5% CO
2
for
24 hrs before assay. After that, the cells were further incubated
in media containing various concentrations of the test compounds.
After 24 h, the medium was removed and washed with PBS. About,
20
l
L of MTT solution was added to each well followed by 4 h of
incubation at 37 °C. Subsequently, the medium was removed fol-
lowed by an addition of 200
l
L DMSO. After slowly shaking (twice)
for 5 s, the absorbance of each well was determined at 570 nm. The
cell viability (%) was calculated as the ratio of the number of sur-
viving cells with test compound and blank.
4.6. Simulation studies
4.6.1. DNA docking
Docking studies were performed at Intel(R) Core(TM) i3 CPU
(2.3 GHz) with XP-based operating system (Windows 2007). 2D
Structures of curcumin embedded pyrazole derivatives were
drawn by Marvin Sketch and then converted to 3D structures
and saved in pdb file format. Ligand preparation was done by
assigning Gastegier charges, merging non-polar hydrogen’s, and
saving in PDBQT file format using AutoDock Tools (ADT) 1.5.4.
51
X-ray crystal structure for DNA (PDB ID: 1BNA) was obtained from
the Protein Data Bank ( Gastegier
charges were assigned to DNA and saved in PDBQT file format
using ADT. Preparation of parameter files for grid and docking
was done using ADT. Docking was performed with AutoDock 4.0
(Scripps Research Institute, USA) considering all the rotatable
bonds of ligand as rotatable and DNA as rigid.
52
The grid centre
was established by centring the grid box on whole DNA. Grid box
size of 60 Â 80 Â 110 Å with 0.375 Å spacing was used. Macromol-
ecule docking was performed using an empirical-free energy func-
tion and Lamarckian Genetic Algorithm, with an initial population
of 150 randomly placed individuals, a maximum number of
2,500,000 energy evaluations, a mutation rate of 0.02, and cross-
over rate of 0.80. Fifty independent docking runs were performed
I. Ali et al. / Bioorg. Med. Chem. 21 (2013) 3808–3820
3819
for each ligand and DNA–ligand complex for lowest free energy of
binding conformation from the largest cluster, which was written
and saved in PDBQT format. These PDBQT files had been converted
to PDB file format. Docking results were analyzed using UCSF Chi-
mera
53
and LigPlot for possible polar and hydrophobic
interactions.
54
5. Conclusions
Anticancer potential of curcumin-I (natural product) was
exploited by synthesizing its Knoevenagel’s condensates and their
Schiff’s bases. In total, 12 compounds were synthesized (4a–6d),
purified and characterized. The reported compounds were less
hemolytic than standard drug doxorubicin; an indication of safe fu-
ture medication. The values of DNA binding constant (1.4 Â 10
3
–
8.1 Â 10
5
M
À1
) and % cell line viability [MCF-7 (wild) 59%
at1.0
l
g/mL] were other signals towards their good anticancer
activities. These results were due to good DNA interacting ten-
dency of the reported compounds. The determination of mecha-
nism of action at supra-molecular level showed that small
molecular size compounds (4a–d) interacted with DNA through
minor grooves. On the other hand, medium (5a–d) and large
molecular size (6a–d) compounds interacted with DNA through
major grooves. The occurrence of hyper- and hypo-chromism
was an indication of binding of these compounds with DNA
through both intercalation and electrostatic attractions. These re-
sults were also supported by the docking studies. The docking
energies varied from À7.30 to À13.4 kcal/mol with 1–6 hydrogen
bonds. A critical evaluation of all the properties of the reported
compounds indicated their quite bright future as anticancer
candidates.
Acknowledgment
The authors are thankful to CSIR (Council of Scientific and
Industrial Research), New Delhi for providing Senior Research Fel-
lowship to Ashanul Haque.
Supplementary data
Supplementary data associated with this article can be found, in
the online version, at />References and notes
1. World Health Statistics 2012. World Health Organization: Geneva, 2012.
2. American Cancer Society Cancer Facts & Figures 2012; American Cancer Society:
Atlanta, 2012
.
3. Dikshit, R.; Gupta, P. C.; Ramasundarahettige, C.; Gajalakshmi, V.;
Aleksandrowicz, L.; Badwe, R.; Kumar, R.; Roy, S.; Suraweera, W.; Bray, F.;
Mallath, M.; Singh, P. K.; Sinha, D. N.; Shet, A. S.; Gelband, H.; Jha, P. Lancet
1807, 2012, 379.
4. Isakoff, S. Cancer J. 2010, 16,53.
5. Newman, D. J.; Cragg, G. M. J. Nat. Prod. 2012, 75, 311.
6. Vasilevich, N. I.; Kombarov, R. V.; Genis, D. V.; Kirpichenok, M. A. J. Med. Chem.
2012, 55, 7003.
7. Ali, I.; Rahisuddin, Saleem K.; Haque, A.; El-Azzouny, A. Egypt. Pharm. J. 2010, 9,
133
.
8. Lee, K. H.; Ab Aziz, F. H.; Syahida, A.; Abas, F.; Shaari, K.; Israf, D. A.; Lajis, N. H.
Eur. J. Med. Chem. 2009, 44, 3195.
9. Venkatesan, P.; Rao, M. N. J. Pharm. Pharmacol. 2000, 52, 1123.
10. Aggarwal, B. B.; Kumar, A.; Bharti, A. C. Anticancer Res. 2003, 23, 363.
11. Amolins, M. W.; Peterson, L. B.; Blagg, B. S. Bioorg. Med. Chem. 2009, 17, 360.
12. Padhye, S.; Chavan, D.; Pandey, S.; Deshpande, J.; Swamy, K. V.; Sarkar, F. H.
Mini-Rev. Med. Chem. 2010, 10, 372.
13. Sahu, P. K.; Sahu, P. K.; Gupta, S. K.; Thavaselvam, D.; Agarwal, D. D. Eur. J. Med.
Chem. 2012, 54, 366.
14. Mishra, S.; Karmodiya, K.; Surolia, N.; Surolia, A. Bioorg. Med. Chem. 2008, 16,
2894
.
15. Qiu, X.; Du, Y.; Lou, B.; Zuo, Y.; Shao, W.; Huo, Y.; Huang, J.; Yu, Y.; Zhou, B.; Du,
J.; Fu, H.; Bu, X. J. Med. Chem. 2010, 53, 8260.
16. Simoni, D.; Rizzi, M.; Rondanin, R.; Baruchello, R.; Marchetti, P.; Invidiata, F. P.;
Labbozzetta, M.; Poma, P.; Carina, V.; Notarbartolo, M.; Alaimo, A.; Alessandro,
N. D. Bioorg. Med. Chem. Lett. 2008, 18, 845.
17. Ali, I.; Saleem, K.; Wesselinova, D.; Haque, A. Med. Chem. Res. 2013, 22, 1386.
18. Howard, S.; Berdini, V.; Boulstridge, J. A.; Carr, M. G.; Cross, D. M.; Curry, J.;
Devine, L. A.; Early, T. R.; Fazal, L.; Gill, A. L.; Heathcote, M.; Maman, S.;
Matthews, J. A.; McMenamin, R. L.; Navarro, E. F.; O’Brien, M. A.; O’Reilly, M.;
Rees, D. C.; Reule, M.; Tisi, D.; Williams, G.; Vinkovic, M.; Wyatt, P. G. J. Med.
Chem. 2009, 52, 379.
19. Bekhit, A. A.; Abdel-Aziem, T. Bioorg. Med. Chem. 2004, 12, 1935.
20. Adhikari, A.; Kalluraya, B.; Sujith, K. V.; Gouthamchandra, K.; Jairam, R.;
Mahmood, R. Eur. J. Med. Chem. 2012, 55, 467.
21. Nitulescu, G. M.; Draghici, C.; Missir, A. V. Eur. J. Med. Chem. 2010, 45, 4914.
22. Bouabdallah, I.; M’Barek, L.; Zyad, A.; Ramdani, A. A.; Zidane, I.; Melhaoui, A.
Nat. Prod. Res. 2007, 21, 298.
23. Havrylyuk, D.; Zimenkovsky, B.; Vasylenko, O.; Zaprutko, L.; Gzella, A.; Lesyk, R.
Eur. J. Med. Chem. 2009, 44, 1396.
24. Shaharyar, M.; Abdullah, M. M.; Bakht, M. A.; Majeed, J. Eur. J. Med. Chem. 2010,
45, 114.
25. Situ, H.; Bobek, L. Antimicrob. Agents Chemother. 2000, 44, 1485.
26. Christie, M. S.; Kenneth, L. R.; David, B. W. Toxicol. Sci. 2007, 97, 163.
27. Barton, J. K.; Danishefsky, A.; Goldberg, J. J. Am. Chem. Soc. 1984, 106, 2172.
28. Shahabadi, N.; Kashanian, S.; Purfoulad, M. Spectrochim. Acta, Part A 2009, 72,
757
.
29. Liu, X. W.; Li, J.; Deng, H.; Zheng, K. C.; Mao, Z. W.; Ji, L. N. Inorg. Chim. Acta
2005, 358, 3311.
30. Liu, X. W.; Li, J.; Li, H.; Zheng, K. C.; Chao, H.; Ji, L. N. J. Inorg. Biochem. 2005, 99,
2372
.
31. Liu, J. G.; Zhang, Q. L.; Shi, X. F.; Ji, L. N. Inorg. Chem. 2001, 40, 5045.
32. Pyle, A. M.; Rehmann, J. P.; Meshoyrer, R.; Kumar, C. V.; Turro, N. J.; Barton, J. K.
J. Am. Chem. Soc. 1989, 111, 3051.
33. Indumathy, R.; Kanthimathi, M.; Weyhermuller, T.; Nair, B. U. Polyhedron 2008,
27, 3443.
34. Allardyce, C. S.; Dyson, P. J.; Ellis, D. J.; Heath, S. L. Chem. Commun. 2001, 1396.
35. Pasternack, R. F.; Gibbs, E. J.; Villafrancas, J. J. Biochem. 1983, 22, 2406.
36. Zhao, P.; Xu, L.; Huang, J.; Liu, J.; Yu, H.; Zheng, K.; Ji, L. Spectrochim. Acta, Part A:
Mol. Biomol. Spectrosc. 2008, 71, 1216.
37. Guo, H.; Cai, C.; Gong, H.; Chen, X. Spectrochim. Acta, Part A: Mol. Biomol.
Spectrosc. 2011, 79,92.
38. Psomas, G.; Tarushi, A.; Efthimiadou, E. K. Polyhedron 2008, 27, 133.
39. Chen, L. M.; Liu, J.; Chen, J. C.; Tan, C. P.; Shi, S.; Zheng, K. C.; Ji, L. N. J. Inorg.
Biochem. 2008, 102, 330.
40. Pratviel, G.; Bernadou, J.; Meunier, B. Adv. Inorg. Chem. 1998, 45, 251.
41. Arjmand, F.; Parveen, S.; Afzal, M.; Toupet, L.; Ben Hadda, T. Eur. J. Med. Chem.
2012, 49, 141.
42. Haq, I. Arch. Biochem. Biophys. 2002, 403,1.
43. Sun, Y.; Zhang, H.; Bi, S.; Zhouf, X.; Wang, L.; Yan, Y. J. Lumin. 2011, 131, 2299.
44. Bayomi, S. M.; El-Kashef, H. A.; El-Ashmawy, M. B.; Nasr, M. N. A.; El-Sherbeny,
M. A.; Badria, F. A.; Abou-zeid, L. A.; Ghaly, M. A.; Abdel-Aziz, N. I. Med. Chem.
Res. 2013, 22, 1147.
45. Neidle, S. Nat. Prod. Rep. 2001, 18, 291.
46. Hamilton, P. L.; Arya, D. P. Nat. Prod. Rep. 2012, 29, 134.
47. Pe
´
ret-Almeida, L.; Cherubino, A. P. F.; Alves, R. J.; Dufosse
´
, L.; Gloria, M. B. A.
Food Res. Int. 2005, 38, 1039.
48. ASTM F756-00 Standard Practice for Assessment of Hemolytic Properties of
Materials; ASTM International: West Conshohocken, PA, USA, 2000. http://
dx.doi.org/10.1520/F0756-00.
49. Wolfe, A.; Shimer, G. H., Jr.; Meehan, T. Biochemistry 1987, 26, 6392.
50. Mosman, T. J. Immunol. Methods 1983, 65,55.
51. Sanner, M. F. J. Mol. Graph Model 1999, 17,57.
52. Morris, G. M.; Goodsell, G. S.; Halliday, R. S.; Huey, R.; Hart, W. E.; Belew, R. K.;
Olson, A. J. J. Comput. Chem. 1998, 19, 1639.
53. Pettersen, E. F.; Goddard, T. D.; Huang, C. C.; Couch, G. S.; Greenblatt, D. M.;
Meng, E. C.; Ferrin, T. E. J. Comput. Chem. 2004, 25, 1605.
54. Laskowski, R. A.; Swindells, M. B. J. Chem. Inf. Model. 2011, 51, 2778.
3820 I. Ali et al. / Bioorg. Med. Chem. 21 (2013) 3808–3820