Process optimization of ultrasound assisted curcumin nanoemulsions stabilized by OSA modified starch
Bạn đang xem bản rút gọn của tài liệu. Xem và tải ngay bản đầy đủ của tài liệu tại đây (1.22 MB, 10 trang )
Short Communication
Process optimization of ultrasound-assisted curcumin nanoemulsions
stabilized by OSA-modified starch
Shabbar Abbas
a
, Mohanad Bashari
a
, Waseem Akhtar
b
, Wei Wei Li
a
, Xiaoming Zhang
a,
⇑
a
State Key Laboratory of Food Science & Technology, School of Food Science & Technology, Jiangnan University, Wuxi 214122, Jiangsu, China
b
CAS Key Laboratory for Biomedical Effects of Nanomaterials & Nanosafety, National Center for Nanoscience and Technology (NCNST), 11 Beiyitiao,
Zhongguancun, Beijing 100190, China
article info
Article history:
Received 19 September 2013
Received in revised form 25 November 2013
Accepted 17 December 2013
Available online 4 January 2014
Keywords:
Ultrasonic homogenization
Nanoemulsion
Modified starch
Curcumin
Droplet diameter
abstract
This study reports on the process optimization of ultrasound-assisted, food-grade oil–water nanoemul-
sions stabilized by modified starches. In this work, effects of major emulsification process variables
including applied power in terms of power density and sonication time, and formulation parameters, that
is, surfactant type and concentration, bioactive concentration and dispersed-phase volume fraction were
investigated on the mean droplet diameter, polydispersity index and charge on the emulsion droplets.
Emulsifying properties of octenyl succinic anhydride modified starches, that is, Purity Gum 2000,
Hi-Cap 100 and Purity Gum Ultra, and the size stability of corresponding emulsion droplets during the
1 month storage period were also investigated. Results revealed that the smallest and more stable nano-
emulsion droplets were obtained when coarse emulsions treated at 40% of applied power (power density:
1.36 W/mL) for 7 min, stabilized by 1.5% (w/v) Purity Gum Ultra. Optimum volume fraction of oil (med-
ium chain triglycerides) and the concentration of bioactive compound (curcumin) dispersed were 0.05
and 6 mg/mL oil, respectively. These results indicated that the ultrasound-assisted emulsification could
be successfully used for the preparation of starch-stabilized nanoemulsions at lower temperatures
(40–45 °C) and reduced energy consumption.
Ó 2013 Elsevier B.V. All rights reserved.
1. Introduction
Nanoemulsions or miniemulsions are thermodynamically
unstable colloidal dispersions of at least two immiscible liquids
with one of the liquids being dispersed as small spherical droplets,
having diameter in the range of 20–200 nm, into the other liquid
[1–3]. Oil–water (O/W) nanoemulsions are usually prepared by
homogenizing an oil phase into an aqueous phase in the presence
of water-soluble emulsifiers/stabilizers [1]. Such emulsions have
found a very important role in the encapsulation of either poorly
soluble or lipophilic food bioactives, i.e., polyphenols and carote-
noids, and act as a vehicle to ensure the safe delivery of these
active compounds to the desired site in the body [4]. Due to their
small droplet size and large surface area, nanoemulsions have good
stability to gravitational separation, flocculation, coalescence, and
offer controlled release and/or absorption of functional ingredients,
besides offering optical clarity to the product [1,5]. On the other
hand, Ostwald ripening is the major destabilization mechanism
in the nanoemulsions. This problem arises due to the increased sol-
ubility of dispersed phase into the aqueous phase and can be
tackled by introducing the dispersed phase with strong
hydrophobic properties [6]. Medium chain triglycerides (MCT)
are low viscosity oils with hydrophobic properties and offer im-
proved bioaccessibility [7].
Nanoemulsions can be prepared either using high-energy
(mechanical-based) or low-energy (chemical-based) approaches
depending on the underlying principle. Mechanical methods for
nanoemulsions preparation include microfluidization [8,9], high-
pressure homogenization [10,11] and ultrasound homogenization
[12–15]. In recent years, ultrasound-assisted emulsification pro-
cess has gained popularity among food processors for the produc-
tion of nanoemulsions, mainly due to its energy-efficiency, low
production cost, ease of system manipulation and better control
over formulation variables [16,17]. Ultrasonic emulsification in-
volved the production of high intensity (low frequency) acoustic
waves followed by the disruption of droplets under the influence
of cavitational effects in the liquid medium. Final size and disper-
sity of nanoemulsion droplets are influenced by a number of
process and formulation variables [15,18–20].
Disruption of larger oil drops into nanosize droplets and their
stability depend on the type and concentration of emulsifiers and
stabilizers. Emulsifiers help to reduce the interfacial tension, thus,
decreasing the energy required for the droplet disruption. Addi-
tionally, prepared droplets are stabilized by the adsorption of
emulsifiers to the freshly formed interface, concomitantly, pre-
venting the droplet re-coalescence [21,22]. Commonly used emul-
sifiers for the preparation of food-grade nanoemulsions include
1350-4177/$ - see front matter Ó 2013 Elsevier B.V. All rights reserved.
/>⇑
Corresponding author. Tel.: +86 510 85919106; fax: +86 510 85884496.
E-mail address: (X. Zhang).
Ultrasonics Sonochemistry 21 (2014) 1265–1274
Contents lists available at ScienceDirect
Ultrasonics Sonochemistry
journal homepage: www.elsevier.com/locate/ultson
small-molecule surfactants (e.g., Tweens, Spans), amphiphilic pro-
teins (e.g., whey proteins), phospholipids (e.g., lecithins) and
amphiphilic polysaccharides (e.g., modified starches, gums). De-
spite the low cost and better efficiency of small-molecule surfac-
tants, there has been increasing interest within the food industry
in replacing the synthetic emulsifiers with natural alternatives so
as to create products with consumer-friendly labels [23]. Conse-
quently, trend of using food biopolymers (proteins, starches) for
the preparation and stability of nanoemulsions is increasing [24–
26]. Although, comparatively lower concentrations of protein-
based emulsifiers are needed, they are prone to denaturation and
precipitation due to their sensitivity to higher processing temper-
atures [24] and the pH fluctuations of medium, respectively. Octe-
nyl succinic anhydride (OSA) modified starches are preferred due
to their stability against high temperature and a wide range of
pH and ionic strength [24,25].
For centuries, turmeric (Curcuma longa) has been extensively
used as a spice, food preservative coloring material and ayurvedic
medicine in India, China, Pakistan and South Eastern parts of Asia.
Curcumin, the major bioactive compound of turmeric, is studied
for its therapeutic effects and its potential as a functional food
ingredient is recognized by several researchers [27]. Poor solubility
of curcumin in aqueous media is the major issue which negatively
affects the bioavailability and efficacy of this ingredient in the hu-
man body. Nano-techniques, including nanoemulsions, could be a
viable option to overcome these limitations [28–30].
As mentioned earlier, the production success of ultrasonic-as-
sisted emulsions is dependent on the better understanding of pro-
cess conditions. Purpose of the present work was to study the
effects of major ultrasonic process-related parameters including
ultrasonic power and sonication time, and formulation-related
parameters including emulsifier and bioactive concentrations, oil
volume fraction (
u
) on size, polydispersity index (PDI) and charge
of the droplet. Furthermore, the optimum ranges for variables in-
volved in the preparation of curcumin-loaded O/W nanoemulsions
are determined. Overall goal was the preparation of food-grade
curcumin-loaded nanoemulsions stabilized by OSA-starch using
high-intensity ultrasonic homogenization.
2. Materials and methods
2.1. Materials
Curcumin (77.90% pure, with 16.11% of demethoxycurcumin
and 1.85% of bisdemethoxycurcumin) was obtained from Nanjing
Zelang Medical Technology Co., Ltd. (Nanjing, Jiangsu, China) and
used without further purification. MCT oil with a required HLB va-
lue of $11.0 (Composition: C
8
: 57%, C
10
: 40%, C
6
: 2% and C
12
: <1%)
was a product of Lonza Inc. (Allendale, NJ, USA), supplied by DIC
Fine Chemical Co., Ltd. (Syn Tec Additive Ltd.), Shanghai, China.
The Octenyl succinic anhydride (OSA) modified starches were
gifted from National Starch and Chemicals (Shanghai, China).
Two conventionally used OSA-starches, i.e., Purity Gum 2000
(PG) and Hi-Cap 100 (HC) are derived from waxy maize while Pur-
ity Gum Ultra (PGU) is a newly developed OSA-starch produced
using the new method with no further technical details. Doubly
distilled water was used for all nanoemulsion preparations and
analysis.
2.2. Methods
2.2.1. Oil phase preparation
Oil phase was prepared by dispersing curcumin crystals in the
heated MCT oil under continuous stirring as described by Ahmad
et al. [29] and Wang et al. [30]. Briefly, MCT oil was heated and
magnetically stirred at 100 °C for 5 min followed by the addition
of curcumin crystals into oil and further stirred for 2 min. Heated
MCT oils (curcumin-loaded) were allowed to cool down at room
temperature. There was a possibility that some of the dissolved
curcumin molecules might crystallize due to over-saturation when
the MCT was cooled down below the solubilizing temperature [31].
In order to remove such undissolved entities, saturated oil was
stored for 24 h followed by centrifugation at 14,000g,15°C for
5 min using a centrifuge (Himac CF16RXII Series, Hitachi, Rotor ra-
dius: 4.4 cm). The collected supernatant (oil) was analyzed by
spectrophotometer at 420 nm (Model UV-1600, Mapada Corpora-
tion, P.R. China) for curcumin solubility. Wavelength of maximum
absorbance (k
max
) was found to be 420 nm, determined by 2802-
UV/VIS spectrophotometer. Concentration of soluble curcumin
was estimated by a standard calibration curve plotted from series
of standard concentrations of curcumin dissolved in the MCT oil.
Calculated concentrations were expressed as mg/mL of MCT oil.
Oil phase (MCT) used in nanoemulsions preparation was either
blank or enriched with curcumin.
2.2.2. Curcumin loading percentage in MCT oil
Different concentrations (1, 3, 6, 10 and 15 mg/mL) of curcumin
were dissolved in oil and their loading percentage was calculated
according to the formula:
Loading percentage ¼
Amount of curcumin dissolved
Total amount of curcumin added
 100
ð1Þ
Amount of curcumin dissolved (mg/mL MCT oil) was estimated
as described previously.
2.2.3. Aqueous phase preparation
Aqueous phases were prepared by dissolving varying concen-
trations % (w/v) of different OSA-modified starches, i.e., PG, HC
and PGU, into doubly distilled water at 50 °C. Emulsifier solution
turned into clear/translucent under continuous stirring for
30 min, indicating the complete dissolution/dispersion. Appear-
ance of (5% w/v) aqueous solutions of PG and HC were almost clear
while 1.5% (w/v) PGU solution was found slightly turbid. Hydro-
philic lipophilic balance (HLB) value of commonly used OSA-mod-
ified starches is 10–13. Hydrophilic emulsifiers may cause
turbidity in the aqueous media with the decrease in their HLB va-
lue (onset of lipophilic character); our observations indicated that
the HLB value of PGU was slightly lower than that of other two
starches.
2.2.4. Critical micelle concentrations (CMC), interfacial tension
Surface tension of modified starches was measured to study
the micelle formation in the aqueous solution at varying starch
concentrations (0.0025–0.1 g/100 mL). CMC of starches were
calculated through surface tension values. Interfacial tensions of
OSA-modified starches at different concentrations in aqueous
solution were determined against MCT oil. Results were determined
by Wilhelmy Plate method on a digital DataPhysics
Ò
Tensiometer
(Model: DCAT21, Germany) at 20 °C. The system temperature
was maintained by circulating refrigerated/heating water bath
(Julabo, Germany).
2.2.5. Viscosity determination
A digital rotational viscometer (Brookfield, Model DV-II + PRO,
Brookfield Engineering Laboratories Inc., MA, USA) was used to
measure the apparent viscosities of aqueous and dispersed phases
at 25 and 45 °C. Measurements were performed using spindle V-
6.5 LV with the speed adjusted at 100 rpm. Viscosity values (
g
)
were reported in m Pa s and all measurements were made in
1266 S. Abbas et al. / Ultrasonics Sonochemistry 21 (2014) 1265–1274
duplicate, and average results were given. Disperse-to-continuous
phase viscosity ratios (
g
d
/
g
c
) of PG, HC and PGU at varying emulsi-
fier concentrations were calculated to determine the compatibility
of two phases for emulsion preparation. Additionally,
g
d
/
g
c
values
of all three starches were calculated at 25 and 45 °C and compared
to assess whether
g
d
/
g
c
value was affected by the ultrasonic
homogenizing temperature (45 °C).
2.2.6. Coarse emulsion preparation
Coarse emulsion (O/W) was prepared by homogenizing the oil
and aqueous phases using a high speed blender (Ultra-Turrax
T25 IKA Works Inc., Wilmington, NC, USA) at 14,000 rpm for
2 min at room temperature. Total volume of each coarse-emulsi-
fied sample was 100 mL.
2.2.7. Nanoemulsion preparation
Coarse emulsion samples, 50 mL each, were subjected to high-
intensity sonication at the operating frequency of 20 kHz using
1200 W ultrasonic processor (JY98-IIIDN, 20 kHz, volume process-
ing capacity: 50–1000 mL, Ningbo Scientz Biotechnology Co., Ning-
bo, China) equipped with 20 mm diameter probe. Temperature
variations in the sample during sonication were monitored with
a digital thermometer attached to a thermocouple. Applied power
ranged of 10%, 20%, 30%, 40%, 50%, 60% and 70% (120, 240, 360, 480,
600, 720 and 840 W, respectively) of the maximal equipment
power (1200 W) while sonication time varied from 1 to 13 min.
Work time and the rest time for sonication were set at 5s and 7s,
respectively, in order to avoid the overheating. Cold water circulat-
ing through the containers jacket helped to maintain the samples
temperature at 40–45 °C.
The absolute power dissipated into the sample at a certain ap-
plied power was estimated according to the formula presented
by Tiwari et al. [32]. Briefly, energy dissipated, in terms of power
(P), was determined through the calorimetric method by following
relation:
P ¼ mCp
D
T
D
t
t¼0
ð2Þ
Here, ‘‘m’’ is the mass (kg), Cp is the specific heat (kJ/kg/°C) of
coarse emulsion and
D
T/
D
t is the change in temperature over time
(°C/s), of the sample. Energy dissipated into the sample is prefera-
bly expressed in the terms of energy density or power density
[33,34]. Power density (W/mL) for different applied powers (% of
maximal power) was calculated by dividing the absolute power
dissipated (P), determined in the Eq. (2), with the total volume
(V) of the sample to be sonicated (mL), as shown in Eq. (3):
Power density ¼ P=V: ð3Þ
2.2.8. Mean droplet diameter (MDD) and polydispersity index (PDI)
MDD and PDI of the emulsion droplets were determined in trip-
licate, using Zetasizer Nano ZS
Ò
(Malvern Instruments, UK)
equipped with dynamic light scattering (DLS) technology. Samples
were diluted (1:200) prior to the size measurement studies in
order to ensure the free Brownian motion of the droplets. Samples
were equilibrated at 25 °C for 1 min. The PDI was a dimensionless
measure of the width of size distribution calculated from the
Cumulant analysis of each sample’s correlation function.
2.2.9. f-potential
The surface charge of the nanoemulsion droplets was deter-
mined by measuring the electrophoretic mobility at 25 °C. Samples
were diluted 200-fold in water before measurement and values of
f-potential were expressed in mV.
2.2.10. Measurement of foaming
The foam formation during homogenization is a well docu-
mented issue related to the application of modified starches as
emulsifiers. Foam formation during coarse emulsification (for
2 min) was calculated for 5% (w/v) PG and HC, and 1.5% (w/v) of
PGU. Sample volume before coarse homogenization and 5 min
after homogenization was recorded using a graduated cylinder.
Foaming extent (
e
) in the coarse emulsion was calculated by using
the following relation:
e
¼
h
L
ð4Þ
where, h = volume before coarse homogenization (mL) and L = vol-
ume after coarse homogenization (mL). Foaming index values were
ranged between 0 and 1;
e
values of coarse emulsions closer to 1
represented the least foaming, and vice versa.
2.2.11. Microscopy of emulsions
Confocal laser scanning microscopy (CLSM) was employed for
the comparative study of conventional emulsion and ultrasound-
assisted nanoemulsion prepared under optimized conditions.
Briefly, 2
l
L of Nile Red fluorescent dye was added into 200
l
Lof
emulsion samples and mixed by gently shaking the mixture for
2 min in order to evenly disperse the dye, and to stain the oil drop-
lets. About 5
l
L of the stained samples of emulsions were placed
on the slide, and coverslip was applied. Samples were analyzed
with a Zeiss LSM 710 confocal microscope (Leica, Heidelberg, Ger-
many) at the magnification of 40Â and 63Â. Nile red dye was ex-
cited with the 543 nm continuous-wave argon ion laser (Ar-ML
Laser). The images were obtained via LSM 710 ZEN software.
2.2.12. Experimental parameters and statistical analysis
The primary parameters which may affect the droplet size, size
distribution and surface charge, i.e., sonication time and power
density, emulsifier type and concentration, bioactive concentration
(curcumin) in oil and oil volume fraction (
u
) were investigated at
different levels (see Table 1). Data were analyzed and given as
mean ± standard deviation. One-way ANOVA was used to compare
results while <0.05 of the p values were considered statistically sig-
nificant. All statistical analysis was performed using SPSS, version
19 (SPSS Inc., Chicago, USA).
3. Results and discussion
3.1. The effect of power density
Mixing of emulsion components and the breakdown of larger
oil drops into nanosize droplets is governed by the extent of dis-
ruptive forces or energy delivered to the liquid sample. As final size
and distribution of the nanoemulsions droplets are influenced by
the coarse emulsion preparation [35], in the first step of this study,
coarse emulsion was prepared prior to the sonication in order to
increase the efficiency of the process (Table 1). In the second step,
coarse emulsion was subjected to sonication. High-intensity ultra-
sound produces shear forces which are required for the disruption
of droplets. Additionally, successful stabilization of newly formed
droplets is governed by the type and concentration of surfactant
applied to droplets. Surfactants tend to decrease the interfacial
tension as well as retard the rate of droplet coalescence, thereby
offering the stability to droplets. It is very critical to determine
the optimum power for ultrasound-assisted industrial scale pro-
cesses in order to minimize the energy loss and production cost
[33].
For applied powers of 10%, 20%, 30%, 40%, 50%, 60% and 70% of
the maximum power, their corresponding power densities for the
S. Abbas et al. / Ultrasonics Sonochemistry 21 (2014) 1265–1274
1267
MDD of PG, HC and PGU-stabilized emulsions were determined
(see Table 2). Blank, MCT-based emulsion (0.05 oil volume frac-
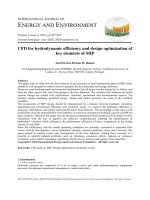
tion) was prepared by treating the sample for 2 min. As shown in
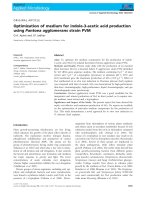
Fig. 1, an increase in the applied power from 10% to 40% (power
density increased from 0.82 to 1.36 W/mL for PG, 0.84 to 1.40 W/
mL for HC and 0.87 to 1.45 W/mL for PGU) of maximum power re-
sulted in the significant decrease (p 6 0.05) of MDD at a fixed time
for PG, HC and PGU. Above 40% applied power, the decrease in the
MDD for all starch-stabilized emulsions was insignificant. Though,
increase in the applied power above 40% slightly decreased the
MDD of PG-stabilized emulsions, it was unnecessary and uneco-
nomical to further increase the power as it may consume extra en-
ergy. Similar strategy (use of minimum power) was suggested by
Hielscher [36] to obtain the required outcome. As power density
was needed to be set at an appropriate level to achieve the droplets
of desired diameter, therefore, applied power was fixed at 40% of
the maximum power for further experiments.
3.2. The effect of sonication time
In the next set of experiments, blank emulsions were prepared
by varying sonication times, as given in Table 1, at fixed applied
power of 40% or power density (1.36, 1.40 and 1.45 W/mL for PG,
HC and PGU, respectively). Other parameters, including, MCT vol-
ume fraction and surfactant concentration were unchanged. Effect
Table 1
Process parameters studied and their levels.
Experimental parameter Levels
(1) Power applied 10%, 20%, 30%, 40%, 50%, 60% and 70% of
maximum power (1200 W)
(2) Sonication time 1, 3, 5, 7, 9, 11 and 13 min
(3) Emulsifier type & concentration
A. Purity Gum 2000,
Hi-Cap 100
1, 3, 5, 7, 9, 11 and 13 min
B. Purity Gum Ultra 0.5%, 1%, 1.5%, 2%, 2.5%, 3%, 4% and 5% (w/v)
aqueous solution
(4) Curcumin
concentration
1.5, 3, 5, 10 and 15 mg/mL of MCT oil
(5) MCT volume fraction
(
u
)
0.02, 0.05, 0.08, 0.11 and 0.14
10 20 30 40 50 60 70
160
180
200
220
240
MDD (nm)
Applied power (% of maximum power)
5% PG
5% HC
1% PGU
Fig. 1. MDD at different applied powers for 2 min sonication time. Composition:
Blank O/W nanoemulsion (50 mL sample), oil
u
: 0.05, Modified starches: 1–5% (w/
v) as emulsifier. Aqueous phase viscosity of 5% (w/v) PG, 5% (w/v) HC and 1% (w/v)
PGU solutions at 25 °C were 2.19, 1.38 and 2.37 m Pa s, respectively.
03691215
120
140
160
180
200
220
240
260
MDD (nm)
Ultrasonic treatment time (min)
5% PG
5% HC
1% PGU
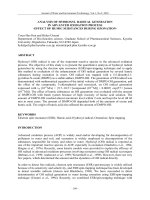
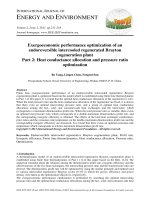
Fig. 2. MDD at different sonication times at fixed power density of 1.36, 1.40 and
1.45 W/mL for PG, HC and PGU, respectively. Composition: blank O/W nanoemul-
sion (50 mL sample), oil
u
: 0.05, Modified starches: 1–5% (w/v) as emulsifier.
Aqueous phase viscosity of 5% (w/v) PG, 5% (w/v) HC and 1% (w/v) PGU solution at
25 °C were 2.19, 1.38 and 2.37 m Pa s, respectively.
0.00 0.02 0.04 0.06 0.08 0.10
40
45
50
55
60
65
70
75
(mN/m)
c (g/100 cm
3
)
PG
HC
PGU
γ
0.0 0.5 1.0 1.5 2.0 2.5 3.0
8
10
12
14
16
18
Interfacial Tension (mN/m)
Emulsifier concentration in aqueous phase (w/v %)
PG
HC
PGU
(a)
(b)
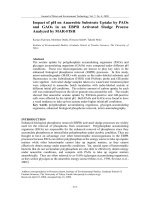
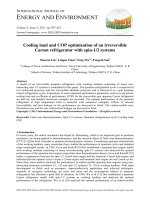
Fig. 3. Determination of the (a) CMC values for OSA starches, (b) interfacial tension
of OSA starches against MCT.
1268 S. Abbas et al. / Ultrasonics Sonochemistry 21 (2014) 1265–1274
of different sonication times, that is, 1, 3, 5, 7, 9, 11 and 13 min on
MDD is shown in Fig. 2. There was a significant decrease in the
MDD (p 6 0.05) with an increased in sonication time from 1 to
7 min for all three surfactants. Similar trend was noticed by Ken-
tish et al. [18] for 15 vol.% flax seed O/W emulsions prepared at
200 W power. Total energy input ‘‘E’’ (expressed in joules or kilojo-
ules) delivered to the sample depends on the input power (P) and
the total sonication time (t), as E = P Â t. For different sonication
times, i.e., 1, 3, 5, 7, 9, 11 and 13 min at a fixed power density, their
corresponding energy input values were determined as 4.09, 12.27,
20.45, 28.63, 36.81, 44.99 and 53.17 kJ, respectively, for PG, 4.20,
12.6, 21.0, 29.40, 37.80, 46.20 and 54.60 kJ, respectively, for HC,
and 4.37, 13.10, 21.84, 30.57, 39.31, 48.04 and 56.78 kJ, respec-
tively, for PGU. Our results indicated that decrease of MDD with
the increase of total energy dissipated into the system was the
function of time at a constant power density. Sonication time of
7 min was found optimum as further increase in time had little ef-
fect on the MDD reduction. Additional sonication time had a little
impact on the MDD reduction of PG, HC and PGU-stabilized emul-
sions. Besides, application of prolonged ultrasonic treatment is dis-
couraged as it may deteriorate the bioactive compounds present in
the formulation. Consequently, sonication time of 7 min was se-
lected for further experiments.
3.3. CMC, interfacial tension of starches
The interfacial properties of emulsifiers are also found to be
critical in the preparation and stability of emulsions [37]. The
CMC values of PG, HC and PGU were 0.038, 0.05 and 0.0025 g/
100 mL, respectively, as shown in Fig. 3a. Results for PG and HC
were comparable to the results presented in the previous study,
by Wang et al. [38]. Interestingly, CMC value of PGU was much
smaller compared to that of other starches.
Interfacial tensions of OSA-modified starches at different con-
centrations were measured against MCT oil phase, as shown in
Fig. 3b. All three emulsifiers tended to decrease the interfacial ten-
sion when their concentration increased; indicating that the emul-
sifiers were adsorbed to the oil–water interface. Although,
decrease in the interfacial tension was almost similar at lower con-
centrations (61% w/v) for all three starches, PGU provided compar-
atively lower interfacial tension than PG and HC at higher
concentrations. At 2.5% concentration, interfacial tension for PGU
decreased to 8.713 ± 0.009 mN/m, suggesting its emulsifying po-
tential for emulsion preparations.
3.4. The effect of emulsifier concentration
3.4.1. Viscosity
Viscosity of aqueous solutions of OSA-modified starches is di-
rectly related to their dissolved concentration. Additionally, ratio
0 2 4 6 8 10121416
0
2
4
6
8
10
12
14
16
18
20
22
24
η
d /
η
c
Emulsifier concentration in aqueous phase (w/v %)
PG - 25°C
PG - 45°C
HC - 25°C
HC - 45°C
PGU - 25°C
PGU - 45°C
0246810
140
160
180
200
220
240
260
MDD (nm)
Emulsifier concentration in aqueous phase (w/v %)
PG
HC
PGU
(a)
(b)
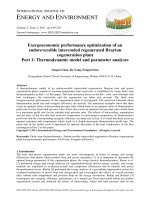
Fig. 4. Effect of emulsifier concentration on (a)
g
d
/
g
c
, i.e., viscosity ratio of dispersed
to continuous phases, (b) MDD. Composition: blank O/W nanoemulsion (50 mL
sample); oil
u
: 0.05, prepared at 40% of applied power and 7 min sonication time.
(a)
(b)
5% PG 5% HC 1.5% PGU
0
20
40
60
80
100
120
140
160
180
200
Blank PDI
Loaded PDI
MDD (nm)
Emulsifier Type
0.05
0.10
0.15
0.20
0.25
0.30
PDI
5% PG 5% HC 1.5% PGU
-50
-40
-30
-20
-10
0
10
Z-Potential (mV)
Emulsifier Type
Blank
Loaded
Fig. 5. Effect of emulsifier type on (a) MDD and PDI (b) f-potential of curcumin-
loaded and blank nanoemulsions, prepared at power density of 1.36, 1.40 and
1.36 W/mL for PG, HC and PGU, respectively, and 7 min sonication time. Compo-
sition: 5% PG, 5% HC and 1.5% w/v PGU, oil
u
: 0.05, curcumin concentration: 10 mg/
mL MCT, and water.
S. Abbas et al. / Ultrasonics Sonochemistry 21 (2014) 1265–1274
1269
of dispersed (
g
d
) to continuous phase viscosity (
g
c
), i.e.,
g
d
/
g
c
of
the system is very important for the stability of emulsions
[21,39]. For
g
d
/
g
c
, 0.5–5 is considered an optimal range for the
efficient breakdown of droplets in the turbulent shear conditions
[40]. In our case, viscosity ratio (
g
d
/
g
c
) of starch solutions was
determined at 25 and 45 °C, as shown in Fig. 4a. MCT oil was
used as a dispersed phase while continuous phase was consisted
of OSA-modified starch solutions of varying concentrations (1–
15% w/v). As optimal range value of
g
d
/
g
c
can be achieved by
fine tuning of the phase viscosities, either by increasing
g
c
or
decreasing the
g
d
, decrease in
g
d
/
g
c
for PGU was found to be
lowest due to the increased
g
c
value, as
g
d
value (for MCT oil)
was kept constant throughout the study. Results indicated that
g
d
/
g
c
for PGU was within optimal range, i.e., 4.66, 2.54 and
0.84 for 3%, 5% and 10% concentration, respectively. On the other
hand, optimal range of
g
d
/
g
c
for PG and HC were achieved at
fairly high concentrations (at P15%).
Finally, it was noted that the
g
d
/
g
c
value for PGU was almost
unaffected when the temperature was increased from 25 to
45 °C. On the other hand,
g
d
/
g
c
value of PG increased at 45 °C for
all concentrations, though, this increment was much clearer at
lower concentrations. In the case of HC, no clear trend was found
between
g
d
/
g
c
and the temperature increase.
3.4.2. MDD, PDI and f-potential
Different concentrations of three OSA starch emulsifiers were
used for the preparation of blank MCT (0.05 oil volume fraction)
nanoemulsions under standardized conditions of an applied power
(40%) and sonication time (7 min). For all three emulsifiers,
increasing their concentration resulted in significant decrease
(p 6 0.05) in MDD during the first phase, as shown in Fig. 4b. This
could be due the fact that larger surface area of oil droplets can be
covered when sufficient concentration of emulsifier is available
during homogenization, thus, providing stability to newly-formed
droplets [22]. A 5% (w/v) concentration of PG and HC was found
to be the most suitable to produce smaller droplets
(MDD $ 148 nm). Surprisingly, a small amount (1.5% w/v) of PGU
at 1.36 W/mL power density was found enough to get smaller
droplets (MDD $ 141 nm). This could be due to number of factors
including the speed at which emulsifier adsorbed to the oil–water
interface and their ability to reduce the interfacial tension [22],
thus, consolidating our results presented in the previous sections.
It is well established that stabilizers influence the PDI of an
emulsion. In the first phase, an increase of emulsifier concentration
resulted in the decrease of droplet PDI for all OSA starches. In the
second phase, increase of PG and HC concentration up to 5% had al-
most no effect on the PDI due to the fact that droplet surfaces were
MDD
(
nm
)
14
0
15
0
16
0
17
0
18
0
19
0
20
0
21
0
22
0
()
0
0
0
0
0
0
0
0
0
0
5%
5
%
1.5
1
S
PG
%
H
C
%
P
Stor
C
P
G
U
torage
U
2
ge tim
2
ime (w (weekeks)
3 4
(a)
(b)
Fig. 6. (a) Effect of storage at 25 °C on MDD, (b) comparative foaming phenomena of PG, HC and PGU for coarse homogenization. Parameters are similar to that indicated in
the Fig. 5.
1270 S. Abbas et al. / Ultrasonics Sonochemistry 21 (2014) 1265–1274
saturated. In the final phase, further increase of concentration re-
sulted in the sudden increase in PDI. This behavior could be due
to the insufficient energy input at increased continuous phase vis-
cosity, although, emulsifier was present in excess [22]. Further-
more, such conditions may lead to aggregation of emulsifier
molecules instead of their uniform distribution on the oil–water
interface [26]. Narrowest distribution (0.132) was found for 1.5%
w/v concentration of PGU.
f-potential is considered an important parameter to assess the
emulsions stability as it governs the degree of repulsion between
similarly charged dispersed droplets. f-potentials of droplets for
all emulsifiers were negative which can be related to the presence
of negatively charged (carboxylic) groups on the modified starch
molecules [41]. The f-potential ranged from À29 to À30 mV and
À26 to À30 mV for PG and HC, respectively. Surprisingly, negative
f-potential for PGU, i.e., À42 to À43 mV was much higher as
Table 2
Energy dissipated and power input (power density) supplied to samples.
Sample Applied power (% of 1200
W)
a
Sonication time
(min)
Energy dissipated (kJ) Input power (W) Power density (W/mL)
PG
5%
HC
5%
PGU
1%
PG 5% HC 5% PGU
1%
PG
5%
HC
5%
PGU
1%
1 10 2 4.91 5.04 5.24 40.92 42.0 43.67 0.82 0.84 0.87
2 20 2 6.54 6.72 6.99 54.2 56.0 58.25 1.09 1.12 1.16
3 30 2 7.36 7.14 7.42 61.33 59.5 61.83 1.23 1.19 1.24
4 40 2 8.18 8.40 8.73 68.17 70.0 72.75 1.36 1.40 1.45
5 50 2 9.81 9.24 10.04 81.75 77.0 83.67 1.64 1.54 1.67
6 60 2 11.86 10.93 11.35 98.83 91.08 94.58 1.98 1.82 1.89
7 70 2 12.27 12.26 12.67 102.25 102.17 105.58 2.04 2.04 2.11
8 40 7 – – 28.55
b
– – 67.98 – – 1.36
a
Maximum equipment power: 1200 W.
b
PGU concentration: 1.5% (w/v).
03691215
100
110
120
130
140
150
160
170
180
MDD (nm)
PDI
ZP (mV)
Curcumin concentration added (mg/ml)
0.05
0.10
0.15
0.20
0.25
0.30
0.35
0.40
MDD (nm)
ZP
PDI
-45
-40
-35
-30
-25
-20
-15
-10
-5
0
5
10
0.02 0.04 0.06 0.08 0.10 0.12 0.14
100
110
120
130
140
150
160
170
180
MDD (nm)
PDI
ZP (mV)
Oil volume fraction
0.05
0.10
0.15
0.20
0.25
0.30
0.35
0.40
MDD (nm)
ZP
PDI
-40
-30
-20
-10
0
10
(a)
(b)
Fig. 7. MDD, PDI and f-potential of PGU(1.5% w/v)-stabilized nanoemulsion droplets, prepared at power density of 1.36 W/mL and 7 min sonication time, as affected by (a)
curcumin load at 0.05 oil
u
, (b) varying oil
u
at 6 mg/mL curcumin load.
S. Abbas et al. / Ultrasonics Sonochemistry 21 (2014) 1265–1274
1271
compared to values reported in the previous studies [42,43]. Our
results suggested that PGU offered better stability to MCT-based
blank O/W emulsions, and droplet charge was almost unaffected
by the variation in the emulsifiers concentration.
3.5. Effect of emulsifier-type on MDD, PDI and ZP of loaded
nanoemulsions
Effect of emulsifiers-type on the particle size and PDI of curcu-
min-loaded nanoemulsions is shown in Fig. 5a. In the first step, the
loading capacity of the MCT oil for curcumin was determined by
dissolving series of concentrations. From our preliminary work (re-
sults not shown), it was noted that the maximum curcumin load-
ing without significantly increasing the MDD and PDI was 10 mg/
mL of added curcumin (oil loading capacity: 93.1 ± 0.07%). There-
fore, the actual concentration of curcumin in the oil used in this
set of experiments was 9.3 mg/mL. Results revealed that MDD of
blank OSA-stabilized emulsions were found almost similar for all
three emulsifiers while PDI for PGU-stabilized emulsion (0.121)
was comparatively better than that of conventional OSA starches,
thus, indicating the potential of PGU as an emulsion stabilizer. In
the case of loaded emulsions prepared from two conventional
emulsifiers, MDD and PDI were similar while PGU performed bet-
ter with lowest MDD (146.0 ± 1.56 nm) and PDI (0.15) at 3.3 times
lesser concentration than that of conventional emulsifiers. Addi-
tionally, higher negative charge (À39.4 mV) was found on the
PGU-stabilized curcumin-loaded nano-droplets as compared to
PG (À26.15 mV) or HC (À29 mV) stabilized nanoemulsions
(Fig. 5b).
3.6. Size stability of loaded nanoemulsions and foam formation of
coarse emulsions
One month storage at 25 °C for all three types of OSA-starch-
stabilized nanoemulsions showed that PGU performed better in
terms of MDD (164.1 nm) as compared to conventional OSA
starches (182 and 216 nm for HC and PG, respectively) (Fig. 6a).
Although, lipid drops of nanoemulsions were still stable, dark col-
ored sediments were found at the bottom of all three samples. Sim-
ilar results were found for nanoemulsion-based delivery systems
of polymethoxyflavone, which is poorly water-soluble bioactive
compound [44,45]. In our case, possible reason for sedimentation
over prolong storage could be the nucleation and formation of cur-
cumin crystals under the influence of supersaturation as high tem-
perature (100 °C) was used to dissolve the curcumin into oil.
Furthermore, coarse emulsification process for PG and HC was
challenging due to foaming issue (Fig. 6b). Results showed that
among all three modified starches, PGU-stabilized emulsions were
least affected by the foaming problem (
e
= 0.95) followed by HC
(
e
= 0.80) and PG (
e
= 0.76). Due to these favorable characteristics,
PGU was selected as an emulsifier/stabilizer in the further studies.
3.7. Effect of curcumin load and
u
on the MDD, PDI and f-potential
PGU-stabilized emulsions were prepared from curcumin-loaded
MCT oil with different concentrations (see Table 1) of curcumin at
standardized conditions (power density: 1.36 W/mL), sonication
time: 7 min, 1.5% (w/v) PGU) to study the effect of bioactive con-
centration on the MDD, PDI and f-potential of the emulsion, as
Fig. 8. Confocal laser scanning microscopy (CLSM) of conventional emulsions and ultrasound-assisted nanoemulsion.
1272 S. Abbas et al. / Ultrasonics Sonochemistry 21 (2014) 1265–1274
shown in Fig. 7a. Volume fraction of oil was kept constant at 0.05
for all formulations. Based on the results (Fig. 7a), MDD (143–
148.6 nm), PDI (0.13–0.16) and f-potential (À39.4 to À42 mV)
were almost unaffected at all curcumin concentrations. However,
sediments were observed at the container bottom at higher curcu-
min concentrations. Sedimentation occurred within hours to few
days depending upon the concentration of dispersed/dissolved cur-
cumin. It was observed that curcumin concentration of 66 mg/mL
MCT was successfully dissolved and incorporated into the nano-
emulsion without the sediment growth during 1 month storage
period. Consequently, a nanoemulsion formulation consisting low-
er curcumin concentration, that is, 5.6 ± 0.213 mg/mL MCT (6 mg/
mL MCT of added curcumin) was preferred for further studies.
To study the effect of oil volume fraction (
u
) on MDD, PDI and f-
potential of the emulsion droplets, emulsions were prepared using
five different oil levels (Table 1). MCT used in this set of experi-
ments was loaded with about 5.6 ± 0.213 mg/mL MCT of curcumin.
Increase of
u
above 0.05 resulted in gradual increase of MDD
(Fig. 7b). Similar results were obtained by Guo and Mu [46] in
the preparation of corn oil–water emulsions stabilized by sweet
potato proteins. This could be, either due to the decreased coverage
of OSA-modified starch at higher
u
, or increased viscosity of emul-
sion [47], as it requires higher energy input for droplet disruption,
thus, triggering droplet aggregation and coalescence. As
u
in-
creased from 0.05 to 0.11, MDD increased from 145.4 ± 0.85 to
178.0 ± 1.06 nm. Furthermore, minimum PDI value (0.11 ± 0.02)
was recorded at 0.02
u
while negative f-potential was ranged from
À39.0 to À35.15 mV when
u
increased from 0.02 to 0.14.
3.7.1. Microscopic images of conventional emulsions and
nanoemulsions
The Nile Red fluorescent probe dyed oil droplets of PGU-stabi-
lized emulsions were observed by confocal laser scanning micros-
copy (CLSM), as shown in Fig. 8. The oil droplets present in the
coarse emulsion were micron size with a spherical shape and
poly-dispersed size distribution. Under the influence of high-inten-
sity ultrasonic homogenization, curcumin-enriched oil droplets of
micron size went through the process of size (MDD) reduction
due to cavitational forces. Though, it was challenging to observe
the structure and further details of nanosize emulsion droplets
by using the CLSM, this technique was used for the comparative
imagery of micro and nanosize emulsions. Cryogenic Transmission
Electron Microscopy (Cryo-TEM) could be a better choice for the
detailed study of starch-stabilized nanoemulsions [48].
4. Conclusions
Ultrasound-assisted nanoemulsions were prepared and stabi-
lized successfully by OSA-starches. Although, nanoemulsions were
produced at all levels, optimum process and formulation parame-
ters values were identified for the preparation of emulsion with
smallest size droplets at lowest possible delivered power and son-
ication time. Furthermore, minimum emulsifier concentrations
and maximum loading % of curcumin in MCT were found for the
formation of stable emulsions. It was noted that 40% of applied
power (power density: 1.45 W/mL) and 7 min sonication time
was optimum. Among three OSA-starch based emulsifiers used,
PGU performed the best at 1.5% (w/v) concentration (power
density: 1.36 W/mL) with smallest droplet diameter
(140.25 ± 2.77 nm) while higher concentrations of PG and HC were
needed to achieve optimal results. PDI was below 0.2 for all PGU
concentrations while negative charge on PGU-stabilized blank
emulsion droplets was higher in all samples (À41.7 to À43.0) than
that of PG and HC-stabilized droplets. PGU-stabilized emulsions
stored for 4 weeks at room temperature were found to be the most
stable (MDD increased from 146.0 to 164.1 ± 0.85 nm) with nar-
rowest size distribution (0.09 ± 0.01). Curcumin loading increase
had no effect on MDD, PDI and charge. When higher concentrations
of curcumin, that is, more than 6 mg/mL dissolved/dispersed in
MCT, sediments appeared within few hours to few days of prepa-
ration, when stored at room temperature. Curcumin concentration
of 6 mg/mL (actual concentration: 5.6 ± 0.213) and 0.05 volume
fraction of curcumin-loaded MCT oil was found optimum for the
preparation of 1.5% (w/v) PGU-stabilized emulsion of smallest
MDD, i.e., 145.4 ± 0.85 nm, having 0.15 PDI and 39.4 ± 1.84 mV f-
potential. CLSM images confirmed that the ultrasonic homogeniza-
tion successfully broke down the micro size oil droplets into nano-
size. Optimized nanoemulsion could be used as a template for the
fabrication of multilayered food-grade nanoemulsions or
nanoparticles.
Acknowledgment
This study was supported by the National Key Technology R&D
Program of China (2011BAD23B04) and (2013AA102204).
References
[1] D.J. McClements, Emulsion design to improve the delivery of functional
lipophilic components, Annu. Rev. Food Sci. Technol. 1 (2010) 241–269
.
[2] D.J. McClements, Nanoemulsions versus microemulsions: terminology,
differences, and similarities, Soft Matter 8 (2012) 1719–1729
.
[3] T.G. Mason, J.N. Wilking, K. Meleson, C.B. Chang, S.M. Graves, Nanoemulsions:
formation, structure, and physical properties, J. Phys.: Condens. Matter 18
(2006) R635–R666
.
[4] Q. Huang, H. Yu, Q. Ru, Bioavailability and delivery of nutraceuticals using
nanotechnology, J. Food Sci. 75 (2010) R50–R57
.
[5] E. Acosta, Bioavailability of nanoparticles in nutrient and nutraceutical
delivery, Curr. Opin. Colloid Interface Sci. 14 (2009) 3–15
.
[6] S.J. Lee, S.J. Choi, Y. Li, E.A. Decker, D.J. McClements, Protein-stabilized
nanoemulsions and emulsions: comparison of physicochemical stability,
lipid oxidation, and lipase digestibility, J. Agric. Food Chem. 59 (2011) 415–
427
.
[7] H. Yu, K. Shi, D. Liu, Q. Huang, Development of a food-grade organogel with
high bioaccessibility and loading of curcuminoids, Food Chem. 131 (2012) 48–
54
.
[8] S. Jafari, Y. He, B. Bhandari, Optimization of nano-emulsions production by
microfluidization, Eur. Food Res. Technol. 225 (2007) 733–741
.
[9] C. Qian, E.A. Decker, H. Xiao, D.J. McClements, Inhibition of b-carotene
degradation in oil-in-water nanoemulsions: influence of oil-soluble and
water-soluble antioxidants, Food Chem. 135 (2012) 1036–1043
.
[10] O.S. El Kinawy, S. Petersen, J. Ulrich, Technological aspects of nanoemulsion
formation of low-fat foods enriched with vitamin E by high-pressure
homogenization, Chem. Eng. Technol. 35 (2012) 937–940
.
[11] Y. Yuan, Y. Gao, J. Zhao, L. Mao, Characterization and stability evaluation of b-
carotene nanoemulsions prepared by high pressure homogenization under
various emulsifying conditions, Food Res. Int. 41 (2008) 61–68
.
[12] O. Kaltsa, C. Michon, S. Yanniotis, I. Mandala, Ultrasonic energy input influence
on the production of sub-micron o/w emulsions containing whey protein and
common stabilizers, Ultrason. Sonochem. 20 (2013) 881–891
.
[13] A. Karadag, X. Yang, B. Ozcelik, Q. Huang, Optimization of preparation
conditions for quercetin nanoemulsions using response surface
methodology, J. Agric. Food Chem. 61 (2013) 2130–2139
.
[14] V. Ghosh, A. Mukherjee, N. Chandrasekaran, Ultrasonic emulsification of food-
grade nanoemulsion formulation and evaluation of its bactericidal activity,
Ultrason. Sonochem. 20 (2013) 338–344
.
[15] T.S.H. Leong, T.J. Wooster, S.E. Kentish, M. Ashokkumar, Minimising oil droplet
size using ultrasonic emulsification, Ultrason. Sonochem. 16 (2009) 721–727
.
[16] T.J. Mason, L. Paniwnyk, F. Chemat, M. Abert Vian, Ultrasonic food processing,
in: A. Proctor (Ed.), Alternatives to Conventional Food Processing, The Royal
Society of Chemistry, 2011, pp. 387–414
.
[17] F. Chemat, H. Zill e, M.K. Khan, Applications of ultrasound in food technology:
processing, preservation and extraction, Ultrason. Sonochem. 18 (2011) 813–
835
.
[18] S. Kentish, T.J. Wooster, M. Ashokkumar, S. Balachandran, R. Mawson, L.
Simons, The use of ultrasonics for nanoemulsion preparation, Innov. Food Sci.
Emerg. Technol. 9 (2008) 170–175
.
[19] T. Delmas, H. Piraux, A C. Couffin, I. Texier, F. Vinet, P. Poulin, M.E. Cates, J.
Bibette, How to prepare and stabilize very small nanoemulsions, Langmuir 27
(2011) 1683–1692
.
[20] S. Abbas, K. Hayat, E. Karangwa, M. Bashari, X.M. Zhang, An overview of
ultrasound-assisted food-grade nanoemulsions, Food Eng. Rev. 5 (2013) 139–
157
.
S. Abbas et al. / Ultrasonics Sonochemistry 21 (2014) 1265–1274
1273
[21] T.J. Wooster, M. Golding, P. Sanguansri, Impact of oil type on nanoemulsion
formation and ostwald ripening stability, Langmuir 24 (2008) 12758–12765
.
[22] S.M. Jafari, E. Assadpoor, Y. He, B. Bhandari, Re-coalescence of emulsion
droplets during high-energy emulsification, Food Hydrocolloids 22 (2008)
1191–1202
.
[23] D.T. Piorkowski, D.J. McClements, Beverage emulsions: recent developments in
formulation, production, and applications, Food Hydrocolloids (2013), http://
dx.doi.org/10.1016/j.foodhyd.2013.1007.1009.
[24] C. Qian, E. Decker, H. Xiao, D. McClements, Comparison of biopolymer
emulsifier performance in formation and stabilization of orange oil-in-water
emulsions, J. Am. Oil Chem. Soc. 88 (2011) 47–55
.
[25] R. Liang, C.F. Shoemaker, X. Yang, F. Zhong, Q. Huang, Stability and
bioaccessibility of b-carotene in nanoemulsions stabilized by modified
starches, J. Agric. Food Chem. 61 (2013) 1249–1257
.
[26] M.C. Sweedman, M.J. Tizzotti, C. Schäfer, R.G. Gilbert, Structure and
physicochemical properties of octenyl succinic anhydride modified starches:
a review, Carbohydr. Polym. 92 (2013) 905–920
.
[27] L. Pari, D. Tewas, J. Eckel, Role of curcumin in health and disease, Arch. Physiol.
Biochem. 114 (2008) 127–149
.
[28] M.M. Yallapu, M. Jaggi, S.C. Chauhan, Curcumin nanoformulations: a future
nanomedicine for cancer, Drug Discov. Today 17 (2012) 71–80
.
[29] K. Ahmed, Y. Li, D.J. McClements, H. Xiao, Nanoemulsion- and emulsion-based
delivery systems for curcumin: encapsulation and release properties, Food
Chem. 132 (2012) 799–807
.
[30] X. Wang, Y. Jiang, Y W. Wang, M T. Huang, C T. Ho, Q. Huang, Enhancing
anti-inflammation activity of curcumin through O/W nanoemulsions, Food
Chem. 108 (2008) 419–424
.
[31] D.J. McClements, Crystals and crystallization in oil-in-water emulsions:
implications for emulsion-based delivery systems, Adv. Colloid Interface Sci.
174 (2012) 1–30
.
[32] B.K. Tiwari, K. Muthukumarappan, C.P. O’Donnell, P.J. Cullen, Effects of
sonication on the kinetics of orange juice quality parameters, J. Agric. Food
Chem. 56 (2008) 2423–2428
.
[33] K. Prasad, D.V. Pinjari, A.B. Pandit, S.T. Mhaske, Synthesis of titanium dioxide
by ultrasound assisted sol–gel technique: effect of amplitude (power density)
variation, Ultrason. Sonochem. 17 (2010) 697–703
.
[34] D.V. Pinjari, K. Prasad, P.R. Gogate, S.T. Mhaske, A.B. Pandit, Intensification of
synthesis of zirconium dioxide using ultrasound: effect of amplitude variation,
Chem. Eng. Process (2013), />[35] S.M. Jafari, Y. He, B. Bhandari, Production of sub-micron emulsions by
ultrasound and microfluidization techniques, J. Food Eng. 82 (2007) 478–488
.
[36] T. Hielscher, Ultrasonic production of nano-size dispersions and emulsions, in:
Dans European Nano Systems Workshop-ENS, Paris, France, 2005. <http://
hal.archives-ouvertes.fr/docs/00/16/69/96/PDF/1048.pdf> (accessed
November 2013).
[37] H. Schubert, R. Engel, Product and formulation engineering of emulsions,
ChERD 82 (2004) 1137–1143
.
[38] X. Wang, X. Li, L. Chen, F. Xie, L. Yu, B. Li, Preparation and characterisation of
octenyl succinate starch as a delivery carrier for bioactive food components,
Food Chem. 126 (2011) 1218–1225
.
[39] E. Nazarzadeh, S. Sajjadi, Viscosity effects in miniemulsification via ultrasound,
AIChE J. 56 (2010) 2751–2755
.
[40] L.M. Braginsky, M.A. Belevitskaya, Kinetics of droplets breakup in agitated
vessels, in: N.N. Kulov (Ed.), Liquid–liquid Systems, Nova Science, Commack,
New York, 1996
.
[41] L. Nilsson, B. Bergenståhl, Adsorption of hydrophobically modified anionic
starch at oppositely charged oil/water interfaces, J. Colloid Interface Sci. 308
(2007) 508–513
.
[42] R. Charoen, A. Jangchud, K. Jangchud, T. Harnsilawat, O. Naivikul, D.J.
McClements, Influence of biopolymer emulsifier type on formation and
stability of rice bran oil-in-water emulsions: whey protein, gum arabic, and
modified starch, J. Food Sci. 76 (2011) E165–E172
.
[43] R. Charoen, A. Jangchud, K. Jangchud, T. Harnsilawat, E.A. Decker, D.J.
McClements, Influence of interfacial composition on oxidative stability of
oil-in-water emulsions stabilized by biopolymer emulsifiers, Food Chem. 131
(2012) 1340–1346
.
[44] Y. Li, J. Zheng, H. Xiao, D.J. McClements, Nanoemulsion-based delivery systems
for poorly water-soluble bioactive compounds: influence of formulation
parameters on polymethoxyflavone crystallization, Food Hydrocolloids 27
(2012) 517–528
.
[45] Y. Li, H. Xiao, D. McClements, Encapsulation and delivery of crystalline
hydrophobic nutraceuticals using nanoemulsions: factors affecting
polymethoxyflavone solubility, Food Biophys. 7 (2012) 341–353
.
[46] Q. Guo, T.H. Mu, Emulsifying properties of sweet potato protein: effect of
protein concentration and oil volume fraction, Food Hydrocolloids 25 (2011)
98–106
.
[47] J. Floury, A. Desrumaux, J. Lardières, Effect of high-pressure homogenization
on droplet size distributions and rheological properties of model oil-in-water
emulsions, Innov. Food Sci. Emerg. Technol. 1 (2000) 127–134
.
[48] C. Preetz, A. Rübe, I. Reiche, G. Hause, K. Mäder, Preparation and
characterization of biocompatible oil-loaded polyelectrolyte nanocapsules,
Nanomed-Nanotechnol. 4 (2008) 106–114
.
1274 S. Abbas et al. / Ultrasonics Sonochemistry 21 (2014) 1265–1274