Financial managment Solution Manual:The Basics of Capital Budgeting
Bạn đang xem bản rút gọn của tài liệu. Xem và tải ngay bản đầy đủ của tài liệu tại đây (223.26 KB, 39 trang )
After reading this chapter, students should be able to:
• Define capital budgeting, explain why it is important, and state how
project proposals are generally classified.
• List the steps involved in evaluating a capital budgeting project.
• Calculate payback period, discounted payback period, Net Present Value
(NPV), and Internal Rate of Return (IRR) for a given project and
evaluate each method.
• Define NPV profiles, and explain the rationale behind the NPV and IRR
methods, their reinvestment rate assumptions, and which method is better
when evaluating independent versus mutually exclusive projects.
• Briefly explain the problem of multiple IRRs and when this situation
could occur.
• Calculate the Modified Internal Rate of Return (MIRR) for a given
project and evaluate this method.
• Identify at least one relevant piece of information provided to decision
makers for each capital budgeting decision method discussed in the
chapter.
• Identify and explain the purposes of the post-audit in the capital
budgeting process.
• Identify a number of different types of decisions that use the capital
budgeting techniques developed in this chapter.
Learning Objectives: 10 - 1
Chapter 10
The Basics of Capital Budgeting
LEARNING OBJECTIVES
This is a relatively straight-forward chapter, and, for the most part, it is a
direct application of the time value concepts first discussed in Chapter 6.
We point out that capital budgeting is to a company what buying stocks or
bonds is to an individual an investment decision, when the company wants to
know if the expected value of the cash flows is greater than the cost of the
project, and whether or not the expected rate of return on the project exceeds
the cost of the funds required to take on the project. We cover the standard
capital budgeting procedures payback, discounted payback, NPV, IRR, and MIRR.
At this point, students who have not yet mastered time value concepts
and how to use their calculator efficiently get another chance to catch on.
Students who have mastered those tools and concepts have fun, because they can
see what is happening and the usefulness of what they are learning.
The details of what we cover, and the way we cover it, can be seen by
scanning Blueprints, Chapter 10. For other suggestions about the lecture,
please see the “Lecture Suggestions” in Chapter 2, where we describe how we
conduct our classes.
DAYS ON CHAPTER: 3 OF 58 DAYS (50-minute periods)
Lecture Suggestions: 10 - 2
LECTURE SUGGESTIONS
10-1 Project classification schemes can be used to indicate how much analysis
is required to evaluate a given project, the level of the executive who
must approve the project, and the cost of capital that should be used to
calculate the project’s NPV. Thus, classification schemes can increase
the efficiency of the capital budgeting process.
10-2 The NPV is obtained by discounting future cash flows, and the
discounting process actually compounds the interest rate over time.
Thus, an increase in the discount rate has a much greater impact on a
cash flow in Year 5 than on a cash flow in Year 1.
10-3 This question is related to Question 10-2 and the same rationale
applies. With regard to the second part of the question, the answer is
no; the IRR rankings are constant and independent of the firm’s cost of
capital.
10-4 The NPV and IRR methods both involve compound interest, and the
mathematics of discounting requires an assumption about reinvestment
rates. The NPV method assumes reinvestment at the cost of capital,
while the IRR method assumes reinvestment at the IRR. MIRR is a
modified version of IRR that assumes reinvestment at the cost of
capital.
10-5 The statement is true. The NPV and IRR methods result in conflicts only
if mutually exclusive projects are being considered since the NPV is
positive if and only if the IRR is greater than the cost of capital. If
the assumptions were changed so that the firm had mutually exclusive
projects, then the IRR and NPV methods could lead to different
conclusions. A change in the cost of capital or in the cash flow
streams would not lead to conflicts if the projects were independent.
Therefore, the IRR method can be used in lieu of the NPV if the projects
being considered are independent.
10-6 Yes, if the cash position of the firm is poor and if it has limited
access to additional outside financing it might be better off to choose
a machine with a rapid payback. But even here, the relationship between
present value and cost would be a better decision tool.
10-7 a. In general, the answer is no. The objective of management should be
to maximize value, and as we point out in subsequent chapters, stock
values are determined by both earnings and growth. The NPV
calculation automatically takes this into account, and if the NPV of
a long-term project exceeds that of a short-term project, the higher
future growth from the long-term project must be more than enough to
compensate for the lower earnings in early years.
Answers and Solutions: 10 - 3
ANSWERS TO END-OF-CHAPTER QUESTIONS
b. If the same $100 million had been spent on a short-term project one
with a faster payback reported profits would have been higher for a
period of years. This is, of course, another reason why firms
sometimes use the payback method.
10-8 Mutually exclusive projects are a set of projects in which only one of
the projects can be accepted. For example, the installation of a
conveyor-belt system in a warehouse and the purchase of a fleet of
forklifts for the same warehouse would be mutually exclusive projects
accepting one implies rejection of the other. When choosing between
mutually exclusive projects, managers should rank the projects based on
the NPV decision rule. The mutually exclusive project with the highest
positive NPV should be chosen. The NPV decision rule properly ranks the
projects because it assumes the appropriate reinvestment rate is the
cost of capital.
10-9 Project X should be chosen over Project Y. Since the two projects are
mutually exclusive, only one project can be accepted. The decision rule
that should be used is NPV. Since Project X has the higher NPV, it
should be chosen. The cost of capital used in the NPV analysis
appropriately includes risk.
Answers and Solutions: 10 - 4
10-1 $52,125/$12,000 = 4.3438, so the payback is about 4 years.
10-2 Financial Calculator Solution: Input CF
0
= -52125, CF
1-8
= 12000, I =
12, and then solve for NPV = $7,486.68.
10-3 Financial Calculator Solution: Input CF
0
= -52125, CF
1-8
= 12000, and
then solve for IRR = 16%.
10-4 Project K’s discounted payback period is calculated as follows:
Annual Discounted @12%
Period Cash Flows Cash Flows Cumulative
0 ($52,125) ($52,125.00) ($52,125.00)
1 12,000 10,714.29 (41,410.71)
2 12,000 9,566.33 (31,844.38)
3 12,000 8,541.36 (23,303.02)
4 12,000 7,626.22 (15,676.80)
5 12,000 6,809.12 (8,867.68)
6 12,000 6,079.57 (2,788.11)
7 12,000 5,428.19 2,640.08
8 12,000 4,846.60 7,486.68
The discounted payback period is 6 +
19.8$5,42
11$2,788.
years, or 6.51 years.
Alternatively, since the annual cash flows are the same, one can divide
$12,000 by 1.12 (the discount rate = 12%) to arrive at CF
1
and then
continue to divide by 1.12 seven more times to obtain the discounted
cash flows (Column 3 values). The remainder of the analysis would be
the same.
10-5 MIRR: PV Costs = $52,125.
FV Inflows:
PV
FV
0 1 2 3 4 5 6 7 8
| | | | | | | | |
12,000 12,000 12,000 12,000 12,000 12,000 12,000 12,000
13,440
15,053
16,859
18,882
21,148
23,686
Answers and Solutions: 10 - 5
SOLUTIONS TO END-OF-CHAPTER PROBLEMS
12%
× 1.12
× (1.12)
2
× (1.12)
3
× (1.12)
4
× (1.12)
5
× (1.12)
6
× (1.12)
7
26,528
52,125 MIRR =
13.89% 147,596
Financial Calculator Solution: Obtain the FVA by inputting N = 8, I =
12, PV = 0, PMT = 12000, and then solve for FV = $147,596. The MIRR can
be obtained by inputting N = 8, PV = -52125, PMT = 0, FV = 147596, and
then solving for I = 13.89%.
10-6 Project A:
Using a financial calculator, enter the following:
CF
0
= -15000000
CF
1
= 5000000
CF
2
= 10000000
CF
3
= 20000000
I = 10; NPV = $12,836,213.
Change I = 10 to I = 5; NPV = $16,108,952.
Change I = 5 to I = 15; NPV = $10,059,587.
Project B:
Using a financial calculator, enter the following:
CF
0
= -15000000
CF
1
= 20000000
CF
2
= 10000000
CF
3
= 6000000
I = 10; NPV = $15,954,170.
Change I = 10 to I = 5; NPV = $18,300,939.
Change I = 5 to I = 15; NPV = $13,897,838.
10-7 Truck:
Financial Calculator Solution: Input CF
0
= -17100, CF
1-5
= 5100, I = 14,
and then solve for NPV = $408.71 ≈ $409 and IRR = 1499% ≈ 15%.
MIRR: PV Costs = $17,100.
FV Inflows:
PV FV
0 1 2 3 4 5
| | | | | |
5,100 5,100 5,100 5,100 5,100
5,814
6,628
Answers and Solutions: 10 - 6
14%
× (1.14)
2
× 1.14
× (1.14)
3
7,556
8,614
17,100 MIRR = 14.54% (Accept) 33,712
Financial Calculator Solution: Obtain the FVA by inputting N = 5, I =
14, PV = 0, PMT = 5100, and then solve for FV = $33,712. The MIRR can
be obtained by inputting N = 5, PV = -17100, PMT = 0, FV = 33712, and
then solving for I = MIRR = 14.54%.
Pulley:
Financial Calculator Solution: Input CF
0
= -22430, CF
1-5
= 7500, I = 14,
and then solve for NPV = $3,318.11 ≈ $3,318 and IRR = 20%.
MIRR: PV Costs = $22,430.
FV Inflows:
PV FV
0 1 2 3 4 5
| | | | | |
7,500 7,500 7,500 7,500 7,500
8,550
9,747
11,112
12,667
22,430 MIRR = 17.19% (Accept) 49,576
Financial Calculator Solution: Obtain the FVA by inputting N = 5, I =
14, PV = 0, PMT = 7500, and then solve for FV = $49,576. The MIRR can
be obtained by inputting N = 5, PV = -22430, PMT = 0, FV = 49576, and
then solving for I = 17.19%.
10-8 Using a financial calculator:
NPV
S
= $448.86; NPV
L
= $607.20.
IRR
S
= 15.24%; IRR
L
= 14.67%.
MIRR:
PV costs
S
= $15,000.
FV inflows
S
= $29,745.47.
MIRR
S
= 14.67%.
PV costs
L
= $37,500.
FV inflows
L
= $73,372.16.
MIRR
L
= 14.37%.
Thus, NPV
L
> NPV
S
, IRR
S
> IRR
L
, and MIRR
S
> MIRR
L
. The scale difference
between Projects S and L results in IRR and MIRR selecting S over L.
However, NPV favors Project L, and hence Project L should be chosen.
Answers and Solutions: 10 - 7
14%
× (1.14)
4
× (1.14)
3
× (1.14)
4
× (1.14)
2
× 1.14
10-9 a. The IRRs of the two alternatives are undefined. To calculate an IRR,
the cash flow stream must include both cash inflows and outflows.
b. The PV of costs for the conveyor system is -$556,717, while the PV of
costs for the forklift system is -$493,407. Thus, the forklift
system is expected to be -$493,407 - (-$556,717) = $63,310 less
costly than the conveyor system, and hence the forklifts should be
used.
10-10 Project X: 0 1 2 3 4
| | | | |
-1,000 100 300 400 700.00
448.00
376.32
140.49
1,000 13.59% = MIRR
X
1,664.81
$1,000 = $1,664.81/(1 + MIRR
X
)
4
.
Project Y: 0 1 2 3 4
| | | | |
-1,000 1,000 100 50 50.00
56.00
125.44
1,404.93
1,000 13.10% = MIRR
Y
1,636.37
$1,000 = $1,636.37/(1 + MIRR
Y
)
4
.
Thus, since MIRR
X
> MIRR
Y
, Project X should be chosen.
Alternate step: You could calculate NPVs, see that Project X has the
higher NPV, and just calculate MIRR
X
.
NPV
X
= $58.02 and NPV
Y
= $39.94.
10-11 Input the appropriate cash flows into the cash flow register, and then
calculate NPV at 10 percent and the IRR of each of the projects:
Project S: NPV
S
= $39.14; IRR
S
= 13.49%.
Project L: NPV
L
= $53.55; IRR
L
= 11.74%.
Since Project L has the higher NPV, it is the better project.
IRR
L
= 11.74%.
10-12 Step 1: Determine the PMT:
0 1
10
Answers and Solutions: 10 - 8
12%
12%
12%
× 1.12
× (1.12)
2
× (1.12)
3
× 1.12
× (1.12)
2
× (1.12)
3
| | • • • |
-1,000 PMT
PMT
With a financial calculator, input N = 10, I = 12, PV = -1000,
and FV = 0 to obtain PMT = $176.98.
Step 2: Calculate the project’s MIRR:
0 1 2 9 10
| | | • • • | |
-1,000 176.98 176.98 176.98 176.98
194.68
.
.
.
379.37
417 .31
1,000 10.93% = MIRR
FV of inflows: With a financial calculator, input N = 10, I =
10, PV = 0, and PMT = -176.98 to obtain FV = $2,820.61. Then
input
N = 10, PV = -1000, PMT = 0, and FV = 2820.61 to obtain
I = MIRR = 10.93%.
10-13 a. Purchase price $ 900,000
Installation 165,000
Initial outlay $1,065,000
CF
0
= -1065000; CF
1-5
= 350000; I = 14; NPV = ?
NPV = $136,578; IRR = 19.22%.
b. Ignoring environmental concerns, the project should be undertaken
because its NPV is positive and its IRR is greater than the firm’s
cost of capital.
c. Environmental effects could be added by estimating penalties or any
other cash outflows that might be imposed on the firm to help return
the land to its previous state (if possible). These outflows could
be so large as to cause the project to have a negative NPV, in which
case the project should not be undertaken.
10-14 a. Year Sales Royalties Marketing Net
0 ($20,000) ($20,000)
1 75,000 ($5,000) ($10,000) 60,000
2 52,500 (3,500) (10,000) 39,000
3 22,500 (1,500) 21,000
Payback period = $20,000/$60,000 = 0.33 year.
Answers and Solutions: 10 - 9
10%
× 1.10
× (1.10)
8
× (1.10)
9
NPV = $60,000/(1.11)
1
+ $39,000/(1.11)
2
+ $21,000/(1.11)
3
- $20,000
= $81,062.35.
Using a financial calculator, input CF
0
= -20000; CF
1
= 60000, CF
2
=
39000, CF
3
= 21000, and then solve for IRR = 261.90%.
b. Finance theory dictates that this investment should be accepted.
However, ask your students “Does this service encourage cheating?”
If yes, does a businessperson have a social responsibility not to
make this service available?
10-15 Facts: 5 years remaining on lease; rent = $2,000/month; 60 payments
left, payment at end of month.
New lease terms: $0/month for 9 months; $2,600/month for 51 months.
Cost of capital = 12% annual (1% per month).
a. 0 1 2
59 60
| | | • • • | |
-2,000 -2,000 -2,000 -2,000
PV cost of old lease: N = 60; I = 1; PMT = -2000; FV = 0; PV = ? PV
= -$89,910.08.
0 1
9
10 59 60
| | • • • | | • • • | |
0
0 -2,600 -2,600 -2,600
PV cost of new lease: CF
0
= 0, CF
1-9
= 0; CF
10-60
= -2600; I = 1. NPV
= -$94,611.45.
Sharon should not accept the new lease because the present value of
its cost is $94,611.45 - $89,910.08 = $4,701.37 greater than the old
lease.
b. 0 1 2
9
10 59 60
| | | • • • | | • • • | |
-2,000 -2,000
-2,000 PMT
PMT PMT
FV of first 9 months’ rent under old lease:
N = 9; I = 1; PV = 0; PMT = -2000; FV = ? FV = $18,737.05.
The FV of the first 9 months’ rent is equivalent to the PV of the 51-
period annuity whose payments represent the incremental rent during
months 10-60. To find this value:
N = 51; I = 1; PV = -18737.05; FV = 0; PMT = ? PMT = $470.80.
Thus, the new lease payment that will make her indifferent is $2,000
+ $470.80 = $2,470.80.
Check:
Answers and Solutions: 10 - 10
1%
1%
1%
0 1 9 10 59 60
| | • • • | | • • • | |
0
0 -2,470.80
-2,470.80 -2,470.80
PV cost of new lease: CF
0
= 0;
CF
9-1
= 0;
CF
60-10
= -2470.80; I = 1.
NPV = -$89,909.99.
Except for rounding; the PV cost of this lease equals the PV cost of
the old lease.
c. Period Old Lease New Lease ∆ Lease
0 0 0 0
1-9 -2,000 0 -2,000
10-60 -2,000 -2,600 600
CF
0
= 0; CF
1-9
= -2000; CF
10-60
= 600; IRR = ? IRR = 1.9113%. This is
the periodic rate. To obtain the nominal cost of capital, multiply
by 12: 12(0.019113) = 22.94%.
Check: Old lease terms:
N = 60; I = 1.9113; PMT = -2000; FV = 0; PV = ? PV = -$71,039.17.
New lease terms:
CF
0
= 0; CF
1-9
= 0; CF
10-60
= -2600; I = 1.9113; NPV = ? NPV = -
$71,038.98.
Except for rounding differences; the costs are the same.
10-16 a. The payback periods for Projects A and B are calculated as follows:
Project A Project B
Period Cash flows Cumulative (A) Cash flows Cumulative
(B)
0 ($400) ($400) ($600) ($600)
1 55 (345) 300 (300)
2 55 (290) 300 0
3 55 (235) 50 50
4 225 (10) 50 100
5 225 215 50 150
Project A's payback is 4 + $10/$225 = 4.04 years, while Project B's
payback is 2 years. According to the payback rule, Project B would
be preferred to Project A.
b. The discounted payback periods for Projects A and B are calculated as
follows:
Disc. @ 10% Disc. @ 10%
Project A Project B
Period Cash flows Cumulative (A) Cash flows Cumulative
(B)
0 ($400.00) ($400.00) ($600.00) ($600.00)
Answers and Solutions: 10 - 11
1%
1 50.00 (350.00) 272.73 (327.27)
2 45.45 (304.55) 247.93 (79.34)
3 41.32 (263.22) 37.57 (41.77)
4 153.68 (109.55) 34.15 (7.62)
5 139.71 30.16 31.05 23.42
Project A's payback is 4 + $109.55/$139.71 = 4.78 years, meanwhile
Project B's payback is 4 + $7.62/$31.05 = 4.245 years. According to
the discounted payback rule, Project B would be preferred to Project
A.
Answers and Solutions: 10 - 12
c. Finding net present values, use a financial calculator and enter the
following data:
Project A Project B
CF
0
= -400 CF
0
= -600
CF
1
= 55 CF
1
= 300
CF
2
= 55 CF
2
= 300
CF
3
= 55 CF
3
= 50
CF
4
= 225 CF
4
= 50
CF
5
= 225 CF
5
= 50
I = 10 I = 10
NPV = $30.16 NPV = $23.42
By the NPV criterion, Project A is preferred to Project B.
d. Finding the IRR, use a financial calculator and enter the following:
Project A Project B
CF
0
= -400 CF
0
= -600
CF
1
= 55 CF
1
= 300
CF
2
= 55 CF
2
= 300
CF
3
= 55 CF
3
= 50
CF
4
= 225 CF
4
= 50
CF
5
= 225 CF
5
= 50
IRR = 12.21% IRR = 12.28%
According to the IRR criterion, Project B is preferred to Project A.
e. Project A:
0 10% 1 2 3 4 5
| | | | | |
-400 55 55 55 225 225
247.50
66.55
73.21
80 .53
692.78
$400 = $692.78/(1 + MIRR
A
)
5
MIRR
A
= 11.61%.
Project B:
0 10% 1 2 3 4 5
| | | | | |
-600 300 300 50 50 50
55.00
60.50
399.30
439 .23
1,004.03
$600 = $1,004.03/(1 + MIRR
A
)
5
MIRR
A
= 10.85%.
Answers and Solutions: 10 - 13
× (1.10)
2
× 1.10
× (1.10)
3
× (1.10)
4
× (1.10)
2
× 1.10
× (1.10)
3
× (1.10)
4
According to the MIRR criterion, Project A is the superior project.
10-17 Since the IRR is the cost of capital at which the NPV of a project
equals zero, the projects inflows can be evaluated at the IRR and the
present value of these inflows must equal the initial investment.
Using a financial calculator enter the following:
CF
0
= 0
CF
1
= 7500
N
j
= 10
CF
1
= 10000
N
j
= 10
I = 10.98; NPV = $65,002.11.
Therefore, the initial investment for this project is $65,002.11. Using
a calculator, the project's NPV can now be solved.
CF
0
= -65002.11
CF
1
= 7500
N
j
= 10
CF
1
= 10000
N
j
= 10
I = 9; NPV = $10,239.20.
10-18 The MIRR can be solved with a financial calculator by finding the
terminal future value of the cash inflows and the initial present value
of cash outflows, and solving for the discount rate that equates these
two values. In this instance, the MIRR is given, but a cash outflow is
missing and must be solved for. Therefore, if the terminal future value
of the cash inflows is found, it can be entered into a financial
calculator, along with the number of years the project lasts and the
MIRR, to solve for the initial present value of the cash outflows. One
of these cash outflows occurs in Year 0 and the remaining value must be
the present value of the missing cash outflow in Year 2.
Cash inflows Compounding Rate FV in Year 5 @ 10%
CF
1
= 202 × (1.10)
4
295.75
CF
3
= 196 × (1.10)
2
237.16
CF
4
= 350 × 1.10 385.00
CF
5
= 451 × 1.00 451.00
1368.91
Using the financial calculator to solve for the present value of cash
outflows:
N = 5
I = 14.14
PV = ?
PMT = 0
FV = 1368.91
The total present value of cash outflows is $706.62, and since the outflow
Answers and Solutions: 10 - 14
for Year 0 is $500, the present value of the Year 2 cash outflow is
$206.62. Therefore, the missing cash outflow for Year 2 is $206.62 ×(1.1)
2
= $250.01.
10-19 a. At k = 12%, Project A has the greater NPV, specifically $200.41 as
compared to Project B’s NPV of $145.93. Thus, Project A would be
selected. At k = 18%, Project B has an NPV of $63.68 which is higher
than Project A’s NPV of $2.66. Thus, choose Project B if k = 18%.
b.
k NPV
A
NPV
B
0.0% $890 $399
10.0 283 179
12.0 200 146
18.1 0 62
20.0 (49) 41
24.0 (138) 0
30.0 (238) (51)
c. IRR
A
= 18.1%; IRR
B
= 24.0%.
d. To find the crossover rate, construct a Project ∆ which is the
difference in the two projects’ cash flows:
Project ∆ =
Year CF
A
- CF
B
0 $ 105
1 (521)
2 (327)
3 (234)
4 466
5 466
6 716
7 (180)
IRR
∆
= Crossover rate = 14.53%.
Answers and Solutions: 10 - 15
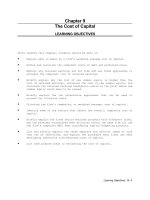
1,000
900
800
700
600
500
400
300
200
100
-100
-200
-300
5
10
15
20
25
30
Cost of
Capital (%)
NPV
($)
Project A
Project B
k (%)
5
10
15
20 25
NPV
(Millions of Dollars)
Plan B
Plan A
Crossover Rate = 16.07%
IRR
A
= 20%
0
2.4
6
12
18
24
30
IRR
B
= 16.7%
Projects A and B are mutually exclusive, thus, only one of the
projects can be chosen. As long as the cost of capital is greater
than the crossover rate, both the NPV and IRR methods will lead to
the same project selection. However, if the cost of capital is less
than the crossover rate the two methods lead to different project
selections a conflict exists. When a conflict exists the NPV method
must be used.
Because of the sign changes and the size of the cash flows, Project
∆ has multiple IRRs. Thus, a calculator’s IRR function will not work.
One could use the trial and error method of entering different discount
rates until NPV = $0. However, an HP can be “tricked” into giving the
roots. After you have keyed Project Delta’s cash flows into the cash
flow registers of an HP-10B, you will see an “Error-Soln” message. Now
enter 10 STO IRR/YR and the 14.53 percent IRR is found. Then
enter 100 STO IRR/YR to obtain IRR = 456.22%. Similarly, Excel
can also be used.
e. Here is the MIRR for Project A when k = 12%:
PV costs = $300 + $387/(1.12)
1
+ $193/(1.12)
2
+ $100/(1.12)
3
+ $180/(1.12)
7
= $952.00.
TV inflows = $600(1.12)
3
+ $600(1.12)
2
+ $850(1.12)
1
= $2,547.60.
Now, MIRR is that discount rate which forces the TV of $2,547.60 in
7 years to equal $952.00.
Using a financial calculator enter the following inputs: N = 7, PV =
-952, PMT = 0, and FV = 2547.60. Then solve for I = MIRR
A
= 15.10%.
Similarly, MIRR
B
= 17.03%.
At k = 18%,
MIRR
A
= 18.05%.
MIRR
B
= 20.49%.
10-20 a.
Answers and Solutions: 10 - 16
The crossover rate is approximately 16 percent. If the cost of
capital is less than the crossover rate, then Plan B should be
accepted; if the cost of capital is greater than the crossover rate,
then Plan A is preferred. At the crossover rate, the two projects’
NPVs are equal. Thus, other criteria such as the IRR must be used to
evaluate the projects. The exact crossover rate is calculated as
16.07 percent, the IRR of Project ∆, the difference between the cash
flow streams of the two projects.
b. Yes. Assuming (1) equal risk among projects, and (2) that the cost
of capital is a constant and does not vary with the amount of capital
raised, the firm would take on all available projects with returns
greater than its 12 percent cost of capital. If the firm had
invested in all available projects with returns greater than 12
percent, then its best alternative would be to repay capital. Thus,
the cost of capital is the correct reinvestment rate for evaluating a
project’s cash flows.
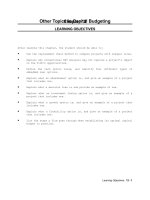
10-21 a. Using a financial calculator, we get:
NPV
A
= $14,486,808. NPV
B
= $11,156,893.
IRR
A
= 15.03%. IRR
B
= 22.26%.
b.
The crossover rate is somewhere between 11 percent and 12 percent.
The exact crossover rate is calculated as 11.7 percent, the IRR of
Project ∆, which represents the differences between the cash flow
streams of the two projects.
c. The NPV method implicitly assumes that the opportunity exists to
reinvest the cash flows generated by a project at the cost of
capital, while use of the IRR method implies the opportunity to
reinvest at the IRR. The firm will invest in all independent
projects with an NPV > $0. As cash flows come in from these
Answers and Solutions: 10 - 17
NPV
(Millions of Dollars)
5
10
1 5
20 25
20
40
60
80
0
-10
Crossover Rate = 11.7%
IRR
S
= 22.26%
IRR
A
= 15.03%
k (%)
projects, the firm will either pay them out to investors, or use them
as a substitute for outside capital which, in this case, costs 10
percent. Thus, since these cash flows are expected to save the firm
10 percent, this is their opportunity cost reinvestment rate.
The IRR method assumes reinvestment at the internal rate of return
itself, which is an incorrect assumption, given a constant expected
future cost of capital, and ready access to capital markets.
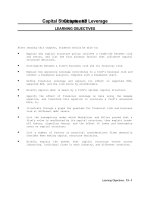
10-22 a. The project’s expected cash flows are as follows (in millions of
dollars):
Time Net Cash Flow
0 ($ 2.0)
1 13.0
2 (12.0)
We can construct the following NPV profile:
k NPV
0% ($1,000,000)
10 (99,174)
50 1,333,333
80 1,518,519
100 1,500,000
200 1,000,000
300 500,000
400 120,000
410 87,659
420 56,213
430 25,632
450 (33,058)
b. If k = 10%, reject the project since NPV < $0. Its NPV at k = 10% is
equal to -$99,174. But if k = 20%, accept the project because NPV >
$0. Its NPV at k = 20% is $500,000.
Answers and Solutions: 10 - 18
NPV
(Millions of Dollars)
1.5
1.0
0.5
0
-0.5
-1.0
0 100 200 300 400 500
k (%)
c. Other possible projects with multiple rates of return could be
nuclear power plants where disposal of radioactive wastes is required
at the end of the project’s life.
d. MIRR @ k = 10%:
PV costs = $2,000,000 + $12,000,000/(1.10)
2
= $11,917,355.
FV inflows = $13,000,000 × 1.10 = $14,300,000.
MIRR = 9.54%. (Reject the project since MIRR < k.)
Answers and Solutions: 10 - 19
MIRR @ k = 20%:
PV costs = $2,000,000 + $12,000,000/(1.20)
2
= $10,333,333.
FV inflows = $13,000,000 × 1.20 = $15,600,000.
MIRR = 22.87%. (Accept the project since MIRR > k.)
Looking at the results, this project’s MIRR calculations lead to the
same decisions as the NPV calculations. However, the MIRR method
will not always lead to the same accept/reject decision as the NPV
method. Decisions in which two mutually exclusive projects are
involved and differ in scale (size), MIRR can conflict with NPV. In
those situations, the NPV method should be used.
10-23 a. Payback A (cash flows in thousands):
Annual
Period Cash Flows Cumulative
0 ($25,000) ($25,000)
1 5,000 (20,000)
2 10,000 (10,000)
3 15,000 5,000
4 20,000 25,000
Payback
A
= 2 + $10,000/$15,000 = 2.67 years.
Payback B (cash flows in thousands):
Annual
Period Cash Flows Cumulative
0 ($25,000) ($25,000)
1 20,000 (5,000)
2 10,000 5,000
3 8,000 13,000
4 6,000 19,000
Payback
B
= 1 + $5,000/$10,000 = 1.50 years.
b. Discounted payback A (cash flows in thousands):
Annual Discounted @10%
Period Cash Flows Cash Flows Cumulative
0 ($25,000) ($25,000.00) ($25,000.00)
1 5,000 4,545.45 (20,454.55)
2 10,000 8,264.46 (12,190.09)
3 15,000 11,269.72 (920.37)
4 20,000 13,660.27 12,739.90
Discounted Payback
A
= 3 + $920.37/$13,660.27 = 3.07 years.
Discounted payback B (cash flows in thousands):
Annual Discounted @10%
Period Cash Flows Cash Flows Cumulative
0 ($25,000) ($25,000.00) ($25,000.00)
1 20,000 18,181.82 (6,818.18)
2 10,000 8,264.46 1,446.28
3 8,000 6,010.52 7,456.80
4 6,000 4,098.08 11,554.88
Answers and Solutions: 10 - 20
Discounted Payback
B
= 1 + $6,818.18/$8,264.46 = 1.825 years.
c. NPV
A
= $12,739,908; IRR
A
= 27.27%.
NPV
B
= $11,554,880; IRR
B
= 36.15%.
Both projects have positive NPVs, so both projects should be
undertaken.
d. At a discount rate of 5 percent, NPV
A
= $18,243,813.
At a discount rate of 5 percent, NPV
B
= $14,964,829.
At a discount rate of 5 percent, Project A has the higher NPV;
consequently, it should be accepted.
e. At a discount rate of 15 percent, NPV
A
= $8,207,071.
At a discount rate of 15 percent, NPV
B
= $8,643,390.
At a discount rate of 15 percent, Project B has the higher NPV;
consequently, it should be accepted.
f. Project ∆ =
Year
CF
A
- CF
B
0 $ 0
1 (15)
2 0
3 7
4 14
IRR
∆
= Crossover rate = 13.5254% ≈ 13.53%.
g. Use 3 steps to calculate MIRR
A
@ k = 10%:
Step 1: Calculate the NPV of the uneven cash flow stream, so its FV
can then be calculated. With a financial calculator, enter
the cash flow stream into the cash flow registers, then
enter I = 10, and solve for NPV = $37,739,908.
Step 2: Calculate the FV of the cash flow stream as follows:
Enter N = 4, I = 10, PV = -37739908, and PMT = 0 to solve
for FV = $55,255,000.
Step 3: Calculate MIRR
A
as follows:
Enter N = 4, PV = -25000000, PMT = 0, and FV = 55255000 to
solve for I = 21.93%.
Use 3 steps to calculate MIRR
B
@ k = 10%:
Step 1: Calculate the NPV of the uneven cash flow stream, so its FV
can then be calculated. With a financial calculator, enter
the cash flow stream into the cash flow registers, then
enter I = 10, and solve for NPV = $36,554,880.
Answers and Solutions: 10 - 21
Step 2: Calculate the FV of the cash flow stream as follows:
Enter N = 4, I = 10, PV = -36554880, and PMT = 0 to solve
for FV = $53,520,000.
Step 3: Calculate MIRR
B
as follows:
Enter N = 4, PV = -25000000, PMT = 0, and FV = 53520000 to
solve for I = 20.96%.
According to the MIRR approach, if the 2 projects were mutually
exclusive, Project A would be chosen because it has the higher MIRR.
This is consistent with the NPV approach. Note: Because these two
projects are equal in size, we don’t need to worry about a conflict
between the MIRR and NPV decisions.
Answers and Solutions: 10 - 22
10-24 The detailed solution for the spreadsheet problem is available both on the
instructor’s resource CD-ROM and on the instructor’s side of South-Western’s
web site, .
Spreadsheet Problem: 10 - 23
SPREADSHEET PROBLEM
Allied Components Company
Basics of Capital Budgeting
10-25 ASSUME THAT YOU RECENTLY WENT TO WORK FOR ALLIED COMPONENTS COMPANY,
A SUPPLIER OF AUTO REPAIR PARTS USED IN THE AFTER-MARKET WITH
PRODUCTS FROM DAIMLER CHRYSLER, FORD, AND OTHER AUTO MAKERS. YOUR
BOSS, THE CHIEF FINANCIAL OFFICER (CFO), HAS JUST HANDED YOU THE
ESTIMATED CASH FLOWS FOR TWO PROPOSED PROJECTS. PROJECT L INVOLVES
ADDING A NEW ITEM TO THE FIRM’S IGNITION SYSTEM LINE; IT WOULD TAKE
SOME TIME TO BUILD UP THE MARKET FOR THIS PRODUCT, SO THE CASH
INFLOWS WOULD INCREASE OVER TIME. PROJECT S INVOLVES AN ADD-ON TO AN
EXISTING LINE, AND ITS CASH FLOWS WOULD DECREASE OVER TIME. BOTH
PROJECTS HAVE 3-YEAR LIVES, BECAUSE ALLIED IS PLANNING TO INTRODUCE
ENTIRELY NEW MODELS AFTER
3 YEARS.
HERE ARE THE PROJECTS’ NET CASH FLOWS (IN THOUSANDS OF DOLLARS):
EXPECTED NET CASH FLOWS
YEAR PROJECT L PROJECT S
0 ($100) ($100)
1 10 70
2 60 50
3 80 20
DEPRECIATION, SALVAGE VALUES, NET OPERATING WORKING CAPITAL REQUIRE-
MENTS, AND TAX EFFECTS ARE ALL INCLUDED IN THESE CASH FLOWS.
THE CFO ALSO MADE SUBJECTIVE RISK ASSESSMENTS OF EACH PROJECT, AND
HE CONCLUDED THAT BOTH PROJECTS HAVE RISK CHARACTERISTICS THAT ARE
SIMILAR TO THE FIRM’S AVERAGE PROJECT. ALLIED’S WEIGHTED AVERAGE
COST OF CAPITAL IS 10 PERCENT. YOU MUST NOW DETERMINE WHETHER ONE OR
BOTH OF THE PROJECTS SHOULD BE ACCEPTED.
A. WHAT IS CAPITAL BUDGETING? ARE THERE ANY SIMILARITIES BETWEEN A
FIRM’S CAPITAL BUDGETING DECISIONS AND AN INDIVIDUAL’S INVESTMENT
DECISIONS?
Integrated Case: 10 - 24
INTEGRATED CASE
ANSWER: [SHOW S10-1 THROUGH S10-3 HERE.] CAPITAL BUDGETING IS THE PROCESS OF
ANALYZING ADDITIONS TO FIXED ASSETS. CAPITAL BUDGETING IS IMPORTANT
BECAUSE, MORE THAN ANYTHING ELSE, FIXED ASSET INVESTMENT DECISIONS
CHART A COMPANY’S COURSE FOR THE FUTURE. CONCEPTUALLY, THE CAPITAL
BUDGETING PROCESS IS IDENTICAL TO THE DECISION PROCESS USED BY
INDIVIDUALS MAKING INVESTMENT DECISIONS. THESE STEPS ARE INVOLVED:
1. ESTIMATE THE CASH FLOWS INTEREST AND MATURITY VALUE OR DIVIDENDS
IN THE CASE OF BONDS AND STOCKS, OPERATING CASH FLOWS IN THE CASE
OF CAPITAL PROJECTS.
2. ASSESS THE RISKINESS OF THE CASH FLOWS.
3. DETERMINE THE APPROPRIATE DISCOUNT RATE, BASED ON THE RISKINESS OF
THE CASH FLOWS AND THE GENERAL LEVEL OF INTEREST RATES. THIS IS
CALLED THE PROJECT COST OF CAPITAL IN CAPITAL BUDGETING.
4. FIND (A) THE PV OF THE EXPECTED CASH FLOWS AND/OR (B) THE ASSET’S
RATE OF RETURN.
5. IF THE PV OF THE INFLOWS IS GREATER THAN THE PV OF THE OUTFLOWS
(THE NPV IS POSITIVE), OR IF THE CALCULATED RATE OF RETURN (THE
IRR) IS HIGHER THAN THE PROJECT COST OF CAPITAL, ACCEPT THE
PROJECT.
B. WHAT IS THE DIFFERENCE BETWEEN INDEPENDENT AND MUTUALLY EXCLUSIVE
PROJECTS? BETWEEN PROJECTS WITH NORMAL AND NONNORMAL CASH FLOWS?
ANSWER: [SHOW S10-4 AND S10-5 HERE.] PROJECTS ARE INDEPENDENT IF THE CASH
FLOWS OF ONE ARE NOT AFFECTED BY THE ACCEPTANCE OF THE OTHER. CON-
VERSELY, TWO PROJECTS ARE MUTUALLY EXCLUSIVE IF ACCEPTANCE OF ONE
IMPACTS ADVERSELY THE CASH FLOWS OF THE OTHER; THAT IS, AT MOST ONE
OF TWO OR MORE SUCH PROJECTS MAY BE ACCEPTED. PUT ANOTHER WAY, WHEN
PROJECTS ARE MUTUALLY EXCLUSIVE IT MEANS THAT THEY DO THE SAME JOB.
FOR EXAMPLE, A FORKLIFT TRUCK VERSUS A CONVEYOR SYSTEM TO MOVE
MATERIALS, OR A BRIDGE VERSUS A FERRY BOAT.
PROJECTS WITH NORMAL CASH FLOWS HAVE OUTFLOWS, OR COSTS, IN THE
FIRST YEAR (OR YEARS) FOLLOWED BY A SERIES OF INFLOWS. PROJECTS WITH
Integrated Case: 10 - 25