FINANCIAL ANALYSIS: TOOLS AND TECHNIQUES CHAPTER 12 docx
Bạn đang xem bản rút gọn của tài liệu. Xem và tải ngay bản đầy đủ của tài liệu tại đây (234.93 KB, 34 trang )
CHAPTER 12
MANAGING FOR
SHAREHOLDER VALUE
We now return to the primary concept we established at the beginning of this
book, namely, that the basic obligation of the management of any company is to
make investment, operating, and financing decisions that will enhance share-
holder value over the long term. Our discussion of valuing business cash flows in
Chapter 11 strongly suggested that management should periodically reexamine
the company’s policies and strategies to test whether its basic obligation of creat-
ing shareholder value is in fact being met. We recall that increasing shareholder
value depends on making new investments that exceed the cost of capital—an ex-
pression of investor expectations—as well as managing all existing investments
for cash flow results that similarly exceed investor expectations.
The most beneficial aspect of the growing emphasis on shareholder value
creation over the past decade has been the widespread rediscovery of management
fundamentals—even if at times under threat of dismissal by hostile raiders. De-
spite the periodic lapses of economic discipline exemplified in the recent dot.com
bubble, which we discussed in Chapter 1, there has been real progress made with
the prospect of more to come. Growing numbers of corporate managers, in the
U.S. and in other parts of the world, are tackling the critical task of creating value
for their shareholders. They are doing this by reexamining the structure and func-
tioning of their company as a whole and by placing greater emphasis on making
their decisions, large and small, on the basis of sound economic trade-offs. The
basic imperative of requiring all investments to earn above the cost of capital has
been rediscovered as a practical—even if difficult to achieve—goal. Vast efforts
at restructuring, increasing cost-effectiveness, making disinvestments and acqui-
sitions, and developing value-based processes, data flows, measures, and incen-
tives are being carried out in the name of shareholder value creation. In fact,
testing the efficiency with which all resources are employed and defining the
relative contribution from various business segments with an objective “outside”
orientation has become commonplace in many companies. One could argue that
391
hel78340_ch12.qxd 9/27/01 11:32 AM Page 391
Copyright 2001 The McGraw-Hill Companies, Inc. Click Here for Terms of Use.
392 Financial Analysis: Tools and Techniques
this approach should really have been commonplace all along, because of the
long-established fact that all business decisions have an economic basis—whether
this is recognized or not. A number of specialized measures and valuation method-
ologies have emerged in support of value-based management principles, which
we’ll discuss later in this chapter.
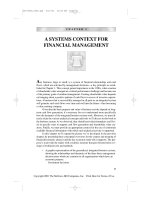
Shareholder Value Creation in Perspective
Before we turn to a detailed discussion of value-based measurement techniques,
it’ll be useful to revisit the business system as shown in Figure 12–1 to provide
an overall perspective for the various analytical processes presented in this book,
and to review their relationship to shareholder value creation. Two additional
FIGURE 12–1
Shareholder Value Creation in a Business System Context
Dis-
investment
Depreciation
effect
Interest
(tax-adjusted)
Dividends
paid
New
investment
Leverage
VolumePrice
Costs
(fixed &
variable)
Investment
base
Shareholders'
equity
Long-term
debt
Operating
profit
after taxes
Earnings
retained
in company
Funds
available
for growth
Managing all new
business investments
as well as all existing
investments for a
targeted economic
return above the cost
of capital
Managing all
operations for
competitive
advantage and
cost-effectiveness
Managing the
trade-off between
dividends, debt
service, and
reinvestment
Managing the capital
structure for proper
leverage, acceptable
risk, and future
flexibility
Funding of
company growth,
given attractive
opportunities suitable
for the portfolio
Exceed cost of
capital
Meet return goals
Meet key success
measures
Cost/benefit
analysis
Risk/reward
analysis
Opportunity
analysis
hel78340_ch12.qxd 9/27/01 11:32 AM Page 392
CHAPTER 12 Managing for Shareholder Value 393
overview perspectives in Figures 12–2 and 12–3 also will help set the stage for
this chapter.
As the upper part of the diagram shows, companies focusing on share-
holder value will tailor their analytical processes and physical implementation
to achieve economic (cash flow) returns above the cost of capital on new in-
vestments as well as on existing investments, making sure that return goals are
set at appropriate levels and in the proper economic context. We recall the dis-
cussion of Chapters 7, 8, and 9 in which the principles and the measures sup-
porting this approach were presented. One of the key issues to be faced in this
area, however, is the dichotomy between the economic analysis of new invest-
ments, where expected cash flow patterns can be judged in an incremental fash-
ion, and the analysis of the existing investment base, where normal accounting
data and recorded values are the main source of information. It is here where
much of the development of value-based methodologies has taken place, in an
effort to close the conceptual gap between cash flow economics and ratio-based
conventional analysis.
The midsection of the diagram reflects our familiar set of operational trade-
offs, which in a value creation context, should be made with long-term cash flow
generation in mind. Excellent product and service offerings, competitive advan-
tage, and cost-effectiveness are the underlying driving forces, but the many deci-
sions supporting daily activities require not only an analytical understanding of
their cash flow impact, but also measures and incentives that reinforce economic
decision making. Again, the increasing emphasis on value-based management is
fueling a shift away from accounting-based methodology toward cash flow frame-
works. We encountered some of this trend in our discussion of the analytical
approaches of earlier chapters, and we’ll expand on the measures and their impli-
cations later in this chapter.
The bottom part of the diagram deals with the financing aspects of value
creation, where we recognize the many trade-offs we’ve encountered in Chap-
ters 6, 9, and 10. Companies with a value orientation consciously manage these
trade-offs for long-term cash flow generation, and view the disposition of profits
and the target dimensions of the capital structure as critical supportive elements in
their strategic planning. Choices that affect dividend payout, changes in leverage,
repurchase of shares, and funding of future opportunities are made against the
criterion of value creation. The trade-offs chosen here can at times significantly
affect the direction of the company’s strategy.
Another overview of the integration of financial, strategic, and operational
activities supporting shareholder value creation is provided in Figure 12–2. Here
we see the core concept of earning in excess of the cost of capital surrounded by
the key management activities, starting at the top with the evaluation and selection
of sound strategies, leading to broad resource allocation and the analysis of spe-
cific business investments. In this area the analytical tools of Chapters 7 and 8
come into play. This is followed by the identification of those elements and vari-
ables that drive value creation, which form the basis for operational targets and the
hel78340_ch12.qxd 9/27/01 11:32 AM Page 393
394 Financial Analysis: Tools and Techniques
measures by which performance is gauged. Here the materials of Chapters 3, 4,
and 5 have relevance. Next is the critical area of designing incentives for man-
agers to act in an economic fashion, and to support a long-term view of decision
making. We’ve not focused on such incentive programs because they are beyond
the scope of this book. However, financial and other measures selected for the
purpose must reinforce the economic (cash flow) orientation we have stressed
throughout.
Finally, there’s the broad strategic issue of the portfolio of activities carried
on by the company, which is intimately connected with the capital structure
proportions and trade-offs. Here the materials in Chapters 6, 9, 10, and 11 are the
appropriate background.
Let’s now turn to a final summary overview of the major elements of share-
holder value creation and their relationship to the three areas of management
decisions: investments, operations, and financing. The diagram in Figure 12–3
will be useful in tying together the various concepts we’ve discussed. It’s de-
signed to assist the reader in visualizing the linkage between management deci-
sions and shareholder value. The diagram shows the three basic types of decisions
on the left and identifies their key impacts on the cash flows that are the drivers
for creating value. The combination of investment and operating decisions gener-
ates cash flow from operations after taxes, or free cash flow, while the financing
decisions influence the capital structure and the level of the weighted cost of cap-
ital of the company. Applying the cost of capital—which of course reflects ex-
pected investor returns—as a discount rate to the free cash flow and ongoing
value determines the total shareholder value, as discussed in Chapter 11. At the
same time, product life cycles, competition, and many other influences affect the
FIGURE 12–2
Shareholder Value Creation in a Management Context
1. Achieve cash
returns above the
cost of capital
2. Make sound new
investments
Seek and evaluate
sound strategies
Allocate resources
to strategies selected
Define and set
operating targets
and implementations
Evaluate results
consistently with
appropriate measures
Identify and evaluate
specific new investments
within strategic context
Identify and test
key value drivers
Manage
capital structure
proportions
Achieve economic behavior
with relevant incentives
Manage business
portfolio balance
and size
Balance short-
versus long-term
viewpoints
hel78340_ch12.qxd 9/27/01 11:33 AM Page 394
CHAPTER 12 Managing for Shareholder Value 395
size and variability of these projected cash flows. In turn, the capital markets in-
fluence the investor’s return expectation.
Alternatively, the right side of the diagram shows that shareholder value
also can be viewed in the form of total shareholder return (TSR), which we know
to be the combination of cash dividends and realized capital gains, when seen
through the eyes of the shareholder. This investor viewpoint is inseparable from
the basic driving force of the business—cash flow patterns—for it is positive free
cash flow that will permit the company to pay dividends in the first place, and also
will boost the market value of the shares, enabling the investor to realize capital
gains. Naturally, it’s possible to create value by minimizing dividends and rein-
vesting all funds in soundly based opportunities. The value increase would then
come from capital appreciation, assuming successful implementation and ex-
pected growth in cash flow performance. Conversely, under conditions where
sound new opportunities are not available, it might be best for the shareholders
that the company repurchase shares rather than invest in mediocre business pro-
jects to avoid destroying value.
What are the implications of the three overviews we’ve just presented? Note
that we’ve once more returned to a systems view of the corporation, driven by the
same three basic management decisions, but stressing even more the cash flow pat-
terns that are the economic underpinning of performance and value. All financial
analysis techniques and methodologies discussed in this book are ultimately related
to the business system and its strategic context as viewed here and in Chapter 2,
FIGURE 12–3
Shareholder Value Creation in a Cash Flow Context
Operating
decisions
The manager
Dividends
Capital
gains
Share-
holder
value
Free cash
flow from
activities;
ongoing
value
Financing
decisions
Investment
decisions
Expectations
Capital
markets
Competition;
life cycles;
economic
environment
Price/volume/
cost trade-
offs;
cost effective-
ness
Debt;
equity;
leverage;
payout
repurchase
Working
capital;
facilities;
programs
Discount
rate
Cost of
capital
The investor
hel78340_ch12.qxd 9/27/01 11:33 AM Page 395
396 Financial Analysis: Tools and Techniques
and it’s important that the analytical use of any measure, or a combination of mea-
sures, be judged in this sense.
The basic message of managing for shareholder value is nothing more than
management’s obligation to base all of its investment, operating, and financing
decisions on an economic—cash flow—rationale, and to manage all resources en-
trusted to its care for superior economic returns. Over time, consistency in this ap-
proach will generate growing shareholder value, and relative growth in share price
performance. If this sounds fundamental, it’s intended to be, since the challenge
for the 21st century is competitive survival through managing better in a world
arena—where economic fundamentals are gaining dominance over ideology.
Financial analysis in its many forms, as introduced in Chapter 2 and specifically
explained in the remainder of this book, is an essential toolkit for analytically ori-
ented persons of any viewpoint, as they judge the financial/economic performance
and outlook of any business.
Evolution of Value-Based Methodologies
Over the last two decades, a number of value-based methodologies have evolved
and are gaining increasing acceptance. Their basic aim is to link performance ex-
pressed in past and expected cash flow patterns or their surrogates to the market
value of a company as a whole and to the relative price level of its common
shares. They have become popular within the context of value-based management
processes, and various consulting firms use these approaches to establish a firm
connection between management actions and shareholder value results. More-
over, such programs relate cash flow thinking and results to management in-
centive pay. They are designed to provide a coherent set of economic principles
that should guide a company’s planning processes, investment policies, financing
choices, operational decisions, and management incentives toward increasing
shareholder value, as displayed earlier in our overviews.
The change in thinking underlying these processes is exemplified in the
simple diagram of Figure 12–4, which displays the significant shift in emphasis as
reflected in the way corporate performance is being measured.
Prior to the 1980s, management emphasis in the majority of situations
tended to be on achieving consistently high profit margins. The asset base neces-
sary to support operations was of secondary importance, almost an afterthought,
as indicated by the separation border. The idea was that if margins were high
enough, asset recovery and returns would take care of themselves, as would fund-
ing of new investment needs for rapid growth. Needless to say, companies apply-
ing this way of thinking did not make the best use of invested funds, and asset
effectiveness was problematic. In the ’80s the emphasis shifted toward growth of
profits in absolute terms, again with a focus on the operating statement and less at-
tention paid to asset effectiveness. With some luck, sufficient profit growth would
support existing and new investments, but this mindset still left asset effectiveness
open to real questions.
hel78340_ch12.qxd 9/27/01 11:33 AM Page 396
TEAMFLY
Team-Fly
®
CHAPTER 12 Managing for Shareholder Value 397
It wasn’t until the ’90s that formal closure began between the asset base and
operating profits, usually in the form of a percent return of profits on assets, ex-
pressed in a variety of ways. While recorded values and accounting-based profit
could introduce distortions, and while using short-term returns as a goal could
lead to less than optimal new investment actions, combining assets and profitabil-
ity was a significant step toward a more integrated way of judging results and
making new decisions. As more economic and integrated measures began to
be used in practice, growing efforts were made to deal with the shortcomings of
accounting-based thinking, and to provide more meaningful signals to managers
at all levels. Shareholder value creation was introduced and was based on a vari-
ety of adjusted data representing the asset base and operating results.
One key element was the rediscovery of the cost of capital (which first ap-
peared in economic literature around 1890!) as a key criterion for judging per-
formance. The concept of economic profit was defined as the excess of adjusted
earnings over the cost of the adjusted resources supporting them. Another key ele-
ment was the rediscovery of cash flow as the driver of value, whether in the form
of free cash flow for judging a whole company, or net cash flows for investment
proposals. Various cash flow measures gained importance, among them cash flow
return on investment (CFROI) in a variety of forms. The common theme during
this evolution was the belated recognition that any business entity is in fact an
economic system which has to be judged over a reasonable time horizon with
FIGURE 12–4
The Changing Emphasis in Corporate Performance Measures
"History" The 80s The 90s Emerging Practice
"Profit Margin"
¥ High growth
environment
¥ Any growth
environment
¥ Any growth environment
¥ Valuation and strategy tools
*EVA is a registered trademark of Stern Stewart & Co.
¥ Lower and
inconsistent
growth conditions;
acquisitions
%
$$
"Operating Profit $$"
"Profit Growth"
"Return
on Assets"
"Shareholder Value
Creation over Time"
Asset
base
Asset
base
Asset
base
Changes
Cost of
capital
Adjust-
ments
Profit Profit
%
$$ EVA*
$$
Free
cash
flow
Profit
Profit
Sales
Costs
Current
asset
values
Cash
flow
%
CFROI
hel78340_ch12.qxd 9/27/01 11:33 AM Page 397
398 Financial Analysis: Tools and Techniques
performance and value criteria that reflect and encourage the cash flow trade-offs
underlying management decisions, incentives, execution, and results.
A Review of Key Measures
At this point we should review in broad terms the key performance and value
measures encountered in current business practice, and to comment in more detail
on several of the emerging tools that support shareholder value creation. We’ve
grouped the measures into earnings, cash flow, and value categories, and will take
up each area in sequence.
Earnings Measures
The five measures in this area are the traditional ways of stating earnings or relat-
ing earnings to different expressions of invested capital, which we discussed in
Chapter 4. They are being supplanted increasingly by cash flow and value-based
measures, especially for internal planning, analysis, and evaluation purposes. We
list them here more for completeness than for their current relevance.
• Earnings per share (EPS) is accounting net income after taxes divided
by the number of shares outstanding.
• Return on investment (ROI) is accounting profit divided by the book
value of the investment supporting the operations, both defined in a
variety of ways.
• Return on net assets (RONA), or return on capitalization, is after-tax
accounting operating profit (NOPAT) divided by the book value of
total assets less current liabilities.
• Return on capital employed (ROCE) is accounting operating profit
(NOPAT) over the book value of assets supporting the operations.
• Return on equity (ROE) is accounting net income after taxes divided
by the book value of shareholders’ equity.
EPS, one of the most commonly quoted indices of performance, which
we discussed in several places in this book, has declined from its former pre-
eminence. While still tracked by security analysts as an indicator of near-term per-
formance, and used in simple valuation situations via the earnings multiple, EPS
expresses only the income side of the accounting spectrum. Moreover, it is subject
to the many rules of accounting that have moved performance data further and
further away from cash flow. In addition, the number of shares outstanding will
fluctuate even more in these days of share buybacks, and will affect the level and
trend of this measure.
ROI is the simplest way of expressing the profitability of asset use, and in
its unadjusted form remains a basic accounting measure, not an expression of eco-
nomic performance. The accounting earnings reflect many noncash charges and
hel78340_ch12.qxd 9/27/01 11:33 AM Page 398
CHAPTER 12 Managing for Shareholder Value 399
additions, while the book value of the investment is a recorded value, not a cur-
rent economic value. It might be useful as an approximation, but can often be un-
reliable because of the nature of accounting data, as we mentioned in Chapter 4.
RONA has become fairly popular, using a more focused operating profit
related to the net assets, or capitalization, as recorded on the balance sheet. It still
suffers from some of the same accounting issues as ROI, especially in the valua-
tion of the asset base.
ROCE is a further modification, focusing on operating profit and operating
assets, but with similar accounting issues remaining. Mostly applied to internal
goal setting, it helps to make asset utilization a performance issue, at least near-
term. It does not, however, relate well to economic measures used in judging new
investments, nor does it assist in making day-to-day decisions on an economic
basis.
ROE is the relationship of accounting net profit to the recorded residual
ownership claim of the common shareholders, a recorded value buffeted by a
whole host of set-asides, reserves, and reclassifications. Still widely quoted and at
times used in goal setting, the measure by its very nature cannot reflect the eco-
nomic performance of a company. Apart from the usual accounting issues it’s also
affected by the financial leverage employed by a company. Beside the measure’s
shortcomings for internal use, the leverage distortion makes peer comparisons
more difficult, when capital structures vary.
Cash Flow Measures
The more recent approaches to performance and value measurement are in-
variably based on cash flow analysis, with much emphasis placed on removing
accounting allocations and noncash adjustments to arrive at cash provided by op-
erations and cash invested to support the operations. They relate closely to com-
monly used economic criteria like net present value and internal rate of return,
thus linking the economic approach to new investments with the assessment of
ongoing operations. We’ve discussed many of these already in earlier chapters,
and will take up the most current ones later in this section.
• Free cash flow is operating cash flow (net income after taxes plus
depreciation and amortization, but often adjusted to remove interest
expense), less new business investments (including changes in working
capital) plus dispositions of assets.
• Cash flow return on gross investment (ROGI) is operating cash flow
(net income after taxes plus depreciation and amortization) divided
by gross assets (before accumulated depreciation).
• Cash flow return on investment (CFROI) is the internal rate of return
over the life of the investment, based on operating cash inflows, cash
investment outflows, and cash recoveries. It involves a variety of
adjustments to arrive at operating cash flows and the cash value
of the asset base involved, as we’ll demonstrate.
hel78340_ch12.qxd 9/27/01 11:33 AM Page 399
400 Financial Analysis: Tools and Techniques
• Total shareholder return (TSR) is the yield to the investor from shares
held over one or several periods, calculated from the combination of
dividends and change in share value.
• Total business return (TBR) is the internal rate of return from a
business unit or unlisted company over one or several periods, from
the combination of cash flows and change in capital value. It involves
a variety of adjustments to develop beginning and ending values of the
business.
Free cash flow has become a commonly accepted concept, useful as an eco-
nomic criterion for periodic results, but, even more importantly, representing a
key element in the valuation of companies and their parts, as well as in strategic
planning analyses.
ROGI at times serves as a simple substitute for a periodic economic return,
relating operating cash flows to recorded operating assets—which have been
“grossed up” by adding back accumulated depreciation to provide a surrogate for
current values of the asset base. It can be a useful approximation to a more rigor-
ous cash flow analysis in many situations, but could introduce some distortions
because in effect it relies on the original cost of assets of different ages as a broad
surrogate for current value.
CFROI, in its most sophisticated form, is an economic return developed for
the company or its parts, representing an internal rate of return over the average
life of the operating assets involved. It’s directly comparable to the cost of capital,
and to the results from cash-flow-based new investment analyses. The methodol-
ogy requires a series of adjustments and several conceptual constructs, as we’ll
discuss later.
TSR has become a popular concept, used and published widely, because it
expresses the annual return achieved by an investor from holding a company’s
shares over a specified period of time, based on dividends and change in market
value. It links to a company’s cost of capital calculation as an expression of
the shareholder expectations to be considered in establishing the cost of equity
capital.
TBR is a parallel measure to CFROI, designed to measure the internal rate
of return of business units or other entities, based on free cash flow and estimates
of the beginning and ending values of the entity, much like the analysis of an in-
vestment project as presented in Chapter 8.
Value Measures
The seven value measures listed here similarly reflect the evolution from simple
multiples to present value cash flow concepts. Again we’ve discussed several of
the basic measures in earlier chapters, but later we’ll go into more detail about the
most important ones for current value-based management practice.
• Earnings multiples are based on total income after taxes or EPS
multiplied by a judgmental factor. They are related to the price/earnings
ratio, which is often employed as a guide for the factor used.
hel78340_ch12.qxd 9/27/01 11:33 AM Page 400
CHAPTER 12 Managing for Shareholder Value 401
• Cash flow multiples are a modification of earnings multiples, using
total income after taxes plus depreciation and amortization, or the
same on a per share basis, multiplied by a judgmental factor.
• Economic profit, or economic value added (EVA),* is the difference
between operating profit after taxes (NOPAT) and a capital charge,
which is based on the cost of capital times the net operating assets
employed. It’s also expressed as the change in economic profit from
period to period. The measure requires a variety of adjustments to
operating profit and the asset base, as we’ll see.
• Market value added (MVA) is the difference between the book value of
the total invested capital and the market value of the various forms of
capital. It requires a variety of adjustments to the recorded values and
a careful judgment about how representative current share values are.
• Cash value added (CVA) is the difference between the required annual
cash flow to amortize an investment (using the cost of capital as the
discount factor), and the actual cash flows generated, expressed as
a present value differential.
• Shareholder value (SHV), as we know, is the present value of the
estimated future free cash flows over the planning period, discounted
at the company’s cost of capital, plus the present value of the ongoing
value of the business, plus any nonoperating assets (such as marketable
securities and other investments), less the amount of long-term debt
outstanding. It represents the present value of shareholders’ equity
under the assumed conditions.
• Shareholder value added (SVA) is the change in total shareholder value,
either from period to period or over a longer planning time span, using
the process of calculating shareholder value (SHV) as described above
for each data point.
Earnings multiples are still a popular way of establishing a “ball park” fig-
ure for the value of a business, even though accounting earnings are subject to
many potential distortions from an economic standpoint.
Cash flow multiples represent an effort to reflect operating cash flows, even
though in their simplest form only depreciation and amortization is added back.
Again, they are useful mainly as a first estimate before applying more sophisti-
cated techniques.
EVA, the concept popularized by Stern Stewart & Co., is a form of eco-
nomic profit derived from the excess (or deficit) of operating earnings after sub-
tracting the cost of capital of the assets employed. With a variety of adjustments
to both operating profit and the asset base, this approach can be used to track
changes in value creation from period to period, and to establish a valuation of
the company. Economic profit is not a new principle, because in its basic form it
*EVA is a registered trademark of Stern Stewart & Co.
hel78340_ch12.qxd 9/27/01 11:33 AM Page 401
402 Financial Analysis: Tools and Techniques
simply states that a company or a business unit is adding value when after-tax
earnings before interest are higher than the weighted cost of capital of the re-
sources employed in the creation of these earnings.
MVA is an expression of the value created by a business in excess of the
amount of the invested capital as shown on the balance sheet, on a periodic basis
as well as over a longer time span. Given that the base is recorded capital, a vari-
ety of adjustments are required to make the measure meaningful.
CVA establishes the economic value created, in cash flow terms, over and
above the cash flows required to recover the capital employed in a business, using
the cost of capital as a standard. It closely parallels the net present value criterion
and it is consistent with internal investment analyses.
SHV is, of course, the familiar concept of letting expected cash flows rep-
resent the present value of shareholders’ equity as a measure of value creation of
the total company. Discussed in Chapter 11, this model of value representation
underlies much of the value-based management activity extant in modern corpo-
rate America.
SVA has become a useful addition to the concept of total shareholder value,
because of the importance of establishing trends in value creation when assessing
corporate strategic plans and their impact over a period of time. It’s also used in
assessing the value creation potential from combinations and acquisitions, as
we’ll see later.
Economic Profit and CFROI
We’ll now discuss, in a little more detail, two of the most popular measures cur-
rently in use in value-based management processes. As we’ve stated before, eco-
nomic profit (EVA) represents a yardstick for measuring whether a business is
earning above the cost of capital of the resources (capital base) it employs. The
calculation is a straightforward subtraction of the cost of capital from net operat-
ing profit:
EVA ϭ NOPAT Ϫ Ck
where
NOPAT ϭ Operating profit after taxes (adjusted)
C ϭ Capital base employed (net of depreciation)
k ϭ Weighted average cost of capital
Note that the formula as stated relies on reported earnings and the recorded
capital base supporting these earnings, not on cash flows. In effect, EVA is deter-
mined by subtracting from operating earnings a capital charge for the book value
of the money invested in the company by owners and creditors. For a business
unit, the capital charge is usually based on the net assets employed. At first glance,
EVA therefore appears to be more of an accounting-based than an economic
hel78340_ch12.qxd 9/27/01 11:33 AM Page 402
CHAPTER 12 Managing for Shareholder Value 403
measure. In practice, however, Stern Stewart & Co. makes a large series of ad-
justments when working with client companies. These adjustments are made to
calibrate the measure more closely to an economic cash flow basis, in an effort to
parallel the economic valuation concepts we discussed earlier (see the references
at the end of the chapter). Moreover, the EVA approach is applied not only to mea-
suring current performance but also to measuring new investments and to devel-
oping incentive compensation.
What are some of the key adjustments used in applying the EVA concept?
Starting with the accounting statements of a company, the first step is to derive an
adjusted NOPAT, while the second is the development of the relevant capital base.
The major adjustments in the NOPAT and capital base calculations occur in the
following areas:
• Operating lease expenses.
• Major research and development expenses.
• Major advertising and promotion expenses.
• Inventory value adjustment (LIFO).
• Deferred income taxes.
• Goodwill amortization.
• Separation of nonoperating assets.
In the case of operating leases, an adjustment becomes necessary because
there’s a preference for showing the unrecorded value of the leased assets as part
of the capital base, and removing the imputed interest expense on these leased
assets from the income statement. The lease payments are capitalized on the bal-
ance sheet, with an offsetting matching liability, and the capital value is amortized
over the appropriate time period. This amortization expense is then subtracted
from earnings in arriving at NOPAT.
The effects of research and development as well as advertising and pro-
motion expenditures incurred in a given period often extend into future periods,
although current accounting rules require the total expense to be charged to the
period in which it was incurred. The adjustment to NOPAT involves removing
these expenses from the income statement, capitalizing them as part of the capital
base, and amortizing them over an appropriate time period. This periodic amorti-
zation, a smaller amount, is then subtracted from earnings in arriving at NOPAT.
Inventory values under LIFO can, over time, become understated because
the recorded cost of the earlier items in inventory remains unchanged, while
recent additions are charged into cost of goods sold. To adjust for this disparity,
inventories on the balance sheet are restated to current higher values, with an
offsetting increase to earnings. This adjustment also is referred to as adding back
the change in the LIFO reserve.
Deferred income taxes, as we discussed in earlier chapters, arise from tim-
ing differences between taxes due on corporate tax returns and those reflected on
hel78340_ch12.qxd 9/27/01 11:33 AM Page 403
404 Financial Analysis: Tools and Techniques
the books. In an effort to represent the cash taxes actually paid during a period, the
change in deferred taxes is added or subtracted in the revised NOPAT calculation.
Finally, where sizable goodwill amounts are carried on the balance sheet,
the periodic amortization reflected on the income statement is reversed so that
earnings are higher. Goodwill remains unchanged on the balance sheet, on the as-
sumption that this asset is a permanent part of the capital base.
In most cases, the net effect of these adjustments will result in a somewhat
higher NOPAT and an expanded capital base, but not necessarily in proportion to
their impact on the EVA calculation.
How is the result of the EVA calculation to be interpreted? There are two
ways of looking at the outcome. The first is an absolute determination of whether
periodic earnings have exceeded or fallen short of earning the cost of capital.
The second interpretation tracks the change from period to period, to reflect the
amount of value creation. For example, let’s assume that in 1999 a company fell
short of earning the cost of capital by $200 million, but in 2000 achieved a posi-
tive economic profit of $50 million. Under the first interpretation, economic profit
was highly negative in 1999, and positive in 2000. Under the second interpre-
tation, the company’s management created $250 million of economic profit
between 1999 and 2000, by having reversed the negative results of 1999 into pos-
itive territory in 2000. From a value-based management standpoint, both inter-
pretations are used, the first usually for goal setting in operations, planning, and
investment, and the second as an incentive to bring about change. As we’ll see
shortly, such economic profit analyses are best viewed over several periods,
because being modified accounting results they are subject to some of the same
period-to-period distortions as unadjusted accounting measures.
CFROI, the most sophisticated and empirically grounded methodology for
value-based management, was developed over many years of statistical analysis
by the former HOLT Value Associates, now functioning both as a part of The
Boston Consulting Group and separately as Holt Value Associates LP. This cash-
flow–based approach, originally intended as an analytical guide for portfolio man-
agers, is based on translating a company’s financial results through a variety of
adjustments into a current-dollar cash flow return on investment (CFROI) mea-
sure, which expresses the company’s economic performance. This concept, when
applied to expected cash flows and combined with projected growth in the com-
pany’s asset base, can then be used in a proprietary analytical model to calculate
the company’s market value. The HOLT model recognizes the adjusted cash flow
contributions from existing assets and combines them with new investment cash
flows, all on a comparable economic basis. This culminates in the concept of cash
value added (CVA), which amounts to finding the economic value created by suc-
cessful business strategies and investments over and above earning the cost of
capital on a discounted cash flow basis.
In effect, the HOLT model transforms a company’s financial data into a
consistent series of economic “project” cash flows that, when discounted at an
empirically derived investor’s return standard (generalized cost of capital for the
hel78340_ch12.qxd 9/27/01 11:33 AM Page 404
CHAPTER 12 Managing for Shareholder Value 405
market as a whole), permits calculation of the relative market value of the com-
pany’s capitalization. In most cases, the calculated share values not only track
very closely with historical price patterns but also become predictors for an ex-
pected market value based on a company’s strategic plans—if the assumed plan
cash flows are realized in the future, of course. The model is a highly integrated
and sophisticated application of the economic cash flow principles we’ve dis-
cussed throughout this book (see the references at the end of the chapter for addi-
tional reading).
The CFROI performance measure itself can be illustrated by the diagram in
Figure 12–5, where the data are taken from the financial statements of a company
after a variety of adjustments, some similar to the ones we described for the EVA
process. In contrast to EVA, however, the approach is strictly cash flow based, and
the data are adjusted to a current-dollar basis. Note that the diagram is a present
value analysis of the current value of the gross investment in the company, a level
cash flow projection over 12 years, the average asset life assumed, and the value
of nondepreciating assets recovered at the end of 12 years. In this example, the
result is an internal rate of return of 20 percent, which represents the cash flow
return earned by the company in the current year. The reason the cash flow pattern
was extended over the assumed average life of the assets and a recovery was pro-
vided is simply that the CFROI concept is designed to parallel the familiar new
project economics cash flow patterns we discussed in Chapters 7 and 8. There we
emphasized that the economic life and any recoveries must be taken into account
to be able to calculate an internal rate of return. The CFROI result expresses only
the performance for the year under analysis. The CFROI for the next year would
be based on that year’s cash flows, extended over the assumed asset life, using
asset values adjusted as necessary for the current investment as well as for the
assumed capital recovery at the end, and the process is repeated for ensuing years.
FIGURE 12–5
A CFROI Perspective (thousands of dollars)
Current-dollar
gross cash
invested:
$3,600
Value of
nondepreciating
assets: $400
Result: CFROI is 20%
(the internal rate of return of this cash flow pattern)
Average asset life assumed: 12 years
Annual aftertax adjusted cash flow before interest: $800
(Current-year cash flow assumed to continue)
hel78340_ch12.qxd 9/27/01 11:33 AM Page 405
406 Financial Analysis: Tools and Techniques
The adjustments underlying the data in Figure 12–5 are made in three areas.
The first involves transforming accounting net income into a gross cash annual
flow. The following changes were made:
Accounting net income: . . . . . . . . . . . . . . . . . . . . . . . . . . . . . . . . . . . $425
Add back depreciation effect, other noncash charges . . . . . . . . . . 200
Add back tax-adjusted interest expense . . . . . . . . . . . . . . . . . . . . . 75
Add back tax-adjusted operating lease expense (see below) . . . . . 50
Adjust for inventory valuation (LIFO reserve) . . . . . . . . . . . . . . . . . 40
Adjust for inflation . . . . . . . . . . . . . . . . . . . . . . . . . . . . . . . . . . . . . . 10
Current dollar gross cash flow: . . . . . . . . . . . . . . . . . . . . . . . . . $800
When appropriate, adjustments to add back unusual advance expenditures on
research and promotion also are made. Note the inflation adjustment, which cur-
rently is not large in U.S. companies, but can be significant in other economies.
The second area involves transforming recorded assets into a current cash
value investment base. The following changes were made:
Recorded total assets: . . . . . . . . . . . . . . . . . . . . . . . . . . . . . . . . . . . . $3,125
Add back accumulated depreciation to arrive at original cost . . . . . 950
Adjust gross fixed assets for current dollar value . . . . . . . . . . . . . . 575
Capitalize operating leases to show imputed asset value . . . . . . . 350
Subtract non-interest-bearing liabilities . . . . . . . . . . . . . . . . . . . . . (1,100)
Subtract goodwill . . . . . . . . . . . . . . . . . . . . . . . . . . . . . . . . . . . . . . (300)
Current dollar gross cash investment: . . . . . . . . . . . . . . . . . . . . $3,600
Note that the adjustment to transform the original cost of fixed assets into a
current-dollar equivalent is a significant amount, which is based on choosing
appropriate inflation measures. Non-interest–bearing liabilities, such as accounts
payable, accruals, taxes payable, and other noncontractual liabilities, are subtracted
to arrive at a modified net asset figure. Importantly, goodwill is subtracted as ir-
relevant to the economics of this calculation, because the fixed asset adjustment
to current values stands as a surrogate for goodwill arising from the premium paid
for purchased assets.
The third area involves the development of a cost of capital standard in real
(noninflationary) terms, which is based on a real risk-free interest rate, a real stock
market premium, and a real interest cost of debt. The HOLT methodology uses a
market-based cost of capital in those terms, rather than a company-specific cost of
capital as discussed in Chapter 9, on the assumption that individual company risk
() is expressed in the expected cash flow performance.
As we mentioned earlier, the CFROI calculation is one of the measures used
in the HOLT methodology to judge whether a company is performing above the
cost of capital in any given period. Because it’s a strictly cash-based measure,
CFROI is directly comparable to the cost of capital criterion. CFROI reappears in
the HOLT methodology as part of an overall performance profile which links
CFROI performance, past and projected investment growth, and competitive im-
pact into a valuation framework that expresses past and prospective share price
hel78340_ch12.qxd 9/27/01 11:33 AM Page 406
TEAMFLY
Team-Fly
®
CHAPTER 12 Managing for Shareholder Value 407
performance. The competitive impact is recognized in the form of a fade effect
(reducing extraordinary results over time as unsustainable), and is incorporated
into the judgment about the ongoing value of the business. We’ve given only a
brief overview of this highly integrated methodology here; for more information
the reader should turn to the references at the end of the chapter.
How can we compare economic profit and CFROI with some of the other
measures? The table in Figure 12–6 is a highly simplified example of how the var-
ious approaches apply in the case of a company with an initial investment of
$12 million, including $2 million of working capital, level net operating profit
after taxes (NOPAT) of $825,000, and an economic life of eight years. We’ll as-
sume that no additional investments are required, that the working capital will be
recovered in Year 8, and that all excess cash is paid out to the owners. In a real sit-
uation there would be more complex conditions, but for purposes of illustration
this stripped-down example will provide acceptable indications.
First we show an economic profit analysis, in which a cost of capital charge
of 10 percent is applied to the declining book value of the investment base. This
charge is offset against the level annual NOPAT of $825,000. Note that during the
first three years the economic profit is negative, with breakeven achieved in Year
4, and with growing positive amounts in the remaining years. Given that we’ve
assumed a level annual NOPAT, this pattern is not surprising, because the capital
charge is being applied every year to a declining investment base. When we use a
10 percent discount rate to the individual annual economic profit results, the net
present value is 0, suggesting that in this simplified example the company is earn-
ing exactly its cost of capital.
The same result is achieved when we proceed with a basic CFROI analysis
as shown in the middle of the table. First we move from accounting NOPAT to
a periodic operating cash flow by adding back the noncash depreciation effect,
arriving at a level $2.075 million. This parallels the approach we used with new
investment projects, as described in Chapters 7 and 8. Moving on, we find that in
this instance the investment base does not decline, because we are recovering the
initial cash investment from future cash flows via a level capital charge plus a
level capital amortization. The former is simply a 10 percent charge against the
initial investment base. The second, in effect, represents an annuity that will build
up to a future value of $12 million at 10 percent in Year 8, an amount sufficient to
recover the initial investment. Note that the combined capital charge and capital
amortization is exactly equal to the operating cash flow of $2,075 million, indi-
cating that the internal rate of return of this business is exactly 10 percent.
The major difference between the economic profit and the cash flow return
approaches is the respective periodic patterns and their interpretation. Note that
the end results are the same, namely a net present value of zero and an internal
rate of return of 10 percent. The meaning of the periodic elements as shown, how-
ever, is quite different, because in the case of economic profit we’re observing an
adjusted accounting profit as well as a declining capital base as reflected on the
books of the company. In the case of CFROI we are dealing with after-tax cash
flows in every instance that over time provide a recovery of the investment and a
hel78340_ch12.qxd 9/27/01 11:33 AM Page 407
408 Financial Analysis: Tools and Techniques
FIGURE 12–6
An Illustration of Economic Profit, CFROI, and Earnings Measures (thousands of dollars)*
Economic Profit Analysis Year 0 Year 1 Year 2 Year 3 Year 4 Year 5 Year 6 Year 7 Year 8
Book value of fixed investment (beginning) . . . . . . . — $10,000 $ 8,750 $ 7,500 $ 6,250 $ 5,000 $ 3,750 $ 2,500 $ 1,250
Working capital . . . . . . . . . . . . . . . . . . . . . . . . . . . . . — 2,000 2,000 2,000 2,000 2,000 2,000 2,000 2,000
Total book value . . . . . . . . . . . . . . . . . . . . . . . . . . . . — 12,000 10,750 9,500 8,250 7,000 5,750 4,500 3,250
Cost of capital . . . . . . . . . . . . . . . . . . . . . . . . . . . . . — 10% 10% 10% 10% 10% 10% 10% 10%
Capital charge @ 10% . . . . . . . . . . . . . . . . . . . . . . . — $ 1,200 $ 1,075 $ 950 $ 825 $ 700 $ 575 $ 450 $ 325
NOPAT . . . . . . . . . . . . . . . . . . . . . . . . . . . . . . . . . . . — 825 825 825 825 825 825 825 825
Economic profit (EVA) . . . . . . . . . . . . . . . . . . . . . — Ϫ375 Ϫ250 Ϫ125 0 125 250 375 500
Net present value of economic profits @ 10% . . . –0–
Cash Flow Return on Investment Analysis
NOPAT . . . . . . . . . . . . . . . . . . . . . . . . . . . . . . . . . . . — 825 825 825 825 825 825 825 825
Add back depreciation effect . . . . . . . . . . . . . . . . . . — 1,250 1,250 1,250 1,250 1,250 1,250 1,250 1,250
Operating cash flow generated . . . . . . . . . . . . . . — 2,075 2,075 2,075 2,075 2,075 2,075 2,075 2,075
Initial investment . . . . . . . . . . . . . . . . . . . . . . . . . . . Ϫ12,000 12,000 12,000 12,000 12,000 12,000 12,000 12,000 12,000
Cost of capital . . . . . . . . . . . . . . . . . . . . . . . . . . . . . — 10% 10% 10% 10% 10% 10% 10% 10%
Capital charge @ 10% . . . . . . . . . . . . . . . . . . . . . . . — 1,200 1,200 1,200 1,200 1,200 1,200 1,200 1,200
Capital amortization @ 10% . . . . . . . . . . . . . . . . . . . — 875 875 875 875 875 875 875 875
Terminal recovery of working capital . . . . . . . . . . . . — 0 0 0 0 0 0 0 2,000
Total cash flow required . . . . . . . . . . . . . . . . . . . . $Ϫ12,000 $ 2,075 $ 2,075 $ 2,075 $ 2,075 $ 2,075 $ 2,075 $ 2,075 $ 4,075
Present value of future cash flows . . . . . . . . . . . . Ϫ12,000
Net present value @ 10% . . . . . . . . . . . . . . . . . . –0–
Other Measures
ROE . . . . . . . . . . . . . . . . . . . . . . . . . . . . . . . . . . . . .
6.9% 7.7% 8.7% 10.0% 11.8% 14.3% 18.3% 25.4%
ROCE/RONA . . . . . . . . . . . . . . . . . . . . . . . . . . . . . .
6.9 7.7 8.7 10.0 11.8 14.3 18.3 25.4
ROGI . . . . . . . . . . . . . . . . . . . . . . . . . . . . . . . . . . . .
17.3 17.3 17.3 17.3 17.3 17.3 17.3 17.3
CFROI . . . . . . . . . . . . . . . . . . . . . . . . . . . . . . . . . . .
10.0 10.0 10.0 10.0 10.0 10.0 10.0 10.0
*This exhibit is available in an interactive format (TF
A Template)—see “Analytical Support” on p. 423.
hel78340_ch12.qxd 9/27/01 11:33 AM Page 408
CHAPTER 12 Managing for Shareholder Value 409
cash flow return of 10 percent. The economic profit pattern shares the distortion
inherent in accounting return measures, which is caused by the depreciation ef-
fect. CFROI provides a level reading because the depreciation effect has been
canceled out. Accordingly, in interpreting economic profit movements over time
this effect must be taken into account when, for example, judging the impact of
new investments that will temporarily depress the results of early years. Similarly,
goal setting in profit plans has to be done with proper attention to the accounting
implications.
At the bottom of Figure 12–6 we’ve listed the results for two common ac-
counting measures, return on equity and return on capital employed. In this ex-
ample they are equivalent, because we haven’t used financial leverage, and they
show the rapidly rising pattern that is also inherent in economic profit. The third
measure, return on gross investment, shows a level result, because we know that
this is a simple surrogate for cash flow return. Note, however, that ROGI here is
significantly higher than the true cash flow return we’ve calculated, an illustration
of how such shortcuts can give distorted results. Figure 12–7 shows in symbolic
form the basic divergence of accounting and cash flow measures over time on a
new business or investment project. Typically, the accounting return rises sharply
as depreciation reduces the capital base, while the cash flow return over the period
is positive and level, with a positive net present value over the life span of the
analysis.
Another way of showing the separation of accounting measures and eco-
nomic results is displayed in Figure 12-8, the left portion of which we encoun-
tered in Chapter 4 (page 136) during our discussion of the interrelationship of
ratios. This time we’re contrasting the family of accounting ratios that build up to
the return on equity with a symbolic diagram of the shareholder value creation
principles just discussed. Note the conceptual separation of the two approaches,
FIGURE 12–7
The Divergence of Accounting and Cash Flow Measures
Time0
n
Positive net present value
over the economic life
Rate of
return
Accounting
return
on assets
Project/business
internal rate of
return
Cost of
capital
hel78340_ch12.qxd 9/27/01 11:33 AM Page 409
410 Financial Analysis: Tools and Techniques
but also note that the basic performance drivers on the far left of the diagram are
indeed the same for accounting results and for cash flow generation.
This is a critical insight, because the issue facing companies as they move
toward shareholder value creation is how to reach across this barrier and link
the basic performance drivers to near-term and long-term management decisions.
This requires performance measures and incentives that will ensure long-term
cash flow results. To a large extent, the accounting ratios and measures in the cen-
ter of the diagram can be a distraction if they remain the main focus of manage-
ment attention, for it can be shown that if cash flow results are indeed the
foremost management goal, over time the accounting results will tend to fall in
line. But the reverse is not necessarily true. A glance at the listings of the best-
performing companies in the Fortune 500 ranked by shareholder return and by
FIGURE 12–8
Another View of Accounting vs. Cash Flow Performance
Pricing
conditions
Competitor
actions
Market
potential
Supply
conditions
Labor
markets
Cost
requirements
Revenue
management
Vol. Mix
EBIT
margin
Income tax
(before interest)
Cost
management
Lab.
Matl.
O.H.
Mkt.
G&A
R&D
Operating profit
after taxes
Sales
Operating
profit margin
Return on
investment
(RONA)
Net free
cash flow
expected
Weighted
cost of
capital
Operating profit
after taxes
Net assets
Net income
Shareholders'
equity
Inventory
management
Receivables
management
Payables
management
Capital
budgeting
Project
management
Working cap.
turnover
Sales
Working capital
Capital
turnover
Sales
Net assets
Fixed asset
turnover
Sales
Fixed assets
Return on
equity (ROE)
Operating Ratios Conceptual Barrier
Accounting
Performance
Market
Valuation
Investment Ratios
Financing Ratios
Long-term
debt policy
Business
risk
Payout/
retention
Leverage
proportions
Debt versus
equity
D/E (ROI Ð aftertax
interest rate)
Net leverage
contribution
Shareholder
value
hel78340_ch12.qxd 9/27/01 11:33 AM Page 410
CHAPTER 12 Managing for Shareholder Value 411
various accounting measures will tend to confirm that superior shareholder value
creation over time is reflected in strong accounting results.
This brief overview of the value-based measures in current use was in-
tended to provide enough of an insight for the reader to recognize the principles,
and to encourage further study of the much more extensive and specialized refer-
ences listed. Every one of the economic measures discussed has advantages and
drawbacks. This is especially true in the complexities of implementation and in
the process and attitudinal changes required to move from existing methodologies
and thought patterns to an organizational culture that enhances shareholder value
creation. For these reasons the results from value-based management efforts vary
significantly from company to company, but in the aggregate the new concepts are
making a significant contribution to better management decisions and corporate
performance.
Creating Value in Restructuring and Combinations
One of the ways management attempts to create shareholder value is through
changing the structure of the organization or combining the company with other
entities to achieve greater efficiency, placing more emphasis on core activities,
a broader business base, greater mass in a given line of business, and so on.
The 1990s witnessed unprecedented activity in restructuring, reengineering, and
streamlining, as well as record levels of mergers and acquisitions not only in the
U.S. but worldwide. Records were set both in numbers and in the size of the com-
binations, such as the Daimler-Chrysler and Exxon-Mobil combinations, and the
more recent AOL-TimesWarner merger. Despite the popularity of such efforts, a
variety of retrospective studies have shown that mergers and acquisitions create
shareholder value only in a surprisingly small proportion of the cases, because of
the premium prices usually paid, and the difficulties both in melding disparate
organizations and achieving expected synergies. Restructuring and reengineering
have a better track record, as management or takeover teams focus on running
existing businesses better, and eliminating activities not related to core capabili-
ties. We’ll discuss only some of the more common concepts of financial analysis
relative to this topic, suggesting that the reader turn to the references for coverage
of the highly specialized and voluminous techniques and methodologies involved.
Restructuring and Value
The opportunity to restructure arises from the perception—by management or
by interested outside parties—that a value gap exists between the value actually
being created by a company and the potential value achievable under changed
circumstances. In simple terms, this value gap is the difference between the pres-
ent value of the company’s projected cash flows under existing conditions, and the
present value of a different and usually higher cash flow pattern expected from
hel78340_ch12.qxd 9/27/01 11:33 AM Page 411
412 Financial Analysis: Tools and Techniques
the restructured company. The attraction for the acquirer in a corporate takeover
is to realize the potential benefits implicit in the perceived value gap. Depending
on the circumstances, the value gap can at times support sizable premiums in the
price bidding usually encountered in takeover situations. However, the final result
frequently creates a reverse value gap, since an excessive premium was paid in the
heat of the contest. Moreover, unanticipated difficulties are often encountered in
implementing changes in managing the combined entity and ultimately in adapt-
ing the corporate cultures, which are necessary steps in realizing the greater por-
tion of the benefits envisioned.
It’s beyond the scope of this book to develop all aspects of the rationale and
the special considerations and techniques employed by corporate takeover spe-
cialists, leveraged buyout consultants, and investment bankers. We cannot cover
the large variety of equity and debt instruments, including junk bonds with pre-
mium yields, which are used to achieve the restructuring of large and small com-
panies. Instead, we’ll briefly discuss the economic rationale and basic analytical
approach to determining the value gap. For this purpose, the most common rea-
sons that explain the value gap should be listed first.
Underperformance by parts or all of a company is likely to be the most im-
portant cause of lowered values. In thousands of situations, the historical record
and projected performance by existing management using existing strategies and
policies can be used to demonstrate that performance is inferior to that of appro-
priate peer companies. Such a record is usually directly reflected in relative share
price levels. Whether restructuring is initiated by the board of directors from
within, or through friendly or hostile initiatives by outsiders, the aim is to raise
lagging performance and cash flow expectations. Revision of business strategies,
improved cost-effectiveness and technology, reduction of unnecessary expenses,
and more aggressive management of the company’s resources are commonly used
to achieve such results.
Disposal of selected lines of business is an extension of the improvement
strategies mentioned above. Here the considerations might involve the sale of
poorly performing segments and reinvestment of the proceeds in more promising
parts of the company. An alternative use of such funds can be the distribution to
owners in the form of special dividends—or the repurchase of the company’s
shares in the market, which in recent years has become an increasingly popular
way of creating value with excess cash. Successful lines of business can also be
sold with the idea of realizing the economic gains from such “stars,” and using
the proceeds to fund potential successes remaining in the company’s portfolio.
Another aspect of such a sale is to focus management attention more sharply on
lines of activity it can competently manage for long-term success. Not to be over-
looked is the fact that from an acquirer’s point of view, proceeds from the sale of
part of a company can help finance the acquisition transaction itself.
Eliminating redundant assets is often used as a means of freeing economic
value that tends to remain hidden, involving such assets as unused real estate, fi-
nancial investments, and even excessive amounts of cash bearing only minimal
hel78340_ch12.qxd 9/27/01 11:33 AM Page 412
CHAPTER 12 Managing for Shareholder Value 413
returns. Restructuring analysis in effect focuses on separating those economic
values that are necessary to carry on the desired activities from those that can be
“cashed in” as not relevant to the core purposes of the new company.
It should be clear that the point of view of restructuring—whether done ex-
ternally or internally—is to develop, in essence, a break-up value of the company,
carefully examining each business unit and all major operating and nonoperating
assets held. The next step is to look for ways of not only improving operating cash
flows but also realizing the economic values of resources that can be stripped
away without affecting the chosen direction.
From an analytical standpoint, the approach is quite similar to the present
value cash flow valuation discussed earlier. The main difference is that a set of es-
timates is used, which identifies specific enhancements in the cash flow pattern,
as well as disposal values from businesses or from redundant resources.
If our earlier analysis can be stated as
Value ϭ PV (Free cash flow ϩ Ongoing value)
the restructuring approach can be stated as
Value ϭ PV (Free cash flow ϩ Ongoing value) ϩ PV (Enhancements)
ϩ PV (Disposal proceeds Ϫ Cash flow lost from disposals)
and the value gap will be the difference between the two results, the specifics of
which are developed using the present value patterns discussed in Chapters 8
and 11. A key attraction to the external restructurer is, of course, obtaining control
of the higher cash flows expected from the process.
It should be noted that two other aspects enter the picture. First, if a
company changes hands in a restructuring, the depreciation basis for the assets
involved is usually increased because of the higher values involved in the trans-
action, which under the purchase method of accounting are then recorded on the
combined set of books at the new level. A portion of this recorded value increase
translates directly into a stream of future cash flows because of the tax shield
effect of depreciation. For example, if the acquired company’s depreciable assets
have a book value of $500 million, but are written up to $650 million because of
the premium paid during the acquisition, the acquiring company will gain the cash
value of the tax shield on the $150 million depreciation differential during the
remaining life of the assets. If the company’s effective tax rate is 40 percent, a
total of $60 million in cash flow, spread over the remaining asset lives, will be cre-
ated, assuming the company has sufficient earnings to take advantage of these
write-offs. The present value of this cash flow pattern is a direct offset to the price
premium the acquiring company is paying. In effect, the U.S. government is help-
ing to finance the transaction in such cases.
Second, if the restructuring introduces higher financial leverage, as is often
the case, the impact on the accounting return on shareholders’ equity can be
favorable, even though the cash flow pattern might be adversely affected in the
hel78340_ch12.qxd 9/27/01 11:33 AM Page 413
414 Financial Analysis: Tools and Techniques
near term due to significant interest charges. As the risk exposure increases, ex-
pectations about the company’s likely performance can shift, affecting the valua-
tion of the future cash flows downward as higher discount rates must be employed
to value the expected cash flow pattern. The key to success in restructuring, as in
any significant change introduced to a business organization, lies in the imple-
mentation—and it’s here that the track record of existing management or that of
the new group involved will be scrutinized by analysts to gauge the likelihood
of realizing the expected benefits.
Combinations and Synergy
Another form of restructuring is found in the combination of two or more hitherto
independent companies. The rationale often claimed for acquisitions and mergers
is that synergy between the entities will bring real economic benefits. While em-
pirical studies have cast serious doubt on whether business combinations are as
mutually beneficial as hoped, it’s tempting to assume that joining two separate
businesses, particularly in the same industry, will tend to bring about some oper-
ating or market efficiencies. Examples might include the potential of fully engag-
ing partially utilized manufacturing facilities or warehousing space; eliminating
duplicate delivery systems or service networks; and consolidating certain ac-
tivities, such as marketing and selling, support staff, and administration. Many of
these benefits also are expected when complementary companies or even those in
different businesses are combined. In recent years there’s been increasing empha-
sis on combining already large businesses into huge entities, with the argument
that success in industries such as automobiles, oil, banking, aerospace and de-
fense, and communications depended in part on having critical mass and market
strength, with attendant benefits in such areas as vendor relationships and global
product/service patterns.
The impact of synergy can be felt in two major ways. The more specific
benefits are identifiable cash flow improvements, for example, lower expenses
that result from consolidation and reduction of facilities and staffs, and higher
contribution from improved market position and coverage. The expected levels of
these cash flow benefits must be estimated when an acquisition or merger is con-
sidered. Such estimates will, of course, vary in quality depending on how quan-
tifiable the various opportunities for improvement are. There also are likely to be
the kinds of tax shield and leverage effects we discussed in the previous section.
All of these elements are then combined in the cash flow analysis pattern on a
before-and-after basis to test for value creation.
A more general benefit is the expected impact on share price caused by the
hoped-for cash flow improvements. This is ultimately where shareholder value
improvement is recognized. The stock of the combined company might become
more attractive to investors and thus achieve a higher market price, reflecting the
benefits of the combination. Security analysts and the investment community gen-
erally expect combinations that are considered synergistic to result not only in
hel78340_ch12.qxd 9/27/01 11:33 AM Page 414
CHAPTER 12 Managing for Shareholder Value 415
a more profitable company, but possibly one poised for faster growth, with a
stronger market position, or subject to lesser earnings fluctuations as the cycles of
the individual businesses offset each other. The expectations implicit in this
reassessment and successful implementation may in time improve the total share-
holder return achieved.
Possible profit improvements resulting from a business combination can be
analyzed to the extent they are quantifiable. To do this, the analyst uses two sets
of pro forma statements. One set shows the projected net profits and cash flow
patterns from each company separately, while the other reflects the combined
company and includes the envisioned improvements. These statements then
become the basis for comparative ratio analysis and for calculating the value of
the individual companies and the combined entity with various methods. Once the
cash flow patterns have been determined from this analysis, the various present
value measures we’ve discussed can be applied.
At times it can be useful to determine separately the present value of all the
synergistic cash flow benefits that were identified. This present value then can be
used as a rough guide as the terms of the merger are being negotiated, because the
value of realistic synergy expectations should be considered in setting the value
premium the acquirer has to pay. In the end, however, the basis for valuation is
likely to be a combination of present value analyses, rules of thumb, earnings and
share price considerations, and a variety of tangible and intangible factors.
Combinations and Share Values
When an exchange of common stock is involved in an acquisition or merger
agreement, as is true in many cases, the valuation challenge is extended. The eco-
nomic valuation of the cash flow patterns, in which performance and synergistic
expectations are expressed on an economic basis, should be the basis from which
the parties proceed. The issue becomes one of translating those valuation results
into the medium of currently traded shares as valued in the stock market. This
process requires arriving at a mutually acceptable interpretation of the respective
values of the two different securities, as well as finding an appropriate ratio of ex-
change based on these shares. One aspect of this exchange is the usually signifi-
cant premium (between 15 and 25 percent is the usual range) paid over what
might be considered an initial fair economic value of the acquired company.
While in the end a numerical solution is applied, the underlying values and the
premium will be the result of extensive negotiation and a certain amount of “horse
trading.”
As the two stocks are valued, any differences in the quality and breadth of
trading in the securities markets can be an important factor. If, for example, a
large, well-established company acquires a new and fast-growing company, the
market value assessment of the acquirer’s stock is likely to be more reliable than
that of the candidate, whose stock might be thinly traded and unproved, or it
might reflect excessive speculation. But even if they had comparable market
hel78340_ch12.qxd 9/27/01 11:33 AM Page 415