COLOR MANAGEMENT- P7 pot
Bạn đang xem bản rút gọn của tài liệu. Xem và tải ngay bản đầy đủ của tài liệu tại đây (150.67 KB, 30 trang )
The ICC recommends that when making me asureme nts for the purpose o f generating
profiles, polarization filters s hould be removed, and instruments with polarization that
cannot be removed should not be used. (Instruments with polarization may still be appro-
priate for in-plant process control purposes, to monitor the deviation between dry proof and
wet print.)
Furthermore, time should where possible be allowed to ensure that the print is properly dry
before making measurements. In some cases, the drying time required to stabilize color
measurements is longer than might be expected from just observing the surface gloss or
tackiness.
20.3 Measurement and Calculation Procedures
for Transmitting Media
The recommendations of ISO 13655 should be followed when measuring transmitting media,
with the exception of the source of illumination, which is generally less critical because
transmitting substra tes with fluorescence are extremely uncommon.
ISO 13655 specifies that the measurement geometry for transmitting media should be either
0:diffuse or diffuse:0. If an opal glass diffuser is used, it should conform to that defined in ISO
5-2. The procedure for the calculation of tristimulus values should be the same as for reflecting
media, by using the CIE 1931 Standard Colorimetric Observer (2
), with the CIE illuminant
D50. The ISO 13655 spectral weighting functions, derived from this observer and illuminant,
should be used when the measurement is made with a spectrophotometer or spectroradiometer
in which the spectral sampling interval is coarser than that specified by CIE – that is, less than or
equal to 5 nm.
Of the different ISO 13655 measurement conditions, ICC recommends an M2 condition
(typically achieved with a tungsten source conforming to that in ISO 5-2), with any UV
excluded, when making measurements for characterization data intended for the creation of
ICC profiles.
The recommendations as to averaging a number of measurements should be consistent with
those recommended for reflection media, except where the image being measured is a
commercial input target, in which case the issues of consistency and uniformity should be
unimportant as the target should not exhibit such problems.
20.4 Measurement and Calculation Procedures for Color Displays
ISO 13655:2009 addresses the measurement of self-luminous sources, such as color displays.
Many other standards or recommendations also do so, including CIE Publication 122, IEC
61966 (parts 3–5), and the ASTM standards E1336 and E1455. These specifications recom-
mend measurement procedures as well as measurement instrument characteristics. Among
them they cover measurements obtained with both spectroradiometers and tristimulus col-
orimeters. Measurements of displays should be consistent with the recommendations made in
the standards appropriate to the type of display and/or measurement device used. If the
measurement instrument is in conformance with these standards, then the user need address
only a relatively small number of issues.
164 Measurement and Viewing Conditions
Care should be taken when making measurements to ensure that the sampling frequency, or
integration time, of the instrument used is synchronized with the frequency of scanning of the
display. If not, at least 10 measurements should be take n and averaged.
Although the use of telespectroradiometers or telecolorimeters for measurement from the
viewer position is often advantageous, they are not in common use among those building
profiles. The ICC recommends that they be used whenever possible for displa y measure-
ments, as they will include any veiling glare present, and therefore provide an accurate
representation of the color as perceived by the viewer. Where such instruments are not
available, and measurements are m ade in contact with the face of the display, some attempt
should be m ade to measure the veiling glare from the viewer position, so the result can be used
to correct the contact measurement data obtained. If a telespectroradiometer or telecolori-
meter is not available, a spot light meter can be use d to get the approximate ratio of
the luminance of the display faceplate, as observed from the viewer position, with the
ambient illumination on and off. This ratio c an be used to estimate the veiling glare from
the display black contact measurement. The contact measurements are corrected by adding
the veiling glare to them, typical ly assuming that the veiling glare has the same chromaticity
as the display white point for simp licity. If it is not possible to obt ain any estimate of the
veiling glare, the contact measurements should be corrected by assuming a veiling glare of
1cd/m
2
. However, users should be aware that this level of glare may not be corr ect for their
specific viewing conditions, which is why the two previously described methods are
preferred.
Where display profiling software allows users to specify the veiling glare as part of the input
for profile construction, the software should perform the data correction. When this is not the
case, the user will have to correct the data prior to building the profile.
It should be noted that, in this context, veiling glare refers to the ambient light reflected from
the display faceplate in the direction of the viewer. It does not refer to flare internal to the
display, which should be included in contact measurements if measurement patches are
displayed with an appropriate surround. It also does not refer to any flare that may result
from ambient illumination not from the display entering the measuring instrument or eye, as
this type of flare is not supposed to be included in profiles and, if present, should be removed
from measurement data before it is used for profile construction.
Measurements of the display should be made to ensure acceptable levels of constant channel
chromaticity, spatial uniformity, internal flare, and channel independence. Those displays
exhibiting poor uniformity or high levels of internal flare should be avoided, or care taken to
average measurements made with varying image surround and/or position. For displays with
inconsistent channel chromaticities, or low channel independe nce, profiles should be based on
an n-component LUT rather than a three-component matrix.
When spectral data is obtained during measurement, the CIE 1931 Standard Colorimetric
Observer (2
) should be used for the calculation of tristimulus values. Spectral data should be
obtained at wavelength sampling intervals of no more than 5 nm. In some cases finer sampling
intervals will be required to obtain sufficient colorimetric accuracy, as some display primaries
exhibit narrow spikes in their spectral radiance which are not well captured in an instrument
with a wider interval.
When using a telespectroradiometer, measurements should be taken from a display area of at
least 4 mm in diameter with an angle of collection of 5
or less. Averaging to avoid
measurement errors should also be undertaken.
ICC Recommendations for Color Measurement 165
20.5 Number of Measurements
Two significant issues must be addressed when making measurements for the construction of
profiles:
.
Device consistency and uniformity
.
Errors during measurement.
Averaging multiple measurements can minimize the impact of both factors.
A profile is appropriate for the condition obtained by the calibration of the device at the time
when the profiling target was printed. But for many devices, however carefully they are
calibrated, some variation will occur over time. The ideal profile should as far as possible reflect
the central value within this variation, minimizing its effect by averaging multiple
measurements.
Some printers, particularly offset printing presses, can suffer from a lack of uniformity over
the sheet. In part, this is caused by the ink coverage in other parts of the sheet. In an attempt to
minimize the effect of this variation, some profiling targets are “randomized” to avoid relatively
large areas of each ink being localized on the print. The ICC recommends the use of randomized
targets, if available. When they are not available or when the potential printed area is much
larger than the target, measurements should be made of multiple targets taken from different
positions on the sheet, with various orientations of the target. These should be averaged to
obtain the data to be used for profiling.
Errors may arise during measurement, due to measurement technique or po or instrument
repeatability. To minimize the effect of these errors, the ICC recommends that the average of a
number of measurements of each patch of the target be used when making profiles.
These are recommendations for the “ideal” situation. How many measurements need to be
averaged depends on the consistency and/or uniformity of the device, the instrument repeat-
ability, and/or the competence of the operator. Prior knowledge of the significance of these
factors may permit single measurements to suffice – however, without that knowledge multiple
measurements should be averaged as described here.
An advantage of basing profiles on well-prepared measurement data, which result from
averaging multiple printed samples and multiple measurements, is that the forward and inverse
transforms tend to be significantly more accurate.
20.6 Summary of the Recommendations
The recommended measurement conditions and procedures described above are summarized
below:
.
Reflectance and transmittance measurements of non-fluorescent media should conform
to ISO 13655:2009 measurement conditions M1 or M2. The exception is when the
actual illumination will be significantly different from D50. In this case, the profile
construction should use the colorime try corresponding to the actual illumination. (As noted
in Chapter 19, historic characterization data may be considered to be ISO 13655:2009
measurement condition M0.)
166 Measurement and Viewing Conditions
.
In certain situations, where the end-use viewing condition includes a significant amount of
UV and the substrates used fluoresce, the ISO 13655: 2009 M1 condition, in which the
measurement source effectively matches CIE illuminant D50, should be used.
.
The use of M0, M1, or M2 measurement conditions should be reported when exchanging
measurement data or profiles made using such data.
.
For reflectance measurements a white sample backing is recommended.
.
For reflectance instruments the use of polarizing optics should be avoided.
.
For displays, measurements should confo rm to ISO 13655:2009. Additionally, display
measurement instruments should be consistent with the recommendation of CIE Publication
122, IEC 61966 (parts 3–5), or the ASTM standards E1336 and E1455. Measurement should
ideally b e made with a telescopic instrument at the viewer position, but where this is not
possible, and the measurement is made using an instrument in contact with the face of the
display, the veiling glare at the viewer position should be measured. If this cannot be done, a
veiling glare of 1 cd/m
2
should be assumed.
.
When contact measurements are made of displays, the veiling glare should be used to correct
the data prior to profile construction, unless profile building software allows this as a separate
input. Multiple measurements should be made to minimize the effect of poor synchronization
between the display scanning frequency and measurement integration time.
.
For all media, multiple measurements of each patch should be averaged. The extent of this
should be consistent with the uniformity and/or temporal consistency of the device, and
temporal consistency of the measurement instrument and/or operator.
ICC Recommendations for Color Measurement 167
21
Fluorescence in Measurement
Most commercial printing papers on the market have significant amounts of fluorescent
whitening agents, or FWAs (also known as optical brightening agents, or OBAs), to maximize
their whiteness and brightness. These additives are important in producing modern, highly
brightened papers in response to customer demand.
FWAs contain stillbene molecules that are excited by photons in a spectral band that lies
mainly in the UV, and in response emit photons in a band which lies mainly within the visible
spectrum. The excitation and emiss ion regions peak at approximately 350 and 440 nm
respectively.
Measurement of fluorescing materials is not straightforward. Colorimetric measurements of
color prints are derived from measurements of the reflectance factor, which is the ratio of the
reflected radiance to the radiance reflected under the same conditions by a perfect reflecting
diffuser. Since this ideal diffuse reflector is non-fluorescing, the regular component of the total
reflected radiance is also free of fluorescence. However, the human visual system (and most
measurement systems) also responds to the fluorescent radiance component if present in the
reflection, and does not distinguish between regular and fluorescent components.
While the regular radiance component of the measurement can readily be calibrated so that it
is independent of the source illumination, the fluorescent radiance component is dependent on
the amount of energy emitted by the instrument source within the excitation region. A range of
different sources are used in graphic arts instruments, including tungsten, pulsed xenon, and
LEDs, and it is difficult to obtain good inter-instrument agreement and repeatability between all
types of instrument.
Many instruments suppress energy in the excitation region through the use of longpass filters
commonly referred to as UV-cut filters. However, the suppression of excitation energy cannot
be achieved in an ideal way by the use of such filters, since they have some transmission in the
excitation band and some absorption in the visible band; moreover, the two bands overlap over
the region 380–420 nm, so that complete suppression of excitation energy would lead to a loss
of response in the blue end of the spectrum. A complete measurement of the fluorescent
component of reflection can only be achieved by a bispectral instrument.
Color Management: Understanding and Using ICC Profiles Edited by Phil Green
Ó 2010 John Wiley & Sons, Ltd
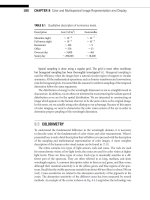
Figure 21.1 illustrates a highly brightened white printing paper measured with xenon,
tungsten, and UV-cut sources. The UV-cut source is in effect an ISO 13655 M2 measurement
condition, while the tungsten source corresponds to an ISO 13655 M0 measurement condition.
The xenon source has a relative spectral power in the UVexcitation region similar to D50, and
so is closer to the ISO 13655 M1 measurement condition, while not matching it within the
tolerances defined in ISO 13655. Table 21.1 shows the CIELAB values arising from the three
reflectances, together with the CIELAB DE
*
ab
difference relative to the UV-cut measurement.
Measurement of FWA-containing substrates is further complicated because FWA efficacy
decreases on prolonged exposure to UV radiation.
A CIE study [1] of UV-excluded and UV-included measurement of printed samples, using an
instrument with a xenon source, found differences of the order of 12 DE
*
ab
for unprinted paper
and 3–4 DE
*
ab
for solid inks, on a highly brightened paper. The largest differences are found in
unprinted paper and lighter tints, while darker tints mask the fluorescence somewhat. Where
present, yellow ink tends to absorb UV radiation effectively and minimize fluorescence.
A viewing booth conforming to ISO 3664 is required to match the CIE D50 illuminant in the
UVas well as the visible. The D50 illuminant is defined over the range 300–800 nm, and has a
significant amount of UV content, which is not matched spectrally by the D50 simulators used
in commercial viewing booths. Moreover, end-use viewing environments have varying
amounts of UV depending on the type of lamps used and the permittivity of window glass.
400 450 500 550 600 650 700
0.2
0.4
0.6
0.8
1
1.2
1.4
1.6
wavelen
g
th (nm)
Reflectance factor
UV−cut
Xenon
Tungsten
Figure 21.1 Spectral reflectance of white paper measured using xenon, tungsten, and UV-cut sources
Table 21.1 CIELAB values for measurements of white paper in Figure 21.1
L
Ã
a
Ã
b
Ã
DE
*
ab
UV-cut 95.96 0.14 0.71 0
Tungsten 96.09 2.10 À5.24 6.27
Xenon 96.94 5.18 À17.70 19.11
170 Measurement and Viewing Conditions
This degree of uncertainty in measurement and viewing poses a number of problems in color
management. First, the measurement of the sample depends on the UV in the instrument source,
but the appearance depends on the UV in the viewing illumination, and these may not be well
matched. Secondly, different media often have different amounts of FWA and, where this is the
case, matching the white point spectrally is difficult or impossible. In addition, any apparent
visual match between media with different amounts of FWA will only hold under one viewing
condition.
Color management operates on colorimetric coordinates, and, on a reflective medium,
increasing the peak reflectance is not possible. As a result, the closest colorimetric match (in a
minimum DE
*
ab
sense) is achieved by a color with a larger negative b
Ã
value, resulting in a more
bluish rather than a whiter appearance.
Recent revisions to the ISO standards for graphic arts measurement and viewing conditions
(ISO 13655:2009 and ISO 3664:2009) provide two possible approaches to the problem of
matching proof to print with FWA-containing substrates:
1. Discount the fluorescent radiance by excluding UV from the measurement source, using
measurement condition M2 in ISO 13655. This will eliminate most of the uncertainty which
arises from fluorescence, and will also tend to lead to more similar colorimetric values for
the media white on both brightened and unbrightened papers. This approach is appropriate
when there is little or no UV in the end-use viewing condition, but if the proof and print
media have different amounts of FWA they will not match whe n compared in a viewing
booth conforming to ISO 3664.
2. Ensure that the amount of UV in both measurement and viewing conditions is matched,
using measurement condition M1 defined in ISO 13655, and viewing prints in a booth whose
light source simulates D50 in the UVas well as the visible, within the tolerances defined in
ISO 3664. This approach is applicable when there is a significant amount of UV in the end-
use viewing condition.
The ICC recommends the first of these two approaches in most situations, except where there
is a significant amo unt of UVin the end-use viewing condition and the measurement instrument
has an M1 measurement condition.
Chapter 20 provides more information on the measurement of imaging media for color
management.
References
[1] CIE (2004) The Effects of Fluorescence in the Characterization of Imaging Media, Publication 163:2004, Central
Bureau of the CIE, Vienna.
Fluorescence in Measurement 171
22
Measurement Issues and Color
Stability in Inkjet Printing
It has been observed that inkjet prints exhibit color change following printing. This can be an
issue in situations where color accuracy is critical, such as proofing. Profiles produced from
measurements of inkjet-printed test charts may not describe a stable state of ink and media
interaction, and prints which are within a given tolerance when printed might change to the
extent that they are no longer in tolerance when appraised.
The aim of this chapter is to describe the common types of inkjet paper media and their
performance with dye-based and pigment-based inks presently on the market, and to indicate
the magnitude of color shifts which can be experienced.
22.1 Inkjet Media
The basic media types are: uncoated, matt coated, gloss coated, swellable, and microporous.
These cat egories do have several variations thanks to the manufacturers’ efforts to improve
product performance and reduce costs.
The uncoated media type is the basic surface-sized paper. While the manufacture will often
be to a high standard, the performance is inferior to coated media in terms of color and image
quality and therefore will not be considered any further here.
The aim of the paper coating is to give the optimum color strength and dot definition to
give the optimum im age quality with the quickest drying time. Therefore the dye or
pigment has to stay at or close to the surface while the i nk vehicle has to be drawn down and
dispersed into the bulk of the coating and paper. How this is done depends on the coating
type. What has been found is that the color formed is not stable even under standard room
conditions.
For matt coated papers, the ink is jetted onto a filled coating containing a high proportion of
silica mixed with other fillers and pigments (e.g., calcium carbonate and titanium dioxide)
bound with polyvinyl alcohol (PVOH). The dye or pigment will be electrostatically attracted to
Color Management: Understanding and Using ICC Profiles Edited by Phil Green
Ó 2010 John Wiley & Sons, Ltd
the silica, and so will remain at the surface. But each dye will be attracted to the silica to a
varying degree according to the type of dye molecules present. This can lead to migration
further into the layers, especially when surface silica particles receive a large volume of ink. To
help stabilize this situation, dye fixants or mordants can be mixed with the PVOH to restrict the
dye movement, though this can cause problems with removing the ink vehicle. The ink vehicle
needs to travel past and disperse through the PVOH/silica coating. Dye fixants (and any other
performance additives present) may impede the removal of the vehicle and actually allow the
dye to move around. Another factor that can occur is a change in color due to dye and dye fixant
interaction. This may change over time with the changing ratio of free and bound dye
molecules, and is more of a problem with cheaper papers. Similar electrostatic interactions
occur with pigment inks, but the aim is to allow proper orientation of the pigment on the surface
so the control of how quickly the ink vehicle is removed is vital and the surface color can change
while the pigment dries.
Glossy coated papers can be similar in structure to the matt coated papers but tend to have at
least two coated layers over a very smooth paper coated with clay or barium sulfate. In the top
layer a lower volume of fillers is used, with functional polymers being used in their place. The
polymers tend to have dye fixing groups grafted along their molecular chain, to which the dyes
are attracted. The bottom layer binds the ink vehicle and controls its dispersion into the paper
bulk, so as to avoid cockle and curl. Similar problems with dye migration and bonding
interactions can occur as with matt coated papers. Pigments can create other problems: for
example, poor surface fixing can lead to poor rub resistance and low aggregation of pigment
particles, leading to poor color strength. Too strong an attraction when the ink hits the paper can
lead to poor orientation of pigment particles, and, in extreme cases, bronzing can occur. This
can change over time, with the pigment particles changing to a more energetically favorable
orientation with the polymer dye fixing groups.
Swellable coated papers are another type of glossy coated paper. Current market trends
indicate that this type is mostly used on a polyethylene extruded photo film-type base, and so
forms a different product. The “swellable” term comes from the ability of the polymer (usually
PVOH or gelatin) to increase in size when absorbing the ink vehicle. After the ink vehicle enters
the coating it is dispersed throughout the layer and the coating eventually shrinks to its original
size. The speed at which this occurs depends on the particular ink system and the constituents.
Therefore dot movement and resultant color change can occur, though this is less of a problem
with new formulations. Dye migration and pigment reorientation within the layer can also
occur during the return to size.
The principal layer of microporous papers is a coating of nanometer-size pores usually
formed from the arrangement of silica in a high pigment-to-binder ratio. The pores enable the
ink vehicle to be very quickly removed and dispersed through the paper. At the surface, dyes
and pigments are held in a similar manner to that of the matt coated papers but the pore structure
can lead to colorant movement. Depending on the size of pore, the dye molecule can travel into
the coating, but is not actually chemically fixed within the pore. The pore will act as a capillary
and the dye molecule can travel back up to the surface. The rate of travel will depend on the dye
type, and hence there can be color changes over time.
Some pigments will do the same but due to their larger size tend not to enter the pores.
Note that there are a wide variety of coated media commercially available and only very
general trends have been described above. This is especially true for combinations of coating
types to allow a wider range of inks to be used.
174 Measurement and Viewing Conditions
22.2 Dye-Based and Pigment-Based Inks
Inkjet printers use either dye- or pigment-based inks. Dye-based inks tend to show lower light
stability compared to pigment-based inks. Pigments tend to produce smaller color gamuts,
though recent advances have increased the gamut producible with a pigment inkset. It is not
possible to obtain good results using pigment-based inks with swellable media.
22.3 Trends by Paper and Ink Type
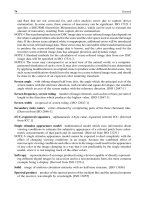
An investigation into this issue has been carried out by London College of Communication and
Felix Schoeller GmbH on each of the main types of paper with dye and pigment inksets. CMYK
primaries and their overprints were printed at 95%, 50%, and 10% tints and measured with a
GretagMacbeth SpectroEye immediately after printing and then periodically over four
days (swellable, matt, and gloss coated) and seven days (microporous). The environmental
conditions were a constant 22
C and 50% RH. Table 22.1 lists the average CIELAB color
differences between the first measurement and the final measurement, together with color
difference components DL
Ã
, DC
Ã
, and DH
Ã
.
The following observations can be made:
1. There is a color shift for both inksets on all the media types.
2. Comparing the two inksets, the dye-based set has the higher color shifts with corresponding
shifts in chroma and hue.
3. In all cases the prints get lighter with time while chroma falls.
4. The biggest lightness shifts occur with the microporous media for both ink types.
5. Color changes continued throughout the period of study, with no indication that a stable state
had been reached.
If we were to rank the paper and ink combinations then the sequence would look like this
(most stable first):
1. Matt coated þ pigment ink
2. Gloss coated þ pigment ink
Table 22.1 Average color differences for different media and ink types
Dye-based ink
Paper type CIELAB DE
*
ab
CIELAB DL
Ã
CIELAB DC
Ã
CIELAB DH
Ã
Matt coated 1.23 0.57 0.94 0.55
Gloss coated 1.80 0.78 1.32 0.94
Microporous 1.90 0.85 1.51 0.78
Swellable 1.23 0.61 0.88 0.61
Pigment-based ink
Paper type CIELAB DE
*
ab
CIELAB DL
Ã
CIELAB DC
Ã
CIELAB DH
Ã
Matt coated 0.87 0.68 0.53 0.12
Gloss coated 1.09 0.74 0.79 0.13
Microporous 1.22 0.81 0.80 0.44
Measurement Issues and Color Stability in Inkjet Printing 175
3. Microporous þ pigment ink
4. Matt coated þ dye-based ink
5. Swellable þ dye-based ink
6. Gloss coated þ dye-based ink
7. Microporous þ dye-based ink.
Therefore the use of pigment inks is to be recommended for stability of print, which is
unsurprising given the inherent properties of pigments, including their inertness and particle
size.
The findings given here are a summary of results, based on average measurements of the
primary and secondary colors. The color shifts would also probably increase in magnitude at
higher temperatures and humidity levels.
Offset litho and electrostatic printing processes were also tested using the same methodology
by Helwan University, Cairo, and the results showed color shifts that can be regarded as not
significant for most applications.
176 Measurement and Viewing Conditions
23
Viewing Conditions
The appearance of a color is significantly influenced by the illumination under which it is
viewed. Perhaps the most important factors are the intensity and the spectral power distribution,
or SPD (the relative amount of energy at each wavelength), of the illumination source.
Changing the SPD of the illumination alters the radiance reflected from a surface, since more
energy will be reflected at those wavelengths that correspond to the highest relative power in
the illumination. Although the human visual system has an outstanding ability to preserve the
approximate appearance of a stimulus as the SPD of the illumination source changes, the retinal
and cognitive mechanisms do not completely achieve color constancy. Moreover, in color
management the goal is to produce a metameric match in which the required tristimulus values
are defined but not the relative spectral power required to achieve this colorimetry. As a result a
metameric match achieved under one illumination may fail under a different illumination.
Traditionally in graphic arts the colorants used in photographic media and printing inks had
spectral reflectances that were very similar and so transparencies and prints matched quite
consistently even when the viewing illumination was changed. Modern colorants (as used for
example in dyes and toners in digital printing) often have quite different spectral reflectances
from these traditional media, and can be particularly prone to mismatches arising from changes
in viewing illumination.
In addition to the effect of the relative spectral power of the illumination in the visible region,
the level of UV radiation in the illumination source will strongly affect the appearance of any
materials that fluoresce.
In real viewing conditions there is typically a mix of some or all of incandescent, fluorescent,
LED, and daylight illumination. The relative amounts of these may vary according to which
lamps are illuminated at a particular time, the contribution of natural daylight through its
intensity and the elevation of the sun, and any shading provided by window blinds, drapes, or
curtains.
Since the appearance of a stimulus is likely to vary with the type of illumination,
standardization of viewing conditions is essential in order to provide an agreed basis for the
communication of color appearance and the assessment of color matches. It is important to note
here that the illuminant used as a standard may not correspond to that of the actual illumination
source in the end-use viewing condition, but a well-defined viewing condition is nevertheless
Color Management: Understanding and Using ICC Profiles Edited by Phil Green
Ó 2010 John Wiley & Sons, Ltd
essential as a reference for the purposes of data exchange. If the actual end-use viewing
condition is known, then this can be used as the ref erence condition, but it is rare for the end-use
viewing condition to be defined as unambiguously as is necessary.
The basic properties which may be used to define a viewing condition are the chromaticity
and intensity of the illumination source, the reflectance of the background, and (where optically
brightened substrates are viewed), the relative UV content of the source. A more com plete
specification is provided if the SPD of the illumination source, the relative luminance of the
surround, and the chromaticity of the adopted white point are also defined.
In a specification of standard viewing conditions for reflective copy it is usually assumed that
the adopted white is a perfect diffuse reflector, which will thus have the same chromaticity as
the illumination source. For emissive and projected displays it is common to assume that the
observer is completely adapted to the display white point and hence the chromaticity of the
display white is taken as the adopted white.
Many industries involved in the manufacture of color products, such as paper, paints,
and textiles, have agreed on standardization of CIE illuminant D65, which has a correlated
color temperature of 6500 K, for measurement and viewing. D65 corresponds to average
north-sky daylight. CIE daylight illuminant D50 (corresponding to a correlated color
temperature of 5000 K and noon-sky d aylight) is used in graphic arts, largely because it is
closer to the chromaticity of indoor illumination and to the white point used in d aylight
photography.
23.1 PCS Viewing Condition
In situations where the source or destination viewing condition is not D50, the PCS-side
values are chromatically adapted to D50. The ICC specification requires that in such c ases the
matrix used to chromatically adapt the adopted white point to D50 is specified in the profile in
a chromaticAdaptationTag (“chad” tag), and if desired the CMM can use this to convert an
image data encoding to the chromaticity of the actual source or destination viewing condition.
Hence the viewing condition defined for the ICC perceptual PCS should be considered as part
of the specification of a reference interchange encoding, not a requirement to actually use
D50 in the color management workflow.
Equally, it may be desirable to evaluate proofs and final reproductions under the end-use
viewing condition. This is not precluded by the specification of a reference viewing condition
for the PCS, which is intended to provide a reference condition for the communication of
appearance rather than a simulation of actual end-use viewing conditions.
This may seem to be an overcomplex solution in some situations, such as where a D65
display encoding is converted to a print encoding to be viewed under D65 illumination. In this
case chromatic adaptation to D50 appears to be redundant. However, to achieve interoperability
it is preferable to have a single reference viewing condition, with a well-defined procedure for
transforming data between the reference viewing and all actual viewing conditions. The choi ce
of D50 for the PCS reference viewing condition also means that it matches the actual viewing
condition most commonly used in graphic arts.
If a source or destination profile is defined for a viewing condition that is not D50, profile
generators can include a viewingCondDescTag which provides a textual description of the
actual viewing conditions, and a viewingConditionsTag specifying the parameters of the actual
178 Measurement and Viewing Conditions
viewing condition. The viewingConditionsTag enables the XYZ of the illuminant and surround
to be stored in the profile as unnormalized CIE XYZ values, in which Y is in units of candelas
per square meter and hence also implies the illuminance and surround relative luminance. The
viewingCondDescTag can be used to distinguish between profiles generated for different
viewing environments and to select one appropriate for the intended use.
23.2 Viewing Conditions and Rendering Intents
In versions of the ICC specification prior to v4, a single PCS and associated reference medium
viewing environment were specified. The v4 specification introduced a distinction between the
PCS used for colorimetric and perceptual rendering intents. The colorimetric PCS is now wholly
measurement based, and as a result is no longer associated with a viewing condition. The
perceptual PCS is now defined for a physically realizable medium with specified maximum and
minimum luminances in an ISO 3664:2009 P2 viewing condition. This lower level (500 lux)
is chosen for the ICC PCS since it is more typical of end-use viewing environments in the home
and office than the higher ISO 3664:2009 P1 (2000 lux) level used in viewing booths for critical
comparison of prints. It also corresponds to an adopted white luminance that is practically
realizable on a color display in a home or office environment.
Since the colorimetric PCS is measur ement based, inversion of the matrix stored in the
chromaticAdaptationTag will produce values corresponding to the original medium colori-
metry under the illuminant used to compute the original medium XYZ values. However, the
PCS values stored for the perceptual intent will have been the result of a color rendering
operation adjusting for factors such as dynamic range and gamut mapping, adaptation for
differences between the PCS and end-use viewing conditions, and any further color adjust-
ments applied to generate a preferred rendering. As a result the chromaticAdaptationTag is
unlikely to produce either the original colorimetry or the optimal colorimetry (with preference
adjustments) for the source viewing condition when inverted and applied to the PCS values for
the perceptual intent.
23.3 Viewing Conditions for Prints, Transparencies, and Displays
Viewing conditions for graphic arts media are specified in ISO 3664: 2009. This essentially
specifies a D50 illuminant for color transparencies and prints, together with appropriate
intensity levels and tolerances.
Reflection print viewing environments conforming with condition P1 should have an
illuminance of 2000 lux. This produces an adopted white luminance of 636.6 cd/m
2
for a
perfect reflecting diffuser (since a diffuse reflector radiates 1/p of the incident flux).
Transparency illuminators conforming to condition ISO 3664:2009 T1 should have a
luminance of 125 0 cd/ m
2
. When covered by a transparency whose base film has an assumed
transmittance of 50%, the white point lumi nance is 625 c d/m
2
and is sufficiently close to the
adopted white luminance of the reflection print in the P1 condition for the user to have the
same adaptation state when viewing transparency and print side by side.
Reflection print viewing environments conforming to condition P2 should have an illumi-
nance of 500 lux, producing an adopted white luminance of 159.2 cd/m
2
for a perfect reflecting
diffuser.
Viewing Conditions 179
Extraneous light and colored objects in the field of view should be avoided when performing
assessments in a standard viewing environment.
Displays used for the appraisal of color images should have a white point c hromaticity
which approximates that of D65 and has a luminance of at least 80 cd/m
2
.Whenthedisplayis
used for direct c omparison between soft copy images and prints viewed under a P2 condition,
it is preferable for the user to have a single adopted white point and hence the display white
point should be closer to the chromaticity of D50 and should have a luminance level of a t lea st
160 cd/m
2
.
Ambient illumination in the display environment should be relatively low, so that the
surround luminance is one-q uarter or less of the luminance of the display white point. The
correlated color temperature of the ambient illumination should be less than or equal to that of
the display white point. The background against which images are displayed should have no
more than 20% of the display white point luminance, and should ideally be 3% of the white
point luminance. As with reflection print and transparency viewing, veiling glare and colored
objects in the field of view should be avoided.
For substrates which are not completely opaque, the sample backing will have an effect on
the color appearance and should be consistent with that used in practice. For measurement
purposes the ICC recommends a white sample backing and for consistency this should also be
applied to viewing.
23.4 Other Standard Viewing Conditions
There are many circumstances when the standard viewing conditions for prints, transparencies,
and displays defined in ISO 3664 are not relevant, particularly in the case of source images
encoded in reference and interchange color encodings such as the ISO 22028 and IEC 61966-2
series. The viewing conditions associated with these encodings will differ from that of the ICC
PCS, and hence require chromatic adaptation (and possibly an appearance model transform, if
illuminance and surround relative luminance are different) to the ICC PCS. Details of these
viewing conditions can be found in the relevant standards.
23.5 Viewing Conditions and Measurement
The aim of color measurement is to provide a metric which correlates with visual perception.
This implies that the geometry and spectral responsivity of the measurement instrument should
ideally simulate those of the humanvisual system. For reflective samples, it also implies that the
sample should be illuminated with a source having the sam e SPD as is used by the observer
when viewing the sample. For this reason, ISO TC 130 and ISO TC 42 have collaborated in joint
working groups to produce revisions to ISO 13655 and ISO 3664 that harmonize the SPD of
both instrument and standard viewing condition.
ISO 3664:2009 specifies that reflective samples shall be judged in a viewing environment
having a source corresponding to CIE daylight illuminant D50. ISO 13655:2010 specifies four
source SPDs for measurement instruments, of which M1 is recommended for measurement of
graphic arts samples. In both cases the SPD of D50 is required to include the spectral power of
D50 that lies outside thevisible range and in the UV, which is essential to ensure a correspondence
180 Measurement and Viewing Conditions
between measurement and appearance when fluorescent whitening agents are present in the
sample – as is the case for almost all commercial printing papers.
Where the source used in the end-use viewing condition includes little or no UV, the ICC
recommends that measurements are made with the ISO 13655 M2 measurement condition,
which excludes UV from the source (see Chapters 20 and 21 for more details). This will lead
to a better prediction of the appearance in the end-use viewing condition. It does have the
effect that the UV component in the standard viewing condition may give rise to a mismatch
between proof and print, where the proof has been made on a substrate with a different a mount
of FWA than that of the final print. In this situation it may be desirable to temporarily mask the
UV component from the viewing booth source to evaluate the match in the absence of
fluorescent excitation, although users should be aware that this viewing condition does not
conform to ISO 3664.
For display measurement, ISO 13655 specifies that XYZ values should be computed from
the spectral power of the display emission (without a standard illuminant, since the display is
self-luminous), and may be normalized by dividing by 100/Y
w
, where Y
w
is the Y tristimulus
value of the adopted white. ICC color management assumes that the user is completely adapted
to the display white point: the display colorimetry is normalized to the display white and
chromatically adapted to the PCS D50 white point. For most applications this will produce an
optimal conversion between a source image on a display and a reproduction on another medium
with a d ifferent viewing condition. The chromaticAdaptationTag matrix can be used to recover
the original colorimetry in the source viewing environment if required.
23.6 Assessment of Viewing Conditions
Aim values for reference viewing conditions are defined in ISO 3664. A particular realization of
this reference viewing condition can be assessed in terms of its ability to meet the SPD,
chromaticity, and intensity of illumination. Details of such assessment are given in ISO 3664:
.
Tolerances for the luminance or illuminance are approximately 25% of the aim value, with
departures from uniformity no greater than 25% between center and edge.
.
The chromaticity of the illumination is required to be within a radius of 0.005 from the aim
values specified for D50.
.
The SPD of the illumination is evaluated with respect to the CIE daylight illuminant D50 by
means of a color rendering index (CRI) of at least 90 and metamerism index in the UV (MI
UV
)
of less than 1.5.
Computational procedures for calculating these parameters are given in ISO 3664.
For the practical evaluation of a viewing condition, it is essential to use a telespectror-
adiometer with a narrow spectral bandpass (<5 nm) calibrated to a standard source traceable to a
national standardizing laboratory. Illuminance and SPD can be measured directly if a cosine-
correcting diffuser is fitted, or alternatively luminance and SPD can be measured from a sample
of known reflectance (such as a calibrated reference material), whereby the measured values are
divided by the sample reflectance to obtain the corresponding values for the incident
illumination. Where only illuminance is being assessed, a simple photometer (preferably
traceable to a national standardizing laboratory) is sufficient.
Viewing Conditions 181
23.7 Viewing Condition and Color Appearance
The viewing condition under which a color stimulus is viewed strongly influences its
ap pearance. Colorimetric coordinates can be computed f or a given viewing condition, but
to predict the appearance of the same stimulus under a different viewing condition – or to
predict the colorimetry required to match the o riginal stimul us in a different viewing
condition – a model of color appearance is required. Currently the CIECAM02 model is
recommended by the CIE for this purpose.
Although the details of calculating appearance coordinates using models such as CIECAM02
are outside the scope of this chapter (readers are referred to the literature describing these
models), a brief summary is given here of the effect of the viewing condition on color appearance
and how these effects should be interpreted or applied within an ICC color management
workflow.
Where the source and destination image colorimetry are defined for the same viewing
condition, the appearance mode l should predict the same XYZ coordinates for both source and
destination conditions, and is therefore not required. In situations where the only change in the
viewing conditions between source and destina tion is a change in the chromaticity of the
adopted white point, a chromatic adaptation model is sufficient to predict the change in XYZ
coordinates required to match the original under the source conditions to the reproduction
under the destination conditions. Only where other differences between source and destination
viewing conditions exist is an appearance model required in order to predict the final
appearance.
For the purpose of modeling color appearance, a number of terms can be defined. The
stimulus forming the focal color perception is assumed to extend to 2
of angular subtense. The
background is the region subtending approximately 10
beyond this stimulus. The adapting
field includes everything outside the background, while the surround is a categorical repre-
sentation of the ambient illumination in comparison to the image white point luminance.
Surround categories in CIECAM02 are average, dim, and dark.
The adapted white point is the internal human visual system white point for a given set of
viewing conditions, while the adopted white point is the white point actually used in the
calculation of appearance coordinates and white point normalized colorimetry.
In CIECAM02, the adapting luminance L
A
is the luminance of the adapting field. In most
cases a “Grey World” assumption is made and the adapting luminance calculated as one-fifth of
the luminance of the adopted white point.
The background relative luminance parameter Y
b
is calculated by dividing the luminance of
the background by the luminance of the adopted white point.
Color appearance models were derived primarily for simple color stim uli, but are generally
applicable to complex images. The main issue to take into consideration is how the image
background is to be defined. So me studies have found that taking the mean luminance of a
complex image provides an adequate description of the background effect on a given pixel.
Alternatively a “Grey World” assumption is sometimes made and the Y
b
parameter is set based
on a neutral gray background with a reflectance of 20%.
If a profile includes a viewingConditionsTag, the L
A
parameter is found by dividing the Y
tristimulus value of the illuminant by 5. The surround category is found by comparing the Y
tristimulus values of the surround and illuminant: if the ratio of surround to illuminant is 20% or
above, the average surround category is chosen; if the ratio is below 20% the dim surround
182 Measurement and Viewing Conditions
category is appropriate; and finally if the ratio is close to 0 the dark surround category should be
chosen.
ISO 3664 P1 and P2 conditions (and hence the ICC perceptual PCS and most print-centric
tasks such as print and proof viewing) imply a CIECAM02 “average” surround condition, while
display-centric calibrated RGB encodings are typically based on a surround relative luminance
which corresponds to a “dim” category. For other media, such as projection displays, a “dim”
surround may be applicable.
The XYZ of the illuminant stored in the viewingConditionsTag also provides the data
required to perform chromatic adaptation from the PCS D50 illuminant to other illuminants as
required, either by using a chromatic adaptation transform such as the CAT02 or Bradford
models, or in a color appearance transform in which chromatic adaptation is an element in the
computational procedure.
A input profile can also include a colorimetric intent image state tag (“ciis”), which specifies
how the data for the colorimetric intent stored in the profile should be interpreted. Four
signatures are currently supported:
.
scene colorimetry estimate “scoe”
.
scene appearance estimate “sape”
.
focal plane colorimetry estimate “fpce”
.
reflection hard copy original colorimetry “rhoc.”
For the first three of these signatures, the adopted white is normalized to 1.0 as with
reflection print and display colorimetr y, but the mediaWhitePointTag Y tristimulus value is
relative to the adopted white Y value and can be larger than 1.0. This allows the calculation of
appearance effects which depend on viewing condition parameters such as the luminance of
the adapting field, and also makes it possible to communicate the appearance of a scene
containing specular highlights with luminances greater than that of the diffuse white point of
the destination media.
Examples of typical corrections to media-relative colorimetry that are required in a color
management workflow are the adjustment of brightness and colorfulness to compensate for the
effect on tonal reproduction of a dark background or an adapting field whose illuminance is
significantly lower or higher than the PCS perceptual intent viewing condition (such as print
appraisal under typical office lighting with 200–400 lux illuminance, or proof viewing in an
ISO 3664 P1 condition with 2000 lux). A dark background, such as a transparency rebate, gives
rise to an impression of a brighter image, especia lly in shadow areas. The contrast and
colorfulness of a reflective print will increase with increasing incident illumination, while that
of a display will fall. Both these effects can be modeled by CIECAM02 with reasonable
success.
Viewing Conditions 183
Part Five
Profile Construction
and Evaluation
24
Overview of ICC Profile
Construction
An ICC profile contains the color processing elements required to transform data between the
profile connection space and the data encoding of the profile. The particular elements to be
included are specified for each profile class in Annex G of the IC C specification. The profilewill
also include additional data to help the CMM to interpret the encoded transform correctly, and
to help the user or workflow system to select the profile for a given conversion (or to select
particular color processing elements with the profile).
Full information about the data to include in a profile is given in the specification, which
should be the primary reference for anyone building ICC profiles. Detailed guidance on
particular aspects of profile construction and use is provided in other chapters; in this chapter
the goal is to provide an overview of the process of profile creation and where appropriate to
point to other sources of information. It should be noted that references to section numbers in
the ICC profile specification refer to numbering in Version 4.3 of the specification (ISO 15076-
1, revised 2008–2009, also known as ICC.1:2010).
All valid profiles require a 128-byte header, a tag table identifying the tags present in the
profile, a description string, the numerical values of the media white, and the color processing
elements and other tags as defined for the profile class by the specification. Profiles may
optionally include other valid tags, together with private tags not defined in the specification but
registered in the ICC Signature Registry. In general the ICC discourages the use of such private
tags as they may limit the interoperability of the profile and lead to inconsistent results, since
CMMs may not know how the private tag is to be interpreted.
The ICC profile format is a binary format which contains all the information required to
transform color data between the data encodings represented by the profile. For most profile
classes these encodings will consist a data encoding representing a device or color space of
some kind on one side, and the ICC PCS on the other. This allows a CMM to connect source and
destination profiles for a transform unambiguously, regardless of the applications or operating
system used. The tag structure of the profile format provides a baseline functionality, which can
be extended in well-defined ways as needed.
Color Management: Understanding and Using ICC Profiles Edited by Phil Green
Ó 2010 John Wiley & Sons, Ltd
24.1 Why a Binary Format?
A binary format of this kind is of course not the only way of encoding a color transform.
Possible alternatives include:
1. A procedural definition of the transform, in which the “profile” includes the code as well as
the data to apply the transform.
2. A text file which provides the transform data only.
3. An XML-based format in which the color processing elements and other elements of the
“profile” are specified in a schema.
Each of these has applications in particular workflows. A procedural definition may ensure
that the transform cannot be misinterpreted, although it has considerably less flexibility and
platform independence, and may require the use of proprietary intellectual property in the
procedure used. A simple text file may be useful in workflows where the procedural
implementation is well defined and a simple method of encoding new processing elements
is desired. And an XML-based format can take advantage of the properties of XML, which
provides a mechanism for developing structured content with well-defined semantics. Text-
based and XML-based formats also have the advantage that they can, if desired, be human
readable and editable in a simple text editor.
Internal ICC projects have shown that it is feasible to convert programmatically between the
ICC binary profile format and other profile formats such as XML or text files. The current ICC
format enables a high level of interoperability across a very wide range of application programs
and operating systems. At the same time it contains sufficient flexibility to support new
applications (as can be seen for example in the chapters on digital photography and on the use of
multi-processing elements), and to enable dynamic and programmable run-time color trans-
forms where needed. In the ICC architecture there is a well-defined baseli ne interpretation of
the color data, while at the same time developers for specific applications and workflows are
free to implement extended functionality in interpreting and applying the transform by adding
features to the CMM.
24.2 Writing Profiles
When a profile is generated, the required elements including text strings and numerical values
are written at specified locations in a file, which is given the extension “.icc” or “.icm.”
Powerful applications that will generate a wide range of profile classes, and guide the user
through the process of obtaining the measurement data needed, are available from ICC
members and liste d on the Profiling Tools page on the ICC web site.
Profiles can al so be written using calls to l ibraryfunctions.Widelyusedexamplesare
the Cþþ libraries SampleICC, lcms, and Argyll, and the routines in Mathworks’ MATLAB
Image Processing Toolbox. Use of these functions requires s ome knowledge of programming
and (in the case of the Cþþ libraries) the use of compilers, aknowledgeofthedatatypesand
encodings used in the specification, knowledge of the color processing models used in the
profile format specification and an understanding of how to characterize a device or data
encoding in order to produce the values required for the color processing elements of the
profile.
188 Profile Construction and Evaluation