Handbook of Plant Nutrition - chapter 2 ppt
Bạn đang xem bản rút gọn của tài liệu. Xem và tải ngay bản đầy đủ của tài liệu tại đây (596.69 KB, 32 trang )
Section II
Essential Elements––Macronutrients
CRC_DK2972_Ch002.qxd 7/5/2006 8:53 AM Page 19
CRC_DK2972_Ch002.qxd 7/5/2006 8:53 AM Page 20
2
Nitrogen
Allen V. Barker
University of Massachusetts, Amherst, Massachusetts
Gretchen M. Bryson
University of Massachusetts, Amherst, Massachusetts
CONTENTS
2.1 Determination of Essentiality 22
2.2 Nitrogen Metabolism and Nitrogenous Constituents in Plants 22
2.2.1 Nitrate Assimilation 23
2.2.1.1 Nitrate Reductase 23
2.2.1.2 Nitrite Reductase 23
2.2.2 Ammonium Assimilation 23
2.2.2.1 Glutamine Synthetase 24
2.2.2.2 Glutamate Synthase 24
2.2.2.3 Glutamic Acid Dehydrogenase 24
2.2.2.4 Transamination 24
2.2.2.5 Amidation 24
2.2.3 Proteins and Other Nitrogenous Compounds 25
2.3 Diagnosis of Nitrogen Status in Plants 26
2.3.1 Symptoms of Deficiency and Excess 26
2.3.2 Concentrations of Nitrogen in Plants 28
2.3.2.1 Concentrations of Nitrogen in Plant Parts 29
2.3.2.2 Ratios of Concentrations of Nitrogen to Other Nutrients in Plants 31
2.4 Nitrogen in Soils 32
2.4.1 Forms of Nitrogen in Soils 32
2.4.1.1 Organic Nitrogen in Soil 33
2.4.1.2 Inorganic Nitrogen in Soil 35
2.5 Soil Testing for Nitrogen 35
2.5.1 Determinations of Total Nitrogen 36
2.5.2 Biological Determinations of Availability Indexes 36
2.5.2.1 Determination of Inorganic Nitrogen 36
2.5.2.1.1 Ammonium 36
2.5.2.1.2 Nitrate 37
2.5.2.1.3 Amino Sugars 38
2.6 Nitrogen Fertilizers 39
2.6.1 Properties and Use of Nitrogen Fertilizers 40
2.6.1.1 Anhydrous Ammonia (82% N) 40
2.6.1.2 Aqua Ammonia (21% N) 40
2.6.1.3 Urea (46% N) 40
21
CRC_DK2972_Ch002.qxd 7/5/2006 8:53 AM Page 21
2.6.1.4 Ammonium Nitrate (34% N) 41
2.6.1.5 Ammonium Sulfate (21% N) 41
2.6.1.6 Nitrogen Solutions (28–32% N) 41
2.6.1.7 Ammonium Phosphates (10–21% N) 42
2.6.1.8 Other Inorganic Nitrogen Fertilizers 42
2.6.1.9 Organic Nitrogen Fertilizers (0.2–15% N) 42
References 43
2.1 DETERMINATION OF ESSENTIALITY
Discovery of the essentiality of nitrogen is often credited to de Saussure (1–3), who in 1804 recog-
nized that nitrogen was a vital constituent of plants, and that nitrogen was obtained mainly from the
soil. De Saussure noted that plants absorb nitrates and other mineral matter from solution, but not
in the proportions in which they were present in solution, and that plants absorbed substances that
were not required for plant growth, even poisonous substances (2). Other scientists of the time
believed that nitrogen in plant nutrition came from the air. The scientists reasoned that if it was pos-
sible for plants to obtain carbon from the air, which is a mere 0.03% carbon dioxide (by volume),
then it would be easy for plants to obtain nitrogen from the air, which is almost 80% nitrogen gas.
Greening was observed in plants that were exposed to low levels of ammonia in air, further sug-
gesting that nitrogen nutrition came from the air. Liebig (1–3) wrote in the 1840s, at the time when
he killed the humus theory (the concept that plants obtain carbon from humus in soil rather than
from the air), that plants require water, carbon dioxide, ammonia, and ash as constituents. Liebig
supported the theory that plants obtained nitrogen as ammonium from the air, and his failure to
include nitrogen in his “patent manure” was a weakness of the product. Plants will absorb ammo-
nia at low concentrations from the air, but most air contains unsubstantial amounts of ammonia
relative to that which is needed for plant nutrition.
The concept that nitrogen was acquired from the air or from soil organic matter was dismissed
in the mid-1800s, as it was shown that crop yields rose as a result of fertilization of soil. Using lab-
oratory methods of de Saussure, Boussingault (1), in field research of 1838, developed balances of
carbon, dry matter, and mineral matter in crops. Boussingault established a special position for
legumes in nitrogen nutrition, a position that Liebig did not support (1). Other research also showed
that different nitrogen fertilizers varied in their effectiveness for supporting crop production, with
potassium nitrate often being a better fertilizer than ammonium salts (1). Microbial transformations
of nitrogen in the soil made it doubtful as to which source was actually the best and which form of
nitrogen entered into plants. Studies made with sterile media and in water culture demonstrated that
plants may utilize nitrate or ammonium and that one or the other might be superior depending on the
species and other conditions. At the time when much of this research was performed, organic fertil-
izers (farm manures) and gas-water (ammonia derived from coal gases) were the only ones that were
cost-effective, considering the value of farm crops and the cost of the fertilizers. With the develop-
ment of the Haber process in 1909 for the synthesis of ammonia from hydrogen and nitrogen gases,
ammonia could be made cheaply, leading to the development of the nitrogen fertilizer industry.
The recognition of the importance of nitrogen in plants predates much of the relatively modern-
day research of de Saussure and others. It was written as early as the 1660s and 1670s (1,3) that
plants benefitted from nitre or saltpeter (potassium nitrate), that plants accumulated nitre, and that the
fertility of the land with respect to nitre affected the quality of crops for storage and yields of sugar.
2.2 NITROGEN METABOLISM AND NITROGENOUS
CONSTITUENTS IN PLANTS
Nitrogen has a wide range of valence states in compounds, which may be used in plant metabolism.
Although some compounds have oxidation–reduction states of ϩ7, as in pernitric acid, plant
22 Handbook of Plant Nutrition
CRC_DK2972_Ch002.qxd 7/5/2006 8:53 AM Page 22
Nitrogen 23
metabolites have oxidation–reduction states ranging from ϩ5 (nitric acid, nitrate) to Ϫ3 (ammonia,
ammonium) (4). Organic, nitrogen-containing compounds are at the oxidation–reduction state of
nitrogen in ammonium (Ϫ3). Biologically important organic molecules in plants include proteins,
nucleic acids, purines, pyrimidines, and coenzymes (vitamins), among many other compounds.
2.2.1 NITRATE ASSIMILATION
Nitrate and ammonium are the major sources of nitrogen for plants. Under normal, aerated condi-
tions in soils, nitrate is the main source of nitrogen. Nitrate is readily mobile in plants and can be
stored in vacuoles, but for nitrate to be used in the synthesis of proteins and other organic com-
pounds in plants, it must be reduced to ammonium. Nitrate reductase converts nitrate into nitrite in
the nonorganelle portions of the cytoplasm (5,6). All living plant cells have the capacity to reduce
nitrate to nitrite, using the energy and reductant (NADH, NADPH) of photosynthesis and respira-
tion in green tissues and of respiration in roots and nongreen tissues (5). Nitrite reductase, which is
located in the chloroplasts, reduces nitrite into ammonium, utilizing the energy and reductant of
photosynthesis (reduced ferredoxin).
2.2.1.1 Nitrate Reductase
Nitrate ϩreduced pyridine nucleotides (NADH, NADPH)
→nitriteϩ oxidized pyridine nucleotides (NAD
ϩ
, NADP
ϩ
)
Nitrate reduction requires molybdenum as a cofactor. A two-electron transfer takes place to reduce
nitrate (N oxidation state, ϩ5) to nitrite (N oxidation state, ϩ3). Respiration is the likely source of
reduced pyridine nucleotides in roots and also, along with photosynthesis, can be a source in shoots.
The conversion of nitrite into ammonia is mediated by nitrite reductase, which is located in the
chloroplasts of green tissues and in the proplastids of roots and nongreen tissues (5,7,8).
2.2.1.2 Nitrite Reductase
Nitrite ϩreduced ferredoxin→ ammoniumϩ oxidized ferredoxin
In leaves, nitrite reduction involves the transfer of six electrons in the transformation of nitrite
to ammonium. No intermediates, such as hyponitrous acid (H
2
N
2
O
2
) or hydroxylamine (HONH
2
),
are released, and the reduction takes place in one transfer. The large transfer of energy and reduc-
ing power required for this reaction is facilitated by the process being located in the chloroplasts
(8). In roots, a ferredoxin-like protein may function, and the energy for producing the reducing
potential is provided by glycolysis or respiration (9,10).
In plants, roots and shoots are capable of nitrate metabolism, and the proportion of nitrate
reduced in roots or shoots depends on plant species and age, nitrogen supply, temperature, and other
environmental factors (11–15).
The assimilation of nitrate is an energy-consuming process, using the equivalent of 15 mol of
adenosine triphosphate (ATP) for each mole of nitrate reduced (16). The assimilation of ammonia
requires an additional five ATP per mole. In roots, as much as 23% of the respiratory energy may be
used in nitrate assimilation compared with 14% for ammonium assimilation (17). However, nitrate
can be stored in cells without toxic effects, but ammonium is toxic at even low concentrations and
must be metabolized into organic combination. Consequently, ammonium metabolism for
detoxification may deplete carbon reserves of plants much more than nitrate accumulation.
2.2.2 AMMONIUM ASSIMILATION
The metabolism of ammonium into amino acids and amides is the main mechanism of assimilation
and detoxification of ammonium. Glutamic acid formation is a port of entry of nitrogen into organic
compounds and occurs in the chloroplasts or mitochondria. Ammonium assimilation in root
CRC_DK2972_Ch002.qxd 7/5/2006 8:53 AM Page 23
mitochondria probably uses ammonium absorbed in high concentrations from nutrient solutions.
One enzyme is involved in ammonium assimilation in mitochondria: glutamic acid dehydrogenase.
Ammonium assimilation in chloroplasts utilizes the ammonium that is formed from the reduction of
nitrite by nitrite reductase and that which is released in photorespiration. Two enzymes are involved
in chloroplasts, glutamine synthetase and glutamate synthase. Glutamine synthetase forms glutamine
from ammonium and glutamate (glutamic acid). Glutamate synthase forms glutamate from gluta-
mine and α-oxoglutarate (α-ketoglutaric acid). These enzymes are also active in roots and nodules
(N
2
fixation). These enzymes assimilate most of the ammonium derived from absorption from dilute
solutions, reduction of nitrate, N
2
fixation, or photorespiration (18–25). Further discussions of glut-
amine synthetase, glutamate synthase, and glutamic acid dehydrogenase follow.
2.2.2.1 Glutamine Synthetase
Ammonium ϩglutamateϩ ATP ϩ reduced ferredoxin→glutamine ϩ oxidized ferredoxin
2.2.2.2 Glutamate Synthase
Glutamine ϩα-oxoglutarate→ 2 glutamate
Sum (or net): Ammonium ϩ α-oxoglutarateϩ ATP ϩ reduced ferredoxin
→glutamateϩ oxidized ferredoxin
Glutamine synthetase has a high affinity for ammonium and thus can assimilate ammonium at
low concentrations, such as those that occur from the reduction of nitrate. If this enzyme is inhib-
ited, however, ammonium may accumulate to phytotoxic levels. Ammonium accumulation to toxic
levels from the inhibition of glutamine synthetase is the mode of action of the herbicide glufosinate
ammonium (26,27).
2.2.2.3 Glutamic Acid Dehydrogenase
Ammonium ϩα-oxoglutarateϩ ATP ϩ reduced pyridine nucleotide (NADH, NADPH)
→glutamateϩ oxidized pyridine nucleotide (NAD
ϩ
, NADP
ϩ
)
Another pathway for ammonium assimilation into organic compounds is by glutamic acid
dehydrogenase, which is located in the mitochondria (28). Glutamic acid dehydrogenase has a low
affinity for ammonium and becomes important in ammonium assimilation at high concentrations of
ammonium and at low pH in growth media (15).
2.2.2.4 Transamination
Glutamate ϩα-oxyacid→α-oxoglutarateϩ α-amino acid
Ammonium that is assimilated into glutamate from mitochondrial or chloroplastic assimila-
tion can be transferred by aminotransferases (transaminases) to an appropriate α-oxyacid (α-
ketoacid) to form an α-amino acid. The transfer can also be to other keto-groups on carbon
chains to form, for example, γ- or δ-amino acids. The keto acids for the synthesis of amino acids
are derived from photosynthesis, glycolysis, and the tricarboxylic acid cycle, among other
processes.
2.2.2.5 Amidation
Glutamate ϩammoniumϩ ATP →glutamineϩ ADP
Amides are formed by the amidation of carboxyl groups. Amides are nitrogen-rich compounds
that can store or transport nitrogen. Common amides are glutamine (5C, 2N) and asparagine
24 Handbook of Plant Nutrition
CRC_DK2972_Ch002.qxd 7/5/2006 8:53 AM Page 24
(4C, 2N). Glutamine is formed from amidation of glutamic acid (glutamate), and asparagine is
formed by amidation of aspartic acid (aspartate). Often, when the external supply of ammonium is
high, asparagine, a metabolite unique to plants, will dominate among the amides, as plants respond
to conserve carbon in the detoxification of ammonium.
2.2.3 PROTEINS AND OTHER NITROGENOUS COMPOUNDS
Unlike animals, plants do not eliminate nitrogen from their bodies but reuse nitrogen from the
cycling of proteins and other nitrogenous constituents. Nitrogen losses from plants occur mainly by
leaching of foliage by rain or mist and by leaf drop (29). Nitrogen in plants is recycled as ammo-
nium. In the case of hydrolysis (breakdown) of proteins, the amino acids of proteins do not accu-
mulate, but rather nitrogen-rich storage compounds (amides, arginine, and others) accumulate as
reserves of nitrogen at the oxidation–reduction level of ammonium. These compounds are formed
from the catabolism of proteins. The carbon and hydrogen of proteins are released as carbon diox-
ide and water. These nitrogen-rich products also accumulate if accumulation of nitrogenous com-
pounds occurs in excess of their conversion into proteins. The amino acids that enter into proteins
are not mingled with the storage reserves or translocated products but are made at the same site
where protein synthesis occurs. The carbon framework (carbon skeletons) remaining after the dona-
tion of nitrogen (ammonium) for amino acid synthesis for incorporation into proteins is metabolized
into carbon dioxide and water. Thus, the products of protein catabolism are ammonium, carbon
dioxide, and water. Protein turnover (breakdown and resynthesis) may occur in plants in a diurnal
cycle, with synthesis occurring in the light and breakdown occurring in the dark, or anabolism and
catabolism of proteins may proceed in different compartments of the same cell at the same time
(29–31). In a 24-h period, one quarter of the protein in a healthy leaf may be newly synthesized as
a result of protein turnover. Most authors indicate a protein turnover of 0.1 to 2% per hour (32,33).
With Lemma minor, Trewavas (34,35) measured turnover rates of 7% per day. In an excised leaf,
protein synthesis does not proceed after protein hydrolysis, and soluble nitrogenous compounds
accumulate. In a nitrogen-deficient plant, the nitrogen will be translocated to a site of need. Also,
under normal conditions, leaves will donate some of their nitrogen in leaf proteins to fruits and
seeds.
Amino acids are assimilated into proteins or other polypeptides (28). Although plants contain
more than 100 amino acids (1,29), only about 20 enter into proteins (Table 2.1). Hydroxyproline
may be formed after incorporation of proline into proteins. Cystine is the dimer of cysteine and is
formed after incorporation of cysteine into protein. Animal proteins occasionally contain amino
acids other than those listed in Table 2.1.
Nitrogen 25
TABLE 2.1
Amino Acids Occurring Regularly in Plant Proteins
Alanine Glutamic acid Leucine Serine
Arginine Glutamine Lysine Threonine
Asparagine Glycine Methionine Tryptophan
Aspartic acid Histidine Phenylalanine Tyrosine
Cysteine Isoleucine Proline Valine
Source: From McKee, H.S., Nitrogen Metabolism in Plants, Oxford
University Press, London, 1962, pp. 1–18 and Steward, F.C. and Durzan,
D.J., in Plant Physiology: A Treatise. Vol IVA: Metabolism: Organic
Nutrition and Nitrogen Metabolism, Academic Press, New York, 1965,
pp. 379–686.
CRC_DK2972_Ch002.qxd 7/5/2006 8:53 AM Page 25
The major portion of nitrogen in plants is in proteins, which contain about 85% of the total
nitrogen in plants (Table 2.2). Nucleic acids (DNA, RNA) contain about 5% of the total nitrogen,
and 5 to 10% of the total nitrogen is in low-molecular-weight, water-soluble, organic compounds
of various kinds (36).
Some of the low-molecular-weight, water-soluble, organic compounds are intermediates in the
metabolism of nitrogen. Some have specific roles in processes other than intermediary metabolism.
Amides and amino acids have roles in transport and storage of nitrogen in addition to their occurrence
in proteins. Ureides (allantoin and allantoic acid) are prominent in xylem sap and transport nitrogen
fixed in root nodules of legumes (15,29). Amines (ethanolamine) and polyamines (putrescine, sper-
mine, spermidine) have been assigned roles or have putative roles in the lipid fraction of membranes,
as protectants, and in processes involved in plant growth and development (15,37–43). Putrescine
accumulation in plants may be a physiological response to stresses such as the form of nitrogen sup-
plied and the nutrient status of plants (39,44–46). Simple nitrogen bases, such as choline, are related
to alkaloids in plants and to lipids (29). Analogs of purines and pyrimidines have functions in growth
regulation (29). Various amino acids other than those in proteins exist in plants. Often, the nonprotein
amino acids are related to those occurring in proteins. β-Alanine, homoserine, and γ-aminobutyric acid
are common examples of these amino acids (1,29). Accumulation of amino acids such as ornithine and
citrulline is generally rare in plants, but they may be the major soluble nitrogenous constituents of
some species (1). Nonprotein amino acids may be natural products or metabolites, but their functions
are generally unclear.
2.3 DIAGNOSIS OF NITROGEN STATUS IN PLANTS
2.3.1 S
YMPTOMS OF DEFICIENCY AND EXCESS
A shortage of nitrogen restricts the growth of all plant organs, roots, stems, leaves, flowers, and
fruits (including seeds). A nitrogen-deficient plant appears stunted because of the restricted growth
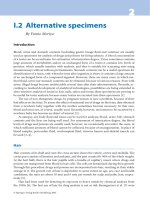
of the vegetative organs. Nitrogen-deficient foliage is a pale color of light green or yellow (Figure
2.1). Loss of green color is uniform across the leaf blade. If a plant has been deficient throughout
its life cycle, the entire plant is pale and stunted or spindly. If the deficiency develops during the
growth cycle, the nitrogen will be mobilized from the lower leaves and translocated to young leaves
causing the lower leaves to become pale colored and, in the case of severe deficiency, to become
brown (firing) and abscise. Until the 1940s crops received little nitrogen fertilizer (a typical appli-
cation of N was 2 or 3 kg/ha), and when the light green color and firing appeared, farmers assumed
that the soil was droughty (47). Sometimes under conditions of sufficiency of nitrogen, leaves, espe-
cially the lower ones, will provide nitrogen to fruits and seeds, and symptoms of deficiency may
develop on the leaves. These symptoms, which develop late in the growing season, may not be evi-
dence of yield-limiting deficiencies but are expressions of transport of nitrogen from old leaves to
26 Handbook of Plant Nutrition
TABLE 2.2
Approximate Fractions and Common Ranges of Concentrations of
Nitrogen-Containing Compounds in Plants
Compound Fraction of Total Nitrogen (%) Concentration (
µµ
g/g Dry Weight)
Proteins 85 10,000 to 40,000
Nucleic acids 5 1000 to 3000
Soluble organic Ͻ5 1000 to 3000
Nitrate Ͻ1 10 to 5000
Ammonium Ͻ0.1 1 to 40
CRC_DK2972_Ch002.qxd 7/5/2006 8:53 AM Page 26
other portions of the plant. For additional information on nitrogen-deficiency symptoms, readers
should consult Cresswell and Weir (48–50), Weir and Cresswell (51,52) or Sprague (53).
At least 25%, more commonly more than 75%, of the nitrogen in leaves is contained in the
chloroplasts (29,54). Most of the nitrogen of chloroplasts is in enzymatic proteins in the stroma and
lamellae. Chlorophyll and proteins exist in lamellae as complexes referred to as chlorophyll pro-
teins or holochromes (55–59). Nitrogen-deficient chloroplasts may be circular in profile rather than
elliptical and may appear swollen. Nitrogen deficiency generally brings about a decrease in protein
in chloroplasts and a degradation of chloroplast fine (lamellar) structure (60). Almost all membra-
nous structure may be disrupted. Grana are often reduced in number or are indistinguishable. The
loss of membranous structures is associated with the loss of proteins (61). A loss of chlorophyll
occurs simultaneously with the loss of membranes and proteins, leading to the loss of green color
from nitrogen-deficient leaves.
The loss of fine structure in chloroplasts during nutrient deficiency is not unique to nitrogen
deficiency. Association of chloroplast aberrations with specific nutritional disorders has been difficult
because of similarities in appearance of nutrient-deficient chloroplasts (62,63). The similarities are
due to the effects that the deficiencies have on protein or chlorophyll synthesis (64,65). Elemental
toxicities can also impart structural changes that resemble elemental deficiencies in chloroplasts (66).
Nitrogen 27
FIGURE 2.1 Photographs of nitrogen deficiency symptoms on (a) corn (Zea mays L.), (b) tomato
(Lycopersicon esculentum Mill.), and (c) parsley (Petroselinum crispum Nym.). (Photographs by Allen V. Barker.)
(For a color presentation of this figure, see the accompanying compact disc.)
CRC_DK2972_Ch002.qxd 7/5/2006 8:53 AM Page 27
2.3.2 CONCENTRATIONS OF NITROGEN IN PLANTS
Many attempts have been made to relate yields of crops to nutrient supply in media and to accu-
mulation in plants. Deficiency of nitrogen or another nutrient is associated with suboptimum devel-
opment of a plant, as reflected by the appearance of symptoms of deficiency, the suppression of
yields, or to the response of plants after the accumulation of the deficient nutrient following its
application as a fertilizer. Plant analysis (tissue testing) is used in the diagnosis of nutritional
deficiency, sufficiency, or excess. Generally, the concentrations of nitrogen in plants reflect the sup-
ply of nitrogen in the root medium, and yields increase as internal concentration of nitrogen in
plants increases. The use of information on internal concentrations of nitrogen in plants should not
be directed toward forecasting of yields as much as it should be used in assessing how yields can
be improved by fertilization.
Various models have been developed to describe the response of plants to nutrient supply and
accumulation (67). Pfeiffer et al. (68) proposed a hyperbolic model in which plants approached an
asymptote or maximum value as nutrient accumulation increased. Linear models have been pro-
posed to describe growth responses to nutrient accumulation (67). Other researchers identified a
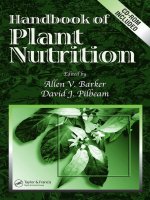
three-phase model (69–71) (Figure 2.2). In this model, growth curves describe a deficient level of
nutrient accumulation, region of poverty adjustment, or minimum percentage where yields rise with
increasing internal concentrations of nitrogen. In the second zone of the growth curve, a transition
from deficiency to sufficiency occurs followed by a region known as luxury consumption in which
internal concentration of nitrogen rises but yield does not rise. The concentration of nitrogen at the
transition from deficiency to sufficiency is known as the critical concentration. Eventually, nitrogen
accumulation will rise to excessive or toxic levels.
Nitrogen concentrations in plants vary with species and with varieties within species (72,73).
Nitrogen accumulation in plants also varies among families. Herbaceous crops from fertilized fields
commonly have concentrations of nitrogen that exceed 3% of the dry mass of mature leaves. Leaves
of grasses (Gramineae, Poaceae) (1.5 to 3.5% N) are typically lower in total nitrogen concentrations
28 Handbook of Plant Nutrition
0
20
40
60
80
100
02 4 6 81012
Concentration of nutrient in tissue
Growth (percent of maximum)
Deficient zone
Transition zone
Critical concentration
Adequate zone
90% of maximum growth
FIGURE 2.2 Model of plant growth response to concentration of nutrients in plant tissue. Units of concen-
tration of nutrient in tissue are arbitrary. The model shows the critical concentration of nutrient at a response
that is 90% of the maximum growth obtained by nutrient accumulation in the tissue. Deficient zone, transition
zone, and adequate zone indicate concentrations at which nutrients may be lacking, marginal, or sufficient for
crop yields.
CRC_DK2972_Ch002.qxd 7/5/2006 8:53 AM Page 28
than those of legumes (Leguminosae, Fabaceae) (Ͼ3% N). Leaves of trees and woody ornamentals
may have Ͻ1.5% N in mature leaves. Genetic differences attributable to species or families are due
to many factors affecting absorption and metabolism of nitrogen and plant growth in general.
The concentrations of nitrogen in leaves, stems, and roots changes during the growing season.
In the early stages of growth, concentrations will be high throughout the plant. As plants mature the
concentrations of nitrogen in these organs fall, and is usually independent of the initial external sup-
ply of nitrogen. Mobilization of nitrogen from old leaves to meristems, young leaves, and fruits
leads to a diminished concentration of nitrogen in old, bottom leaves of plants. Whether a plant is
annual, biennial, or perennial affects considerations of yield relations and the state of nutrient accu-
mulation in organs (leaves) during the season. If the development of a plant is restricted by low lev-
els of external factors, such as other nutrients, water, or temperature, internal concentration of
nitrogen may rise. Root structure and metabolism can lead to differential accumulation of nitrogen.
Assimilation and transport of nitrogenous compounds in plants can lead to differential accumula-
tion among species and within the plants. Nitrogen sources can have large effects on total nitrogen
concentrations in plants. Plants grown on ammonium nutrition can have twice the nitrogen concen-
trations in vegetative parts as plants grown on nitrate nutrition.
The choice of tissue for plant analysis is important in plant diagnosis (Table 2.3). Generally,
leaves are the most satisfactory plant part to use for diagnosis (69,72,74). Blades are used more fre-
quently than leaf petioles or whole leaves. Blades are chosen as the diagnostic part if total nitrogen
is to be assessed, whereas petioles may be selected if the nitrogenous component is soluble, such as
nitrate. Total nitrogen quantity in tissues is the most commonly measured fraction, although some
researchers believe that nitrate contents reflect the nutritional status better than total nitrogen.
2.3.2.1 Concentrations of Nitrogen in Plant Parts
With a nutrient supply in which all elements except nitrogen are held at a constant high level, the con-
centration of nitrogen in a plant will be expected to rise, along with growth and yields, with increases
in nitrogen supply. Nitrogen concentrations in leaves are often not correlated with increased growth
and yields. Shortages of other nutrients or stresses imposed by growth-limiting temperatures or water
supply can cause concentrations of total nitrogen or nitrate to increase, along with a suppression of
yield (75). The age of plant tissues is important in diagnosis of nitrogen sufficiency. In the early stages
of plant growth, the concentration of nitrogen in plants will be higher than at the later stages. Increased
external concentrations of nitrogen will increase the concentration of nitrogen in plant organs, but the
trend is for nitrogen concentrations to fall in leaves, stems, and roots as plants mature. These changes
will vary with whether the plant is annual, biennial, or perennial (67). It is important to sample plants
for nitrogen determinations at a given time of the year or stage of plant development. Some researchers
recommend that samples be taken at a certain time of the day, since light intensity and duration can
Nitrogen 29
TABLE 2.3
Concentrations of Total Nitrogen in Plant Parts
Concentration of Total Nitrogen
(% Dry Weight)
Plant Part Range Optimum
Leaves (blades) 1 to 6 Ͼ3
Stems 1 to 4 Ͼ2
Roots 1 to 3 Ͼ1
Fruits 1 to 6 Ͼ3
Seeds 2 to 7 Ͼ2
CRC_DK2972_Ch002.qxd 7/5/2006 8:53 AM Page 29
30 Handbook of Plant Nutrition
TABLE 2.4
Concentrations of Nitrogen in Leaves of Various Crops Under
Cultivated Conditions
Diagnostic Range (% Dry Mass of Leaves)
Type of Crop Low Sufficiency
a
High
Agronomic Crops
Grass grains Ͻ1.5 1.8 to 3.6 Ͼ3.6
Legume grains Ͻ3.6 3.8 to 5.0 Ͼ5.0
Cotton Ͻ3.0 3.0 to 4.5 Ͼ5.0
Tobacco 4.1 to 5.7 Ͼ5.7
Rapeseed 2.0 to 4.5 Ͼ4.5
Sugarbeet 4.3 to 5.0 Ͼ5.0
Sugarcane Ͻ1 to 1.5 1.5 to 2.7 Ͼ2.7
Bedding Plants 2.8 to 5.6
Trees
Conifers Ͻ1.0 1.0 to 2.3 Ͼ3.0
Broadleaf Ͻ1.7 1.9 to 2.6 Ͼ3.0
Cut Flowers Ͻ3.0 3.1 to 4.7 Ͼ5
Ferns 1.8 to 2.9
Potted Floral 2.5 to 4.2
Forage Crops
Grasses Ͻ1.5 2.0 to 3.2 Ͼ3.6
Legumes Ͻ3.8 3.8 to 4.5 5 to 7
Tree Fruits and Nuts
Nuts Ͻ1.7 2.0 to 2.9 Ͼ3.9
affect the amount of nitrate in tissues (76). Nutrient concentrations in leaves can vary by as much as
40% during a diurnal period (67). Nitrate can vary with time of day, with lower concentrations occur-
ring in the afternoon than in the morning.
Analysis of whole shoots may be the best index of the nutritional status of plants even though
each organ of a plant will vary in nitrogen concentrations. Since organs of plants vary in composi-
tion and since the proportions of organs vary with the nitrogen status of plants, a particular organ of
a plant is usually chosen for analysis. Conducting tissue, such as that of stems or petioles, may pro-
vide the best index of the response of plants to nutrient applications or the best index of the nutrient
status at a given time in growth. Nitrate concentrations in corn (Zea mays L.) stalks are usually sev-
eral times higher than those of leaves (77). Measurement of nitrate in the lower stalk of corn is valu-
able in the diagnosis of the nitrogen status of the crop (78–80). Brouder et al. (79) noted that analysis
of grain for total nitrogen was as good as the stalk test in determining sufficiency or deficiency of
corn. Leaf petioles as conducting tissues are often analyzed to assess the nutritional status of veg-
etable crops (81). Leaves are often taken as samples for nitrogen determinations since they are the
organs of active assimilation and hence likely to be the best for analysis to reflect the nutrient status
of the whole plant. Leaf samples can be taken conveniently in nondestructive harvests of plants, and
leaves can be identified by position or stage of development on plants. Random sampling of leaves
is not as good a technique as sampling based on position on plant, size, and age. Nitrogen is a mobile
element in plants; hence, it moves from lower leaves to upper leaves, and analysis of lower leaves
might be a better index of deficiency than analysis of upper leaves. Sometimes, young leaves or the
first-fully expanded leaves are chosen for analysis because of convenience in identifying the sample
and because the lower leaves might be dead or contaminated with soil. Deficient, sufficient, and high
concentrations of nitrogen in the leaves of plants are reported in Table 2.4.
CRC_DK2972_Ch002.qxd 7/5/2006 8:53 AM Page 30
2.3.2.2 Ratios of Concentrations of Nitrogen to Other Nutrients in Plants
The critical concentration (see Section 2.3.2) of nitrogen is the value in a particular plant part sam-
pled at a given growth stage below which plant growth and yield are suppressed by 5 or 10% (82).
The responses of plants to nutrient additions are essentially independent of the source of nutrients;
hence, the symptoms and nutrient concentrations of affected tissues, and relationships to growth and
yields, are identical regardless of the growth medium or location. Therefore, the critical concentra-
tion is proposed to have universal application to media and geographic locations (82). However,
since leaf (tissue) composition varies with age, the critical concentration can vary and be insensitive
Nitrogen 31
TABLE 2.4 (
Continued
)
Diagnostic Range (% Dry Mass of Leaves)
Type of Crop Low Sufficiency
a
High
Citrus Ͻ2.0 to 2.2 2.3 to 2.9 Ͼ3.3
Pome Ͻ1.5 to 1.8 2.1 to 2.9 Ͼ3.3
Stone Ͻ1.7 to 2.4 2.5 to 3.0 Ͼ3.8
Small Woody Ͻ1.5 1.5 to 2.3 Ͼ4.5
Strawberry Ͻ2.1 2.1 to 4.3 Ͼ4.3
Banana 3.0 to 3.8
Pineapple 1.5 to 2.5
Foliage Plants 2.2 to 3.8
Herbaceous Perennials Ͻ2.2 2.2 to 3.2 Ͼ4.0
Ornamental Grasses Ͻ1.6 1.6 to 2.5 Ͼ3.0
Ground Covers
Herbaceous-broadleaf Ͻ2.0 2.0 to 3.9 Ͼ4.0
Herbaceous-monocot Ͻ1.5 1.6 to 2.4 Ͼ4.0
Woody 1.5 to 2.5
Turfgrasses 2.6 to 3.8
Vegetables
Broadleaf Ͻ2.6 3.5 to 5.1
Sweet corn 2.5 to 3.2
Forest and Landscape Trees Ͻ1.9 1.9 to 2.6
Woody Shrubs
Palms 2.1 to 3.2
Note: Values with few exceptions are mean concentrations in mature leaves. ‘Low’ is value
where symptoms of deficiency are showing. ‘Sufficiency’is mean range of lower and upper
concentrations commonly reported in healthy plants showing no deficiencies. ‘High’ is a
concentration that might represent excessive accumulation of nitrogen.
a
Optimum or sufficient values for maximum yield or for healthy growth of plants will vary
with species, age, and nutrition of plant, position of organ on plant, portion of plant part
sampled, and other factors.
Source: Adapted from Chapman, H.D., Diagnostic Criteria for Plants and Soils,HD
Chapman, Riverside, Cal., 1965, pp. 1–793; Mills, H.A. and Jones, J.B. Jr., Plant Analysis
Handbook II, MicroMacro Publishing, Athens, Ga., 1996, pp. 155–414; Goodall, D.W. and
Gregory, F.G., Chemical composition of plants as an index of their nutritional status,
Technical Communication No. 17, Imperial Bureau of Horticulture and Plantation Crops,
East Malling, Kent, England, 1947, pp. 1–167; Weir, R.G. and Cresswell, G.C., Plant
Nutrient Disorders 1. Temperate and Subtropical Fruit and Nut Crops, Inkata Press,
Melbourne, 1993, pp. 1–93; Weir, R.G. and Cresswell, G.C., Plant Nutrient Disorders 3.
Vegetable Crops, Inkata Press, Melbourne, 1993, pp. 1–104; Walsh, L.M. and Beaton, J.D.,
Soil Testing and Plant Analysis, revised edition, Soil Science Society of America,
Madison, Wis., 1973, pp. 1–491; and from other sources cited in references.
CRC_DK2972_Ch002.qxd 7/5/2006 8:53 AM Page 31
or inflexible to diagnosis of nutrient deficiency (83). For example, if a leaf sample is taken at an
early plant-growth stage, the concentration of nitrogen may exceed the critical concentration that
was determined for tissue at a later stage of growth. Likewise, a sample taken at a late stage of
growth might mistakenly be diagnosed as indicating a deficiency of nitrogen. To deal with the prob-
lem of variable critical concentrations with plant age, several sets of critical values are needed, one
for each growth stage. Determinations of critical concentrations are difficult because of the many
observations that must be made of growth and yield in response to nutrient concentrations in leaves.
Hence, few critical concentrations have been determined at one growth stage, not considering that
multiple stages should be assessed. Applications of sufficiency ranges, such as those reported (Table
2.4), are often too wide to be used for precise diagnoses.
The Diagnostic and Recommendations Integrated System (DRIS) was developed to assess plant
nutrition without regard to variety, age, or position of leaves on plants (83,84). The DRIS method con-
siders nutrient balance and utilizes ratios of nutrient concentrations in leaves to determine the relative
sufficiency of nutrients (85). The DRIS method differs from standard diagnostic methods in the inter-
pretation of analytical results based on the concentrations of individual elements. Instead of consider-
ing each nutrient concentration independently, DRIS evaluates nutrient relationships that involve ratios
between pairs of nutrients and evaluates the adequacy of a nutrient in relation to others. Generation of
the DRIS index yields positive and negative numbers, which are deviations from a norm and which sum
to zero for all nutrients considered. DRIS norms are standard values suggested to have universal appli-
cation to a crop. Norms are determined by research and have been published for several crops (86).
The optimum range for plant DRIS indices is Ϫ15 to 15. If the index is below Ϫ15, that ele-
ment is considered to be deficient. If the index is above 15, that element is considered to be in
excess. DRIS indices must be interpreted in comparison with other nutrients. A negative number
does not indicate that a nutrient is deficient, but it may be used to compare relative deficiencies
among nutrients. DRIS may be useful in identifying hidden hunger or imbalances. For example, if
nitrogen had an index of Ϫ12, phosphorus an index of Ϫ8, and potassium an index of 6, the order
of likely growth-limiting effects would be nitrogenϾ phosphorusϾ potassium. Variations in DRIS
(M-DRIS or modified DRIS) consider dry matter in generation of indices (87,88).
2.4 NITROGEN IN SOILS
2.4.1 F
ORMS OF NITROGEN IN SOILS
The total nitrogen of the Earth is about 1.67 ϫ10
23
g (89,90). Stevenson (89,90) reported that about
98% of the nitrogen of the Earth is in the lithosphere (rocks, soil, coal, sediments, core, sea bottom).
About 2% of the nitrogen is in the atmosphere, with the portions in the hydrosphere and biosphere
being insignificant relative to that in the lithosphere and atmosphere. Most of the nitrogen of the
Earth, including the nitrogen in the rocks and in the atmosphere, is not available for plant nutrition.
The nitrogen in soils, lakes, streams, sea bottoms, and living organisms is only about 0.02% of the
total nitrogen of the Earth (89,90). Plants obtain most of their nitrogen nutrition from the soil. The
nitrogen in the soil is about 2.22 ϫ10
17
g, most of which is in soil organic matter and which is a
negligible component of the total nitrogen content of the world (89,90). Living organisms (bios-
phere) contain about 2.8 ϫ10
17
g of nitrogen. The nitrogen of living organisms and of the soil is in
a constant state of flux, with some forms of nitrogen being readily transformed in this group and
some forms being inactive over a long time (91). Transformations are insignificant in the litho-
sphere and atmosphere. The amount of interchange of nitrogen among the lithosphere (not includ-
ing soil), atmosphere, and living organisms is very small.
The total amount of nitrogen in the soil to the depth of plowing is considerable relative to the
amounts required for crop production, often above 3000 kg/ha but ranging from 1600kg/ha in sands
through 8100 kg/ha in black clay loams to 39,000kg/ha in deep peats (Table 2.5) (92). Note that the
nitrogen in the atmosphere above a hectare of land exceeds 100 million kg at sea level. When land is
32 Handbook of Plant Nutrition
CRC_DK2972_Ch002.qxd 7/5/2006 8:53 AM Page 32
put for crop production, the nitrogen content of soils declines to a new equilibrium value (90,92). Crop
production that relies on the reserves of nitrogen cannot be effective for long, as the reserves become
exhausted. Most plants cannot tap into the large reserve of nitrogen in the atmosphere, although bio-
logical nitrogen fixation is a means of enhancing the nitrogen content of soils. Biological nitrogen
fixation is the principal means of adding nitrogen to the soil from the atmosphere (89). More than 70%
of the atmospheric nitrogen added or returned to soils is by biological fixation, and can exceed 100kg
of nitrogen addition per year by nitrogen-fixing legumes. Most of this nitrogen enters into the organic
fraction of the soils. Unless nitrogen-fixing legumes are grown, the addition of nitrogen to soils by bio-
logical fixation, averaging about 9.2kg/ha annually, is too small to support crop production. The
remainder is from atmospheric precipitation of ammonium, nitrate, nitrite, and organically bound
nitrogen (terrestrial dust). The amount of nitrogen precipitated is normally too small to support crop
production but might be of significance in natural landscapes (90). Virtually no interchange of nitro-
gen occurs between rocks and soils.
2.4.1.1 Organic Nitrogen in Soil
The concentrations of nitrogen range from 0.02% in subsoils to 2.5% in peats (93). Nitrogen con-
centrations in soils generally fall sharply with depth, with most of the nitrogen being in the top one-
meter layer of soils (89). Surface layers (A-horizon, plow-depth zone) of cultivated soils have
between 0.08 and 0.4% nitrogen. Well over 90%, perhaps over 98%, of the nitrogen in the surface
layers (A-horizon, plow-depth zone) of soil is in organic matter (93,94). Since most of the nitrogen
in soil is organic, determination of total nitrogen has been a common method of estimating organic
nitrogen. The Kjeldahl method, a wet digestion procedure (93,95,96), provides a good estimate of
organic, soil nitrogen in surface soils, even though some forms of nitrogen (fixed ammonium,
nitrates, nitrites, some organic forms) are not determined by this analysis. In depths below the
A-horizon or plow zone, although the amounts of total nitrogen are small, inorganic nitrogen, par-
ticularly fixed ammonium, is a high proportion of the total, perhaps 40%, and results from Kjeldahl
analysis should be treated with some caution as this fraction would not be determined (93). The
Dumas method, a dry digestion procedure, is seldom used for determination of nitrogen in soils but
Nitrogen 33
TABLE 2.5
Estimated Content and Release of Nitrogen from
Various Soils
Nitrogen in Soil (kg/ha)
Type of Soil Total
a
Annual Release
b
Sands 1400 28
Yellow sandy loam 2200 44
Brown sandy loam 3100 62
Yellow silt loam 2000 40
Grey silt loam 3600 72
Brown silt loam 5000 100
Black clay loam 7200 144
Deep peats 39,000 780
a
From Schreiner O. and Brown B.E., in United States Department
of Agriculture, Soils and Men, Yearbook of Agriculture, 1938,
United States Government Printing Office, Washington, DC, 1938,
pp. 361–376.
b
Estimated at 2% annual mineralization rate of soil organic matter.
CRC_DK2972_Ch002.qxd 7/5/2006 8:53 AM Page 33
generally gives results in close agreement with Kjeldahl determinations, if certain precautions are
taken in the analysis (93).
Soil organic matter is a complex mixture of compounds in various states of decay or stability (97).
Soil organic matter may be classified into humic and nonhumic fractions, with no sharp demarcation
between the two fractions. The partially decayed or nonhumic portion is the major source of energy
for soil organisms. Depending on the nature of the plant materials, about half of fresh plant residues
added to soil decompose in a few weeks or months (98,99). Humus, or humic substances, are the
degradation products or residues of microbial action on organic matter and are more stable than the
nonhumic substances. Humus is classified into three fractions, humin, humic acids, and fulvic acids,
based on their solubilities. Humin is the highest molecular weight material and is virtually insoluble
in dilute alkali or in acid. Humic acids are alkali-soluble and acid-insoluble. Fulvic acids are alkali-
or acid-soluble. The humic and fulvic fractions are the major portions, perhaps 90%, of the humic soil
organic matter and are the most chemically reactive substances in humus (100). Humus is slow to
mineralize, and unless present in large quantities may contribute little to plant nitrogen nutrition in
most soils. About 60 to 75% of the mineralized nitrogen may be obtained by a crop (99). The turnover
rate of nitrogen in humus may be about 1 to 3% of the total nitrogen of the soil, varying with type
of soil, climate, cultivation, and other factors (93,99). The mineralization rate is likely to be closer to
1% than to 3%. Bremner (96) and Stanford (101) discussed several methods to assess availability of
organic nitrogen in soils. Among these procedures were biochemical methods (estimation of micro-
bial growth, mineral nitrogen formed, or carbon dioxide released) and chemical methods (estimation
of soil total nitrogen, mineral nitrogen, and organic matter and application of various extraction pro-
cedures). The chemical methods are applied more commonly than the biological methods in the esti-
mation of mineralization. Correlation of crop yields to estimations of mineralization generally have
not been satisfactory in the assessment of the potential for soils to supply nitrogen for crop growth.
Most studies on the fractionation of total soil organic matter have dealt with the hydrolysis of
nitrogenous components with hot acids (3 or 6 M hydrochloric acid for 12 to 24h) (Table 2.6). The
fraction that is not hydrolyzed is called the acid-insoluble nitrogen. The acid-soluble nitrogen is
fractionated into ammonium, amino acid, amino sugar, and unidentified components. The origins
and composition of each of the named fractions are not clear. The absolute values vary with soil
type and with cultivation (94). All of these forms of nitrogen, including the acid-stable form, appear
to be biodegradable and, hence, to contribute to plant nutrition (94,102). Organic matter that is held
to clays is recalcitrant to biodegradation and increases in relative abundance in heavily cropped soils
(94,103,104). This fraction may have little importance in nitrogen nutrition of plants.
34 Handbook of Plant Nutrition
TABLE 2.6
Fractions of Nitrogen in Soil Organic Matter
Following Acid Hydrolysis
Fraction of Total Organic
Nitrogen Component Nitrogen (%)
Acid insoluble 20 to 35
Ammonium 20 to 35
Amino acid 30 to 45
Amino sugar 5 to 10
Unidentified 10 to 20
Source: From Bremner, J.M., in Soil Nitrogen, American Society of
Agronomy, Madison, Wis., 1965, pp. 1324–1345 and Stevenson,
F.J., Nitrogen in Agricultural Soils, American Society of Agronomy,
Madison, Wis., 1982, pp. 67–122.
CRC_DK2972_Ch002.qxd 7/5/2006 8:53 AM Page 34
Cultivation reduces the total amount of organic matter in soils but has little effect on the rela-
tive distribution of the organic fractions in soils, suggesting that the results of acid hydrolysis are of
little value as soil tests for available nitrogen or for predicting crop yields (94). Humic substances
contain about the same forms of nitrogen that are obtained from the acid hydrolysis of soils but per-
haps in different distribution patterns (94). Agricultural systems that depend on soil reserves do not
remain productive without the input of fertilizer nitrogen.
2.4.1.2 Inorganic Nitrogen in Soil
Soil inorganic nitrogen is commonly less than 2% of the total nitrogen of surface soils and under-
goes rapid changes in composition and quantity. Inorganic nitrogen varies widely among soils, with
climate, and with weather. In humid, temperate zones, soil inorganic nitrogen in surface soil is
expected to be low in winter, to increase in spring and summer, and to decrease with fall rains,
which move the soluble nitrogen into the depths of the soil (105). Despite being small in magni-
tude, the inorganic fraction is the source of nitrogen nutrition for plants. Unless supplied by fertil-
izers, inorganic nitrogen in soil is derived from the soil organic matter, which serves as a reserve of
nitrogen for plant nutrition. Plant-available nitrogen is released from organic matter by mineraliza-
tion and is transformed back into organic matter (microbial cells) by immobilization. Absorption by
plants is the chief means of removal of inorganic nitrogen from soils, although nitrate leaching and
denitrification, ammonium volatilization and fixation, and nitrogen immobilization lead to losses of
inorganic nitrogen from soils or from the soil solution (105).
Detectable inorganic nitrogen forms in soil are nitrate, nitrite, exchangeable and fixed ammo-
nium, nitrogen (N
2
) gas, and nitrous oxide (N
2
O gas) (106). Nitrate and exchangeable ammonium
are important in plant nutrition. The other forms are generally not available for plant nutrition. Fixed
ammonium, entrapped in clays, is a principal nitrogenous constituent of subsoils and is probably
derived from parent rock materials; however, the fixed ammonium in surface soils may be of recent
origin from organic matter (106). Fixed ammonium is resistant to removal from clay lattices and
has little importance in plant nutrition. The gaseous constituents diffuse from the atmosphere or
arise from denitrification and have no role in plant nutrition, other than in considerations of losses
of nitrogen from soils (107).
Exchangeable or dissolved ammonium is available to plants, but ammonium concentrations in
soils are low, usually in a magnitude of a few mg/kg or kg/ha. In well-aerated soils, ammonium is
oxidized rapidly to nitrate by nitrification, so that nitrate is the major source of plant-available nitro-
gen in soil (108,109). Nitrite, an intermediate in nitrification, is oxidized more rapidly than ammo-
nium (109). Hence, little ammonium or nitrite accumulates in most soils. Ammonium and nitrite are
toxic to most plants (110). Toxicity of ammonium or nitrite might occur if the concentration of
either rises above 50 mg N/kg in soil or in other media, especially if either is the principal source
of nitrogen for plant nutrition (110,111). Nitrification is sensitive to soil acidity and is likely to be
inhibited in soils under pH 5; this acidity may lead to ammonium accumulation (108).
2.5 SOIL TESTING FOR NITROGEN
Testing for plant-available soil nitrogen is difficult. This difficulty arises in part because most of
the nitrogen in soil is in organic forms, which have varying rates of microbial transformation into
available forms. Also, nitrate, the main form of plant-available nitrogen, is subject to leaching,
denitrification, and immobilization. Many attempts have been made to develop availability indexes
for release of nitrogen from organic matter and to correlate yields with tests for inorganic nitrogen
in soils (93,101,112–114). Biological tests are time consuming and may give variable results if the
methodology is not standardized among researchers. Chemical tests for estimating plant-available
nitrogen have been empirical in approach and have had low correlations with production of min-
eral nitrogen and crop accumulation of nitrogen.
Nitrogen 35
CRC_DK2972_Ch002.qxd 7/5/2006 8:53 AM Page 35
2.5.1 DETERMINATIONS OF TOTAL NITROGEN
The determination of nitrogen by the Kjeldahl method gives an estimation of the total nitrogen in
soils (93,113). This test, often considered a chemical index, is essentially a test for total soil organic
matter, since the nitrogen concentration of soil organic matter is relatively constant. This measure-
ment does not estimate the rates of transformations of organic nitrogen into inorganic forms that are
available for plants; hence, many irregularities in predicting available nitrogen occur in its use.
However, considering that transformations depend on the type of organic matter, temperature, aer-
ation, water supply, acidity, and other factors, total nitrogen is likely as informative as determina-
tion of other availability indexes. Nevertheless, determinations of availability indexes have been
investigated extensively (96).
2.5.2 BIOLOGICAL DETERMINATIONS OF AVAILABILITY INDEXES
Aerobic incubation of soil samples for 2 to 4 weeks under nearly optimum conditions of microbial
decomposition of organic matter and measurements of nitrogen mineralization is an extensively
employed biological procedure for the development of an availability index (96,101,112–114).
Incubated samples are tested for the amounts of nitrate, ammonium, or both forms released. Since
determinations are run under nearly optimum conditions, only an estimate of the potential for min-
eralization is provided. Results may differ from mineralization in a field in a particular year.
Determinations of indexes by anaerobic incubation involve estimations of ammonium released
(115). Other biological tests involve bioassays of microbial growth or pigment production (116),
chlorophyll production by algae (117), and carbon dioxide production (118).
2.5.2.1 Determination of Inorganic Nitrogen
These determinations are considered to be chemical indexes of availability of nitrogen soil organic
matter. The utility of chemical indexes depends on their correlation for a broad range of soils with bio-
logical criteria, such as crop yields, nitrogen accumulation in plants, and biological indexes (101).
Inorganic nitrogen is determined in an extraction of soil with water or solutions of acids, bases, chelat-
ing agents, or salts at differing concentrations and temperatures (101). Severe extractants, such as
moderately concentrated (4.5 to 6 M) boiling mineral acids or bases, generally give nitrogen releases
that correlate well with total soil nitrogen. However, total soil nitrogen as such is not a reliable index
of nitrogen availability in soils. Also, release of nitrogen by moderate extraction procedures, such as
alkaline permanganate, sodium carbonate, and molar solutions of mineral acids and bases, generally
are poorly correlated with biological measurements (96,101). Relatively mild extractions with cold,
hot, or boiling water or solutions of cold dilute (0.01 M) acids, bases, or salts have been used with the
premise that these methods determine nitrogen of which a high proportion is derived from microbial
action on the soils (101). Ammonium or nitrate may be determined in the extracts (96,105,106).
2.5.2.1.1 Ammonium
The rate-controlling step in nitrogen mineralization is the conversion of organic nitrogen into
ammonium. The conversion of ammonium into nitrate is a rapid step, as a result ammonium gener-
ally does not accumulate in well-drained mineral soils. Ammonium in soil, initially present in soils
at sampling, is correlated weakly with nitrogen accumulation in plants (113). Temperatures in han-
dling and storage of soil samples are important in judging the correlation between ammonium in
soils and accumulation in plants (119). Waterlogging, high acidity (pH Ͻ5.0) or alkalinity
(pH Ͼ8.0), or use of nitrification inhibitors can lead to mineralization that stops with the formation
of ammonium and hence to accumulation beyond that occurring in well-drained, mineral soils.
Determination of ammonium present in soil without any manipulation generally gives better corre-
lations with biological processes than the correlation of ammonium that accumulates with manipu-
lation of processes that lead to ammonium accumulation.
36 Handbook of Plant Nutrition
CRC_DK2972_Ch002.qxd 7/5/2006 8:53 AM Page 36
2.5.2.1.2 Nitrate
Nitrate is the form of nitrogen that is used most commonly by plants and that may accumulate in
agricultural soils. In combination with other factors, such as soil water, nitrate concentrations in
soils have been used in assessments of soil fertility since the early 1900s (113,120–122). Ozus and
Hanway (123) reported that nitrogen accumulation in crops during early growth was related to
nitrate content in soils. Early workers related nitrate in soils to crop yields. Nitrate in soil was shown
to be a reliable evaluation of soil nitrogen that is residual from previous fertilization (124–126).
Recent work has related tests for nitrate in soils to prediction of the needs of crops for nitrogen fer-
tilization. These tests are commonly called preplant nitrate tests and are conducted in the early
spring to a soil-sampling depth of 60, 90, 120 cm, or greater.
Nitrate is a soluble form of nitrogen that is subject to downward movement in soils in humid
temperate climates (105). Sometimes, soil tests for nitrate in the top 15 or 30 cm of soils have not
been well correlated with crop yields because of depletion of nitrate in these zones by leaching in
humid regions (113). Good correlations between soil nitrate tests and crop yields have been noted
with soil samples taken from 120- to 180-cm depth in the profile. Roth and Fox (125) reported
nitrate concentrations that ranged from 36 to 295 kg N/ha in the 120-cm profile following the har-
vest of corn. Soils fertilized with nitrogen applied at economiclly optimum amounts had nitrate con-
centrations ranging from 41 to 138 kg N/ha. Soils with more than 169kg nitrate-N/ha in the 120-cm
profile did not show an increase in corn yields in response to nitrogen fertilization. Jokela and
Randall (124) reported that nitrate concentrations in a 150-cm profile ranged from 150 to 500 kg
N/ha over a range of fertilizer treatments after corn harvest in the fall but fell by 50 to 70% by the
following spring.
Nitrate concentrations vary among soils and among seasons of the year for a given soil and cli-
mate (105,127). In humid temperate climatic areas, nitrate in soils is low in the cold of winter, rises
in spring and through the summer with warming of soils and falls in the fall with the rains. In unfer-
tilized fields in the winter, nitrate in topsoil (top 30 to 60 cm) is less than 5 or 10mg N/kg (105).
The concentration can rise to 40 to 60 mg nitrate-N/kg in spring and summer. Depending on the per-
meability of soil, the depletion of nitrate from topsoil can be rapid with fall rains. Tillage of land
can bring about an increase of nitrate, as mineralization and nitrification are increased by aeration
of the soil due to tillage. Generally, the more intensive the tillage, the greater the nitrate concentra-
tions in the soil (128–130). For example, in the 120-cm-deep soil profile, following a crop of corn,
the nitrate in conventionally tilled soils (100 to 120kg N/ha) was twice that in the profile of soils
cropped in a no-tillage system (129). In dry seasons, soil nitrate can be very low due to low micro-
biological activity, perhaps less than 10 mg N/kg, but increases as rain falls and mineralization and
nitrification result in the wetted soil. In some cases, if the subsoil contains nitrate, nitrate may rise
with capillary action and accumulate in dry surface soils. Absorption by plants is a principal path
of removal of nitrate from soils. Removal is unique with various soils and crops (105). Perennial
crops having a developed root system can absorb nitrate as soon as conditions are favorable for
plant growth. Grassland soils generally are low in nitrate throughout the year. However, annual
crops do not absorb much nitrate from soils until the root systems are developed.
Many soil test recommendations for correlation of soil nitrate with crop yields require soil sam-
pling to a minimum depth of 60 cm (113). Sampling to this depth involves considerable costs, and
attempts have been made to develop a test based on shallower sampling. Alvarez et al. (131) devel-
oped prediction equations that related nitrate in the top 30 cm stratum to that in the top 60cm stra-
tum. Recent research has shown good correlations between crop yields and concentrations of nitrate
in the surface 30 cm layer of soils early in the growing season (132–135). Determination of the
amount of nitrate in the upper stratum of soil early in the season has led to the development of a test
called the early season nitrate test or pre-sidedress soil nitrate test (PSNT).
The basis of the PSNT is the concentration of nitrate in the surface 30 cm of soils at the time
that a crop starts rapid growth, for example, when corn is 30 cm tall (133,134). The amount of
nitrate in the soil at this depth at this time is an assessment of the amount of nitrogen available for
Nitrogen 37
CRC_DK2972_Ch002.qxd 7/5/2006 8:53 AM Page 37
crop growth for the remainder of the season and of the need for nitrogen fertilization. The criti-
cal concentration of soil nitrate for the PSNT is the concentration above which yields are not
expected to increase with additional nitrogen fertilization. For corn production, Sims et al. (135)
in Delaware reported that the PSNT test identified nitrogen-deficient or nitrogen-sufficient sites
with about 70% success. Binford et al. (132) in Iowa determined that the critical concentration of
nitrate for corn was 23 to 26 mg N/kg f or a 30 cm depth. Sampling 60cm deep improved cor-
relations between corn grain yields and soil nitrate, but it was felt that the improvement did not
justify the additional costs of deep sampling. The critical concentration for the 60cm depth was
16 to 19 mg N/kg soil. Other research has given similar results. Meisinger et al. (136) in Maryland
determined a critical nitrate concentration of 22 mg N/kg with the PSNT successfully identifying
nitrogen-sufficient sites across a range of textures, drainage classes, and years. Including ammo-
nium in the analysis slightly improved the predictive use of the test (136). Heckman et al. (137) in
New Jersey reported a critical nitrate concentration at the 30 cm depth to be 22 mg N/kg for corn.
Evanylo and Alley (138) in Virginia reported critical nitrate concentrations of 18 mg N/kg for corn
and noted that the PSNT was applicable to soils without regard to texture or physiographic region.
Also for corn, Sainz-Rozas et al. (139) in Argentina reported a critical nitrate concentration of 17
to 27 mg N/kg at the 30cm depth. They also reported that there was no improvement in reliability
if the test was done on samples to 60 cm depth or with the inclusion of ammonium in the deter-
minations. Critical concentrations, similar in magnitude to those for corn have been reported for
sweet corn (Zea mays rugosa Bonaf.) (140), lettuce (Lactuca sativa L.), celery (Apium graveolens
dulce Pers.) (141), cabbage (Brassica oleracea capitata L.) (142), and tomato (Lycopersicon
esculentum Mill.) (143).
If the concentration of nitrate is below the critical concentration, fertilization of the crops is
necessary. However, the need to collect soil samples during the growing season has limited the
usage of the PSNT. Fertilization is delayed until the results of the PSNT are obtained, and bad
weather can delay applications of nitrogen.
2.5.2.1.3 Amino Sugars
Fractionation of soil hydrolysates has been used to determine a labile pool of organic nitrogen in
soil and to relate this fraction to crop responses to nitrogen fertilizers (102,144). The results of most
of these studies have shown little variation among soil types or cultivation patterns in the partition-
ing of hydrolyzable soil nitrogen into various nitrogenous components and the capacity of soil
organic matter to form nitrate. The uniformity among soils was attributed in part to errors in analy-
sis (145,146). Mulvaney and Khan (147) developed a diffusion method for accurately determining
amino sugar nitrogen in soil hydrolysates. Mulvaney et al. (145) noted that hydrolysates (6 M HCl)
of soils in which crops were nonresponsive to nitrogen fertilization had higher concentrations
of amino sugars (e.g., glucosamine, galactosamine, mannosamine, muramic acid) than did
hydrolysates of soils in which crops responded to nitrogen fertilization. They reported no consistent
differences among the total nitrogen, the ammonium nitrogen, or the amino acid nitrogen fraction
of the soil hydrolysate. The amounts of amino sugars were related to mineralization of soil organic
nitrogen, since production of inorganic nitrogen upon aerobic incubation of the nonresponsive soils
was much greater than that in the responsive soils (145). Concentrations of amino sugars were cor-
related with response to fertilizer nitrogen applied. Mulvaney et al. (145) classified soils with more
than 250 mg amino sugar nitrogen per kg as being nonresponsive and those with less than 200 mg
amino sugar nitrogen per kg as being responsive to nitrogen fertilization. Khan et al. (146) devel-
oped a simpler test for determining amino sugar nitrogen than the processes involving soil hydrol-
ysis. The simpler test involved soil being treated with base (2 M NaOH), followed by heating (50ЊC)
to release ammonia, and then determining the amount of ammonia releases by volumetric methods.
This method determined ammonium and amino sugar nitrogen without liberating substantial nitro-
gen from amino acids and none from nitrate or nitrite. Test values for soils nonresponsive to nitro-
gen fertilization were 237 to 435 mg N/kg and for responsive soils were 72 to 223 mg N/kg soil.
38 Handbook of Plant Nutrition
CRC_DK2972_Ch002.qxd 7/5/2006 8:53 AM Page 38
Amino sugars may constitute 5 or 6% of the humic substances in soils (148). Variations in kind and
amount of amino sugars have been noted with climate and with cultivation of soils (149,150).
2.6 NITROGEN FERTILIZERS
Soils have little capacity to retain oxidized forms of nitrogen, and ammonium accumulation in soils is
small; consequently, most of the soil nitrogen is associated with organic matter. Release of nitrogen
from organic matter is slow and unpredictable. If soil organic matter is depleted, as occurs in cultivated
soils, nitrogen for plant growth is limited. Nitrogen is usually the most deficient nutrient in cultivated
soils of the world, and fertilization of these soils with nitrogen is required. To maintain or increase pro-
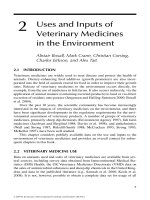
ductivity of soils, worldwide consumption of nitrogen fertilizers continues to increase with time
(Figure 2.3). However, the consumption of phosphorus and potassium fertilizers has leveled.
Anhydrous ammonia (NH
3
gas) is the starting product for manufacture of most nitrogen fertil-
izers. Anhydrous ammonia is manufactured from hydrogen and nitrogen gases by the Haber process
(Haber–Bosch process). The reaction is performed at high temperature (400 to 500ЊC) and high
pressure (300 to 1000 atm) in the presence of a catalyst (iron or other metal) (151–153). The nitro-
gen gas is obtained from the air, which is about 79% nitrogen by volume, and the hydrogen is
obtained from natural gas (methane), oil, coal, water, or other sources.
Jones (152) and Moldovan et al. (154) describe the production of other nitrogen fertilizers from
ammonia. A brief summary of these processes follows. Nitric acid, produced from ammonia, is
another basic material in the manufacture of nitrogen fertilizers. To produce nitric acid, compressed
ammonia and air are heated in the presence of a catalyst and steam. The nitric acid can be reacted
with ammonia to produce ammonium nitrate. Sodium nitrate is the product of the reaction of nitric
acid with sodium bicarbonate. Sodium nitrate also is produced from caliche (Chilean saltpeter),
which is a mineral that contains sodium nitrate and various salts of sodium, calcium, potassium, and
magnesium. Sodium nitrate, sometimes called Chilean nitrate, is one of the earliest commercial
nitrogen fertilizers marketed. Until 1929, all of the sodium nitrate marketed was extracted from
Chilean saltpeter (154). Urea is manufactured chiefly by combining ammonia with carbon dioxide
under high pressure. Ammonium sulfate is manufactured by the reaction of ammonia with sulfuric
acid, gypsum, or sulfur dioxide.
The merits of nitrate and ammonium fertilizers have been researched and reviewed extensively
(155–166). Many manufactured fertilizers and most organic fertilizers are ammonical; however, the
ammonium that is inherent in the fertilizer or that is released upon contact with soils is soon oxidized
to nitrate, unless nitrification is inhibited (167–171). Nitrification inhibitors may be employed with
ammoniacal fertilizers to restrict losses of nitrogen from soils by leaching or denitrification.
Nitrogen 39
1960 1970 1980 1990 200
0
0
20
40
60
80
100
Fertilizer usage (1000 Mg)
N
P
2
O
5
K
2
O
FIGURE 2.3 Worldwide consumption of nitrogen, phosphorus, and potassium in fertilizers for the period
1960–2000. Units of Mg are 1000 kg or one metric ton. (Adapted from />indicators/tablen.asp.)
CRC_DK2972_Ch002.qxd 7/5/2006 8:53 AM Page 39
2.6.1 PROPERTIES AND USE OF NITROGEN FERTILIZERS
The nitrogen concentrations of the following fertilizers have been rounded to values of commonly
marketed grades.
2.6.1.1 Anhydrous Ammonia (82% N)
Anhydrous ammonia is the most-used nitrogen-containing fertilizer for direct application to land in
the United States (152). Worldwide, consumption of anhydrous ammonia is ranked fourth or fifth
among nitrogen fertilizers (Table 2.7). In agriculture, anhydrous gaseous ammonia is compressed
into a liquid and is applied under high pressure with a special implement by injection at least 15 cm
deep into a moist soil. The ammonia gas reacts with water to form ammonium ions, which can be
held to clay or organic matter. If the ammonia is not injected deeply enough or soil is too wet or dry,
ammonia can be lost by volatilization. Anhydrous ammonia is usually the cheapest source of nitro-
gen, but equipment and power requirements of the methods of application are specific and high.
2.6.1.2 Aqua Ammonia (21% N)
Aqua ammonia is ammonia dissolved in water under low pressure. Aqua ammonia must be incor-
porated into land to avoid losses of nitrogen by ammonia volatilization; however, it needs not be
incorporated as deeply as anhydrous ammonia.
2.6.1.3 Urea (46% N)
Urea is the most widely used dry nitrogen fertilizer in the world (Table 2.7). After application to soils,
urea is converted into ammonia, which can be held in the soil or converted into nitrate. Ammonia
volatilization following fertilization with urea can be substantial, and if urea is applied to the surface
40 Handbook of Plant Nutrition
TABLE 2.7
Worldwide Nitrogen Fertilizer Consumption in the
Year 2000
Nitrogen Fertilizer Usage
Nitrogen Fertilizer (Metric Tons)
Straight N Fertilizer
Urea 41042
Ammonium nitrate 5319
Calcium ammonium nitrate 4768
N solutions 3812
Anhydrous ammonia 3581
Ammonium sulfate 2738
Other 7907
Total straight 69168
Mixed N Fertilizer
NPK-N 6347
Ammonium phosphate 4631
Other NP-N 1656
NK-N 74
Total mixed 12708
Total N fertilizer 81880
Source: Compiled from />CRC_DK2972_Ch002.qxd 7/5/2006 8:53 AM Page 40
of the land, considerable loss of nitrogen can occur (172,173). Hydrolysis of urea by urease produces
ammonium carbonate. With surface-applied urea, alkalinity of pH 9 or higher can develop under the
urea granule or pellet, and ammonia will volatilize into the air. Volatilization occurs on bare ground,
on debris, or on plant leaves. Urea is readily soluble in water, and rainfall or irrigation after its appli-
cation move it into the soil and lessens volatilization losses. Use of urease inhibitors has been sug-
gested to lessen the volatilization losses of ammonia from surface-applied urea (174). Manufactured
urea is identical to urea in animal urine.
Calcium nitrate urea (calurea, 34% N, 10% Ca) is a double-compound fertilizer of calcium
nitrate and urea to supply calcium and nitrogen (152).
Several derivatives of urea are marketed as slow-release fertilizers (175,176). Urea formaldehyde
(ureaform, 38% N) is a slow-release fertilizer manufactured from urea and formaldehyde and is used
for fertilization of lawns, turf, container-grown plants, and field crops (177–180). Urea formaldehyde
is also a glue and is used for the manufacture of plywood and particle board (181,182). Dicyandiamide
(cyanoguanidine) (66% N) is a nitrogen fertilizer but is used most commonly as an additive (2% of
the total N fertilizer) as a nitrification inhibitor with urea (153,183–185). Sulfur-coated urea (186,187)
is a slow-release formulation (30–40% N) used as a fertilizer for field crops, orchards, and turfgrass
(175,177,188–191).
Isobutylidene diurea (IBDU) is similar to urea formaldehyde, but contains 32% nitrogen. However,
utilization of IBDU is less dependent on microbial activity than urea formaldehyde, as hydrolysis pro-
ceeds rapidly following dissolution of IBDU in water (175). Nitrogen is released when soil moisture is
adequate. IBDU is used most widely as a lawn fertilizer (176,192). Its field use is to restrict leaching of
nitrogen (181).
Methylene ureas are a class of sparingly soluble products, which were developed during the
1960s and 1970s. These products contain predominantly intermediate chain-length polymers. The
total nitrogen content of these polymers is 39 to 40%, with between 25 and 60% of the nitrogen
present as cold-water-insoluble nitrogen. This fertilizer is used primarily in fertilization of turfgrass,
although it has been used with other crops on sandy soils or where leaching of nitrate is an envi-
ronmental concern (176,191,193).
2.6.1.4 Ammonium Nitrate (34% N)
Ammonium nitrate is a dry material sold in granular or prilled form. It can be broadcasted or side-
dressed to crops and can be left on the surface or incorporated. It does not give an alkaline reaction
with soils; hence, it does not volatilize readily. However, incorporation is recommended with cal-
careous soils. Ammonium nitrate is decreasing in popularity because of storage problems, e.g., with
fire and explosion.
Calcium ammonium nitrate (ammonium nitrate limestone, about 20% N and 6% Ca) is a mix-
ture of ammonium nitrate and limestone. This fertilizer is not acid-forming and is used to supply
nitrogen and calcium to crops (152).
2.6.1.5 Ammonium Sulfate (21% N)
Ammonium sulfate is marketed as a dry crystalline material. It is recommended for use on alkaline soils
where it may be desirable to lower soil pH. Nitrification of ammonium is an acidifying process.
Ammonium sulfate can be broadcasted or sidedressed. It can left on surfaces or incorporated, although
on calcareous soils watering in or incorporating is recommended to avoid ammonia volatilization (176).
2.6.1.6 Nitrogen Solutions (28–32% N)
These fertilizers are mixtures of ammonium nitrate and urea dissolved in water. In the solutions,
half of the nitrogen is supplied as urea, and half is supplied as ammonium nitrate. Because of the
difficulties in handling, urea and ammonium nitrate should not be mixed together in dry form. The
Nitrogen 41
CRC_DK2972_Ch002.qxd 7/5/2006 8:53 AM Page 41
solution acts once the dry materials are applied to the soil. Ammonia volatilization may be sub-
stantial during warm weather, especially with surface application. The solutions should be watered
into the soil and should not be applied to foliage.
2.6.1.7 Ammonium Phosphates (10–21% N)
Ammonium phosphates are important phosphorus-containing fertilizers because of their high con-
centrations of phosphorus and water solubility. Diammonium phosphate (commonly 18% N, 46%
P
2
O
5
) is a dry granular or crystalline material. It is a soil-acidifying fertilizer and is useful on calcare-
ous soils. It should be incorporated into the soil. It is a common starter fertilizer and is a common com-
ponent of greenhouse and household fertilizers. Monoammonium phosphate (commonly 11% N, 48%
P
2
O
5
) has uses similar to those of diammonium phosphate. Ammonium polyphosphate (10% N, 34%
P
2
O
5
) is marketed as a solution. Its use is similar to that of monoammonium phosphate and diammo-
nium phosphate. Ammonium phosphates are made by reaction of ammonia with orthophosphoric acid
(mono- and diammonium salts) or with superphosphoric (pyrophosphoric) acid (152).
2.6.1.8 Other Inorganic Nitrogen Fertilizers
Many other nitrogen-containing fertilizers include double-salt mixtures such as ammonium nitrate
sulfate (30% N), ammonium phosphate nitrate (25% N), urea ammonium phosphate (25–34% N),
nitric phosphate, and ammoniated superphosphate (8% N) (152). These materials are used in the
manufacture of mixed N-P-K fertilizers or for special needs in soil fertility.
2.6.1.9 Organic Nitrogen Fertilizers (0.2–15% N)
Although naturally occurring, sodium nitrate may not be recognized as an organic fertilizer.
Most organic fertilizers are derived from plant and animal sources and are proteinaceous
42 Handbook of Plant Nutrition
TABLE 2.8
Representative Nitrogen Concentrations and Mineralization
of Some Organic Fertilizers
Fertilizer % N (Dry Mass)
a
Mineralization
b
Feather meal, hair, wool, silk 15 Moderate–Rapid
Dried blood, blood meal 12 Rapid
Fish scrap (dry) 9 Moderate–Rapid
Tankage, animal 8 Moderate–Rapid
Seed meals
c
6 Rapid
Poultry manure 2–3 Moderate–Rapid
Livestock manure 1–2 Slow
Sewage biosolids 1–4 Slow
Bone meal, steamed 1 Moderate–Rapid
Kelp 0.7 Slow
Compost 0.5–1 Slow
a
Concentrations will vary from these representative values, depending on the han-
dling of the products, nutrition of livestock, and source of materials.
b
Mineralization rate will vary with the products. Rapid mineralization is more than
70% of the organic N expected to be mineralized in a growing season; moderate is
50 to 70% mineralization; and slow is less than 50% mineralization.
c
Includes by-products such as cottonseed meal, soybean meal, linseed meal, corn
gluten meal, and castor pomace.
CRC_DK2972_Ch002.qxd 7/5/2006 8:53 AM Page 42
materials. The fertilizer industry started with meat and other food processors, who wanted to
dispose of and find a use for wastes and by-products (152,194). Around 1900, about 90% of
nitrogen fertilizer was derived from proteinaceous wastes and by-products, but today usage has
declined to less than 1%. Organic materials range from less than 1 to about 15% N compared
with the chemical sources described above, which range upward to over 80% N. Costs of han-
dling, shipping, and spreading of the bulky, low-analysis organic materials have led to their
decline in usage with time. Also, many of the proteinaceous by-products of food processing
have higher value as feeds for poultry and livestock than as fertilizers (194,152). Nevertheless,
demand for organic fertilizers remains, as organic farmers require these products in the mainte-
nance of soil fertility on their cropland (195).
The value of organic nitrogen fertilizers depends on their rate of mineralization, which
is closely related to their nitrogen concentration (152,195,196). Generally, the more nitrogen
in the fertilizer, the faster the rate of mineralization. Some common organic fertilizers are listed in
Table 2.8.
REFERENCES
1. H.S. McKee. Nitrogen Metabolism in Plants. London: Oxford University Press, 1962, pp. 1–18.
2. H.S. Reed. A Short History of the Plant Sciences. Waltham, Mass.: Chronica Botanica Co., 1942, pp.
241–254.
3. E.W. Russell. Soil Conditions and Plant Growth. 9th ed. New York: Wiley, 1973, pp. 1–23.
4. D.J.D. Nicholas. Inorganic nutrition of microorganisms. In: F.C. Steward, ed. Plant Physiology: A
Treatise Vol. III. New York: Academic Press, 1963, pp. 363–447.
5. L.H. Beevers, R.H. Hageman. Nitrate reduction in higher plants. Annu. Rev. Plant Physiol.
20:495–522, 1969.
6. H.J. Evans, A. Nason. Pyridine nucleotide nitrate reduction from extracts of higher plants. Plant
Physiol. 28:233–254, 1953.
7. B.J. Miflin. The location of nitrate reductase and other enzymes related to amino acid biosynthesis in
the plastids of roots and leaves. Plant Physiol. 54:550–555, 1974.
8. A. Oaks, B. Hirel. Nitrogen metabolism in roots. Annu. Rev. Plant Physiol. 36:345–365, 1985.
9. C.G. Bowsher, D.P. Hucklesby, M.J. Emes. Nitrite reduction and carbohydrate metabolism in plastids
purified from roots. Planta 177:359–366, 1989.
10. L.P. Solomonson, M.J. Barber. Assimilatory nitrate reductase: functional properties and regulation.
Annu. Rev. Plant Physiol. Plant Mol. Biol. 41:225–253, 1990.
11. M. Andrews. Partitioning of nitrate assimilation between root and shoot of higher plants. Plant Cell
Environ. 9:511–519, 1986.
12. M. Andrews. Nitrate and reduced-N concentrations in the xylem sap of Stellaria media, Xanthium
strumarium and six legume species. Plant Cell Environ. 9:605–608, 1986.
13. M. Andrews, J.D. Morton, M. Lieffering, L. Bisset. The partitioning of nitrate assimilation between root
and shoot of a range of temperature cereals and pasture grasses. Ann. Bot. London 70:271–276, 1992.
14. W.J. Hunter, C.J. Fahring, S.R. Olsen, L.K. Porter. Location of nitrate reduction in different soybean
cultivars. Crop Sci. 22:944–948, 1982.
15. H. Marschner. Mineral Nutrition of Higher Plants. 2nd ed. San Diego: Academic Press, 1995, pp.
229–265.
16. L. Salsac, S. Chaillou, J.F. Morot-Gaudry, C. Lesaint, E. Jolivet. Nitrate and ammonium nutrition in
plants. Plant Physiol. Biochem. 25:805–812, 1987.
17. A. Bloom, S.S. Sukrapanna, R.L. Warner. Root respiration associated with ammonium and nitrate
absorption and assimilation by barley. Plant Physiol. 99:1294–1301, 1992.
18. A.C. Baron, T.H. Tobin, R.M. Wallsgrove, A.K. Tobin. A metabolic control analysis of the glutamine
synthetase/glutamate synthase cycle in isolated barley (Hordeum vulgare L.) chloroplasts. Plant
Physiol. 105:415–424, 1994.
19. D.G. Blevins. An overview of nitrogen metabolism in higher plants. In: J.E. Poulton, J.T. Romeo, E.E.
Conn, eds. Plant Nitrogen Metabolism. New York: Plenum Press, 1989, pp. 1–41.
Nitrogen 43
CRC_DK2972_Ch002.qxd 7/5/2006 8:53 AM Page 43