Handbook of Plant Nutrition - chapter 6 pptx
Bạn đang xem bản rút gọn của tài liệu. Xem và tải ngay bản đầy đủ của tài liệu tại đây (662.18 KB, 38 trang )
145
6
Magnesium
Donald J. Merhaut
University of California, Riverside, California
CONTENTS
6.1 Historical Information 146
6.1.1 Determination of Essentiality 146
6.2 Function in Plants 146
6.2.1 Metabolic Processes 146
6.2.2 Growth 147
6.2.3 Fruit Yield and Quality 147
6.3 Diagnosis of Magnesium Status in Plants 148
6.3.1 Symptoms of Deficiency and Excess 148
6.3.1.1 Symptoms of Deficiency 148
6.3.1.2 Symptoms of Excess 149
6.3.2 Environmental Causes of Deficiency Symptoms 149
6.3.3 Nutrient Imbalances and Symptoms of Deficiency 150
6.3.3.1 Potassium and Magnesium 150
6.3.3.2 Calcium and Magnesium 151
6.3.3.3 Nitrogen and Magnesium 151
6.3.3.4 Sodium and Magnesium 152
6.3.3.5 Iron and Magnesium 152
6.3.3.6 Manganese and Magnesium 153
6.3.3.7 Zinc and Magnesium 153
6.3.3.8 Phosphorus and Magnesium 153
6.3.3.9 Copper and Magnesium 154
6.3.3.10 Chloride and Magnesium 154
6.3.3.11 Aluminum and Magnesium 154
6.3.4 Phenotypic Differences in Accumulation 155
6.3.5 Genotypic Differences in Accumulation 155
6.4 Concentrations of Magnesium in Plants 156
6.4.1 Magnesium Constituents 156
6.4.1.1 Distribution in Plants 156
6.4.1.2 Seasonal Variations 156
6.4.1.3 Physiological Aspects of Magnesium Allocation 156
6.4.2 Critical Concentrations 157
6.4.2.1 Tissue Magnesium Concentration Associations with Crop Yields 157
6.4.2.2 Tabulated Data of Concentrations by Crops 157
6.5 Assessment of Magnesium in Soils 165
6.5.1 Forms of Magnesium in Soils 165
6.5.2 Sodium Absorption Ratio 165
CRC_DK2972_Ch006.qxd 6/14/2006 7:04 AM Page 145
6.5.3 Soil Tests 170
6.5.4 Tabulated Data on Magnesium Contents in Soils 170
6.5.4.1 Soil Types 170
6.6 Fertilizers for Magnesium 170
6.6.1 Kinds of Fertilizers 170
6.6.2 Effects of Fertilizers on Plant Growth 170
6.6.3 Application of Fertilizers 172
References 172
6.1 HISTORICAL INFORMATION
6.1.1 D
ETERMINATION OF ESSENTIALITY
The word ‘magnesium’ is derived from ‘magnesia’ for the Magnesia district in Greece where talc
(magnesium stone) was first mined (1,2). However, there are other cities that are also named after
the magnesium deposits in local regions (3). In 1808, Sir Humphry Davy discovered magnesium,
but named it magnium, because he considered magnesium to sound too much like manganese.
However, in time, the word magnesium was adopted (3–6). Twenty years later, magnesium was
purified by the French scientist, Bussy (7). The essentiality of magnesium in plants was established
nearly 50 years later (around 1860) by scientists such as Knop, Mayer, Sachs, and Salm-Horstmar
(4,8,9), and during the period 1904–1912, Willstatter identified magnesium as part of the chloro-
phyll molecule (3,6). For many years, magnesium was applied unknowingly to agricultural lands
through manure applications or as an impurity with other processed fertilizers (10); therefore, inci-
dences of magnesium deficiency were relatively uncommon. One of the first mentions of magne-
sium deficiency in plants was in 1923 on tobacco and was referred to as ‘sand drown,’ since the
environmental conditions that were associated with magnesium deficiency occurred in excessively
leached sandy soils (11). Over 100 years later, magnesium has become a global concern, as scien-
tists suggest that magnesium deficiency may be one of the major factors causing forest decline in
Europe and North America (12–17). This malady may be an indirect result of the acidification of
soils by acid rain, which can cause leaching of magnesium as well as other alkali metals.
Magnesium is also an essential nutrient for animals. If forage crops, commonly grasses, are low
in magnesium, grazing animals may develop hypomagnesia, sometimes called grass tetany. For this
reason, many studies have been conducted on magnesium nutrition in forage crops, in an effort to
prevent this disorder (18–24). Based on the review of fertilizer recommendations for field soils in
the Netherlands by Henkens (25), the magnesium requirement for forage crops is closely associated
with the concentration of potassium and crude protein in the crop. This relationship of magnesium
with potassium and crude protein (nitrogen) for animal nutrition is not much different from the
magnesium-potassium-nitrogen associations in plant nutrition.
6.2 FUNCTION IN PLANTS
6.2.1 M
ETABOLIC PROCESSES
Magnesium has major physiological and molecular roles in plants, such as being a component of
the chlorophyll molecule, a cofactor for many enzymatic processes associated with phosphoryla-
tion, dephosphorylation, and the hydrolysis of various compounds, and as a structural stabilizer for
various nucleotides. Studies indicate that 15 to 30% of the total magnesium in plants is associated
with the chlorophyll molecule (26,27). In citrus (Citrus volkameriana Ten. & Pasq.), magnesium
deficiency was associated directly with lower total leaf chlorophyll (28); however, there were no
effects on chlorophyll a/b ratios within the magnesium-deficient leaves.
146 Handbook of Plant Nutrition
CRC_DK2972_Ch006.qxd 6/14/2006 7:04 AM Page 146
The other 70 to 85% of the magnesium in plants is associated with the role of magnesium as a
cofactor in various enzymatic processes (1,2,26,29), the regulation of membrane channels and recep-
tor proteins (30,31), and the structural role in stabilizing proteins and the configurations of DNA and
RNA strands (32,33). Since magnesium is an integral component of the chlorophyll molecule and the
enzymatic processes associated with photosynthesis and respiration, the assimilation of carbon and
energy transformations will be affected directly by inadequate magnesium. In nutrient film-grown
potato (Solanum tuberosum L.), relatively low (0.05mM) or high (4.0 mM) magnesium concentrations
increased dark respiration rates and decreased photosynthetic rates relative to magnesium fertilization
rates ranging from 0.25 to 1.0 mM (34). In hydroponically grown sunflower (Helianthus annuus L.),
photosynthetic rates decreased in ammonium-fertilized, but not nitrate-fertilized plants when the mag-
nesium concentration of nutrient solutions decreased below 2mM (35). This effect was related to the
decreased enzymatic activity as well as the decrease in photosynthetic capacity due to the loss in
assimilating leaf area, occurring mainly as a consequence of leaf necrosis and defoliation (36).
Magnesium may also influence various physiological aspects related to leaf water relations
(37,38). In hydroponically grown tomato (Lycopersicon esculentum Mill.), increasing magnesium fer-
tilization from 0.5 to 10 mM resulted in an increase in leaf stomatal conductance (Gs) and turgor
potential (Ψ
p
) and a decrease in osmotic potential (Ψ
π
) but had no effect on leaf water potential (Ψ
w
)
(37). In other studies (38) where low leaf water potentials were induced in sunflower (Helianthus
annuus L.) leaves, the increased magnesium concentrations in the stroma, caused by decreased stroma
volume due to dehydration, caused magnesium to bind to the chloroplast-coupling factor, thereby
inhibiting the ATPase activity of the enzyme and inhibiting photophosphorylation. Other experiments
(39–41) have indicated that even though up to 1.2mM magnesium may be required in the ATPase
complex of photophosphorylation, magnesium concentrations of 5mM or higher result in conforma-
tional changes in the chloroplast-coupling factor, which causes inhibition of the ATPase enzyme.
As regards to the role of magnesium in molecular biology, magnesium is an integral component of
RNA, stabilizing the conformational structure of the negatively charged functional groups and also con-
currently neutralizing the RNA molecule (42–44). In many cases, the role of the magnesium ion in the
configurations and stabilities of many polynucleotides is not replaceable with other cations, since the lig-
and configurations are of a specific geometry that are capable of housing only magnesium ions (45). In
addition, magnesium serves as a cofactor for enzymes that catalyze the hydrolysis and formation of
phosphodiester bonds associated with the transcription, translation, and replication of nucleic acids (1,2).
6.2.2 GROWTH
Magnesium deficiency may suppress the overall increase in plant mass or specifically suppress root
or shoot growth. However, the extent of growth inhibition of roots and shoots will be influenced by
the severity of the magnesium deficiency, plant type, stage of plant development, environmental
conditions, and the general nutritional status of the crop. In tomato, suboptimal magnesium con-
centrations did not affect overall plant growth (37); however, an accumulation of assimilates
occurred in the shoots, suggesting that assimilate transport from the shoots to the roots was
impaired. For birch (Betula pendula Roth.) seedlings, decreased magnesium availability in the rhi-
zosphere had no effect on root branching pattern but decreased root length, root diameter, and root
dry weight (36). In addition, the fraction of dry matter allocated to the leaves increased even though
overall leaf area decreased (36). In raspberry (Rubus spp. L.), enhanced shoot growth was corre-
lated with increased magnesium in the leaves (46,47).
6.2.3 FRUIT YIELD AND QUALITY
Magnesium deficiencies and toxicities may decrease fruit yield and quality. In two cultivars of apple
(Malus pumila Mill.), fruit magnesium concentrations were correlated negatively with fruit color,
whereas fruit potassium concentrations were positively correlated with fruit color (48). The effects
Magnesium 147
CRC_DK2972_Ch006.qxd 6/14/2006 7:04 AM Page 147
of magnesium on apple fruit quality may have been due to antagonistic effects on potassium uptake
and accumulation. In tomato, even though increasing magnesium fertilization rates did not affect
total shoot dry weight, overall fruit yield decreased with increased magnesium fertilization supply
from 0.5 to 10 mM (37).
6.3 DIAGNOSIS OF MAGNESIUM STATUS IN PLANTS
6.3.1 S
YMPTOMS OF DEFICIENCY AND EXCESS
6.3.1.1 Symptoms of Deficiency
In a physiological sense, magnesium deficiency symptoms are expressed first as an accumulation of
starch in the leaves (49), which may be associated with early reductions in plant growth and
decreased allocation of carbohydrates from leaves to developing sinks (50). This process is followed
by the appearance of chlorosis in older leaves, patterns of which can be explained by the physio-
logical processes associated with magnesium uptake, translocation, and metabolism in
plants (3–5,49). Magnesium is physiologically mobile within the plant. Therefore, if insufficient
magnesium is available from the rhizosphere, magnesium can be reallocated from other plant parts
and transported through the phloem to the actively growing sinks. Because of this mobility within
the plant, symptoms of deficiency will first be expressed in the oldest leaves (Figure 6.1). Early
symptoms of magnesium deficiency may be noted by fading and yellowing of the tips of old leaves
(49,51,52), which progresses interveinally toward the base and midrib of leaves, giving a mottled
or herringbone appearance (52). In later stages of development, deficiency symptoms may be
difficult to distinguish from those of potassium deficiency. Under mild deficiencies, a ‘V’-patterned
interveinal chlorosis develops in dicots as a result of magnesium dissociating from the chlorophyll,
resulting in chlorophyll degradation. In conifers, minor magnesium deficiency symptoms are
browning of older needle tips (0.10% magnesium concentration) and in more severe deficiencies,
the enter needle turns brown and senesce (0.07% magnesium concentration) (49,53). In some
plants, a reddening of the leaves may occur, rather than chlorosis, as is the case for cotton
(Gossypium spp.) (52,54), since other plant pigments may not break down as quickly as chlorophyll.
The loss of protein from magnesium-deficient leaves, however, usually results in the loss of plastic
pigments from most plants (55). On an individual leaf, as well as on a whole plant basis, deficiency
148 Handbook of Plant Nutrition
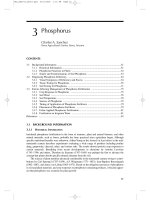
FIGURE 6.1 Symptoms of magnesium deficiency on (left) pepper (Capsicum annum L.) and (right) cucum-
ber (Cucumis sativus L.). (Photographs by Allen V. Barker.) (For a color presentation of this figure, see the
accompanying compact disc.)
CRC_DK2972_Ch006.qxd 6/14/2006 7:04 AM Page 148
symptoms may begin to appear only on the portions of a leaf or the plant that are exposed to the
sun, with the shaded portions of leaves remaining green (49,56). Under severe deficiency symp-
toms, all lower leaves become necrotic and senesce (28,36) with symptoms of interveinal yellow-
ing progressing to younger leaves (36,56).
Magnesium has functions in protein synthesis that can affect the size, structure, and function of
chloroplasts (26). The requirement of magnesium in protein synthesis is apparent in chloroplasts, where
magnesium is essential for the synthesis and maintenance of proteins in the thylakoids of the chloro-
phyll molecule (57–59). Hence, the degradation of proteins in chloroplasts in magnesium-deficient
plants may lead to loss of chlorophyll as much as the loss of magnesium for chlorophyll synthesis.
On a cellular level, magnesium deficiency causes the formation of granules of approximately
80 nm in diameter in the mitochondria and leads to the disruption of the mitochondrial membrane
(60). In the chloroplasts, magnesium deficiency results in reduced and irregular grana and reduced
or nonexistent compartmentation of grana (61). Palomäki (53) noted that chloroplasts were rounded
and thylakoids were organized abnormally in magnesium-deficient Scots pine (Pinus sylvestris L.)
seedlings. In the vascular system, magnesium deficiency may cause swelling of phloem cells and
collapse of surrounding cells, collapse of sieve cells, and dilation of proximal cambia and
parenchyma cells in conifers (53). These alterations at the cellular level occurred before visual
changes were evident and before a detectable decrease in leaf magnesium occurred.
6.3.1.2 Symptoms of Excess
During the early 1800s, symptoms of ‘magnesium’ toxicity in plants were described; however, dur-
ing this time, manganese was called magnesium and magnesium was referred to as magnium or
magnesia (3–5). Because of the confusion in nomenclature, early reports regarding magnesium and
manganese should be read carefully. At the present time, no specific symptoms are reported directly
related to magnesium toxicity in plants. However, relatively high magnesium concentrations can
elicit deficiency symptoms of other essential cations. Plant nutrients that are competitively inhib-
ited for absorption by relatively high magnesium concentrations include calcium and potassium and
occasionally iron (62). Therefore, symptoms of magnesium toxicity may be more closely associ-
ated with deficiency symptoms of calcium or potassium.
6.3.2 ENVIRONMENTAL CAUSES OF DEFICIENCY SYMPTOMS
Conditions of the soil and rhizosphere such as drought or irregular water availability (63,64), poor
drainage or excessive leaching (11), low soil pH (65–67), or cold temperatures (68,69) will exag-
gerate magnesium deficiency symptoms, as magnesium is not physically available under these envi-
ronmental conditions or physiologically, the plant roots are not capable of absorbing adequate
magnesium to sustain normal plant growth.
Conditions of the soil and rhizosphere such as drought or irregular water availability will impact
magnesium uptake. In sugar maple (Acer saccharum Marsh.), foliar analysis indicated that magne-
sium deficiency occurred during drought (64). Likewise, Huang (63) reported that drought-stressed
tall fescue (Festuca arundinacea Schreb.) had lower leaf magnesium concentrations than well-
watered fescue.
Low soil pH is also associated with a low supply or depletion of magnesium, possibly due to
leaching; however, research suggests that impairment of root growth in acid soils (pH 4.3 to 4.7)
also may hinder magnesium absorption (67). In one study (65), low soil pH (3.0) resulted in
increased accumulation of magnesium in the shoots, but decreased accumulation in the roots.
Contradicting Marler (65) and Tan et al. (67), Johnson et al. (70) found no clear correlation between
low soil pH and magnesium accumulation.
Relatively high and low root-zone temperatures affect magnesium uptake, but the degree of
impact may be influenced by plant type and stage of plant development. Huang et al. (71) and
Magnesium 149
CRC_DK2972_Ch006.qxd 6/14/2006 7:04 AM Page 149
Huang and Grunes (68) reported that increasing root-zone temperature (10, 15, 20ЊC) linearly
increased magnesium accumulation by wheat seedlings that were less than 30 days old but sup-
pressed accumulation by seedlings that were more than 30 days old. Similarly, magnesium uptake
decreased when temperatures in the rhizosphere decreased from 20 to 10ЊC (69).
Although any environmental condition such as unfavorable soil temperature or pH may reduce
root growth and thus reduce magnesium uptake, other characteristics such as mycorrhizal colo-
nization can increase magnesium uptake. Likewise, it has been shown that plants that have colo-
nization of roots by mycorrhiza show higher amounts of magnesium accumulation relative to
nonmycorrhizal plants (72–75).
Shoots exposed to environmental parameters such as high humidity (76), high light intensity
(77,78), or high or low air temperatures (79) will decrease the ability of plants to absorb and
translocate magnesium, since transpiration is reduced and the translocation of magnesium is
driven by transpiration rates (63,76,80–84).
Light intensity can affect the expression of symptoms of magnesium deficiency. Partial shading
of magnesium-deficient leaves has been shown to prevent or delay the development of chlorosis
(77). Others (49,56) have also determined that magnesium deficiency symptoms may begin to
appear only on the portions of a leaf or plant that are exposed to the sun, with the shaded portions
of leaves remaining green. Zhao and Oosterhuis (78) also reported that shading (63% light reduc-
tion) increased leaf-blade concentrations of magnesium in cotton plants by 16% relative to
unshaded plants.
6.3.3 NUTRIENT IMBALANCES AND SYMPTOMS OF DEFICIENCY
Magnesium deficiency symptoms may be associated with an antagonistic relationship between mag-
nesium ions (Mg
2ϩ
) and other cations such as hydrogen (H
ϩ
), ammonium (NH
4
ϩ
), calcium (Ca
2ϩ
),
potassium (K
ϩ
), aluminum (Al
3ϩ
), or sodium (Na
ϩ
). The competition of magnesium with other
cations for uptake ranges from highest to lowest as follows: K Ͼ NH
4
ϩ
Ͼ Ca Ͼ Na (85,86). These
cations can compete with magnesium for binding sites on soil colloids, increasing the likelihood that
magnesium will be leached from soils after it has been released from exchange sites. Within the
plant, there are also antagonistic relationships between other cations and magnesium regarding the
affinity for various binding sites within the cell membranes, the degree of which is influenced by
the type of binding site (lipid, protein, chelate, etc.), and the hydration of the cation (87). These bio-
chemical interactions result in competition of other cations with magnesium for absorption into the
roots and translocation and assimilation in the plant (88–92).
6.3.3.1 Potassium and Magnesium
Increased potassium fertilization or availability, relative to magnesium, will inhibit magnesium
absorption and accumulation and vice versa (34,35,90,93–99). The degree of this antagonistic effect
varies with potassium and magnesium fertilization rates, as well as the ratio of the two nutrients to one
another. This phenomenon has been documented in tomato (62,96), soybean (Glycine max Merr.),
(93,100), apple (101), poplar (Populus trichocarpa Torr. & A. Gray) (102), Bermuda grass (Cynodon
dactylon Pers.) (103–105), perennial ryegrass (Lolium perenne L.) (18), buckwheat (Fagopyrum escu-
lentum Moench) (93), corn (Zea mays L.) (98), and oats (Avena sativa L.) (93). Potassium chloride
fertilization increased cotton (Gossypium hirsutum L.) plant size and seed and lint weight and
increased efficiency of nitrogen use, but had suppressive effects on magnesium accumulation in vari-
ous plant parts (106). Fontes et al. (107) reported that magnesium concentrations of potato (Solanum
tuberosum L.) petioles declined as potassium fertilization with potassium sulfate increased from 0.00
to 800 kg K ha
Ϫ1
. Legget and Gilbert (100) noted that with excised roots of soybean, magnesium
uptake was inhibited if calcium and potassium were both present but not if calcium or potassium was
present alone. The opposite also holds true in that potassium and calcium contents of roots were
150 Handbook of Plant Nutrition
CRC_DK2972_Ch006.qxd 6/14/2006 7:04 AM Page 150
depressed with increasing rates of magnesium fertilization (100). Similar results were obtained in
potatoes (Solanum tuberosum L.) where increasing magnesium fertilization from 0.05 to 4.0mM
decreased the potassium concentration in shoots from 76.6 to 67.6 mg g
Ϫ1
shoot dry weight (34).
6.3.3.2 Calcium and Magnesium
High rhizosphere concentrations of calcium, relative to magnesium, are inhibitory to the absorption
of magnesium and vice versa (34,35,37,86,90,108–110). In the early 1900s, the importance of
proper ratios of magnesium to calcium in soils was emphasized through studies conducted by Loew
and May (4) on the relationships of lime and dolomite. High calcium concentrations in solution or
in field soils sometimes limit magnesium accumulation and may elicit magnesium deficiency symp-
toms (111–113). In tomato, the magnesium concentration in shoots (62) and fruits (114) decreased
as the calcium fertilization rate increased. Similarly, it was shown that increased calcium concen-
trations inhibited magnesium uptake in common bean (Phaseolus vulgaris L.) (86). On the other
hand, decreased accumulation of calcium in birch was directly correlated with the decreased
absorption and accumulation of calcium as magnesium fertilization rates increased (36). The
absorption of calcium decreased from 1.5 to 0.3 mmol g
Ϫ1
root mass as magnesium fertilization
increased (36). Morard et al. (115) reported a strong antagonism between calcium and magnesium,
suggesting that calcium influenced magnesium translocation to leaves. Optimum leaf Ca/Mg ratios
are considered to be approximately 2:1; however, Ca/Mg ratios >1:1 and Ͻ5:1 can produce ade-
quate growth without the expression of magnesium deficiency (36,85). In a study with tomato, the
root, stem, and leaf calcium concentrations decreased as fertilization rates increased from 0.50 to
10.0 mM Mg in solution culture (37). Similarly, with woody ornamentals, high fertilization rates of
calcium relative to magnesium inhibited the accumulation of magnesium and decreased root and
shoot growth, and inversely, high magnesium decreased calcium accumulation and plant growth
(35,109). Clark et al. (116) used flue-gas desulfurization by-products to fertilize corn in greenhouse
experiments. They noted that the materials needed to be amended with magnesium at a ratio of 1
part magnesium to 20 parts of calcium to avoid magnesium deficiency in the corn. In containerized
crop production, general recommendations indicate sufficient calcium and magnesium additions to
produce an extractable Ca/Mg ratio of 2:5 (117). Navarro et al. (118) reported an antagonist effect
of calcium on magnesium accumulation in melon (Cucumis melo L.), regardless of salinity levels
imposed by sodium chloride. In other studies (119–121), it was shown that even with the use of
dolomitic lime, magnesium deficiency might occur. This occurrence is due to the different solubil-
ities of magnesium carbonate (MgCO
3
) and calcium carbonate (CaCO
3
) in the dolomite. Therefore,
during the first 4 months, both magnesium and calcium solubilized from the dolomite. However,
after 4 months, all of the magnesium had dissolved from the dolomite, leaving only Ca from the
CaCO
3
available for dissolution and availability to the plant (119,120). Based on these studies, it
appears that the use of solid calcium and magnesium fertilizers with similar solubility rates may be
important so that both elements are available in similar and sufficient levels throughout the entire
crop production cycle (119–121).
6.3.3.3 Nitrogen and Magnesium
Nitrogen may either inhibit or promote magnesium accumulation in plants, depending on the form
of nitrogen: with ammonium, magnesium uptake is suppressed and with nitrate, magnesium uptake
is increased (35,101,122–124). In field soils, the chances of ammonium competing with magnesium
for plant uptake are more likely to occur in cool rather than warm soils because in warmer soils, most
ammonium is converted into nitrate by nitrification processes. In forests, high inputs of ammoniacal
nitrogen amplified latent magnesium deficiency (125). In conditions of sand culture, ammonium-
nitrogen of Norway spruce (Picea abies Karst.) resulted in significantly lower magnesium and
chlorophyll concentrations in current-year and year-old needles compared to fertilization with
Magnesium 151
CRC_DK2972_Ch006.qxd 6/14/2006 7:04 AM Page 151
nitrate-nitrogen (126). Similarly, in herbaceous plants such as wheat (Triticum aestivum L.) (127)
and bean (Phaseolus vulgaris L.) (128), ammoniacal nitrogen reduced shoot accumulation of magne-
sium (127). In cauliflower (Brassica oleracea var. botrytis L.), increasing nitrate-nitrogen fertilization
from 90 to 270 kg ha
Ϫ1
increased yield response to increased magnesium fertilization rates (22.5 to
90 kg ha
Ϫ1
) (129). Similarly, in hydroponically grown poinsettia (Euphorbia pulcherrima Willd.),
magnesium concentrations in leaves increased as the proportion of nitrate-nitrogen to ammonium-
nitrogen increased, even though all treatments received the same amount of total nitrogen (130). In a
similar way, magnesium fertilization increased the plant accumulation of nitrogen, which was applied
as urea, in rice (Oryza sativa L.) (131). As with other nutrients, the degree of impact of nitrogen on
magnesium nutrition is influenced by the concentrations of the nutrients, relative to each other. For
example, Huang et al. (71) demonstrated with hydroponically grown wheat that nitrogen form had no
significant effect on shoot magnesium levels when magnesium concentrations in solutions were rela-
tively high (97 mg L
Ϫ1
); however, at low magnesium concentrations (26 mg L
Ϫ1
) in solutions, increas-
ing the proportion of ammonium relative to nitrate significantly decreased shoot Mg concentrations.
In another study, Huang and Grunes (68) also noted that even though magnesium uptake rates were
significantly higher for plants supplied with nitrate rather than ammonium, increasing the proportion
of the nitrogen supply as nitrate decreased net magnesium translocation to the shoots.
6.3.3.4 Sodium and Magnesium
High soil or nutrient-solution salinity levels (with NaCl), relative to magnesium supply, may inhibit
magnesium accumulation in plants (132–135). However, results are variable since salinity often
inhibits plant growth; therefore, there may be a reduction in the total uptake of a nutrient into a plant.
However, since the plant is smaller, the magnesium level, expressed in terms of concentration, may
be higher. Application of sodium-containing fertilizers (chloride or nitrate) lowered the concentration
of magnesium in white clover (Trifolium repens L.) leaves but increased the magnesium in perennial
ryegrass (Lolium perenne L.) (133). In hydroponically grown taro (Colocasia esculenta Schott.) (136)
and wheat (137), sodium chloride treatments resulted in a suppression of leaf magnesium. Use of
sodium chloride to suppress root and crown rot in asparagus (Asparagus officinalis L. var. altilis L.)
also suppressed magnesium accumulation in the leaves (138). Even in a halophyte such as Halopyrum
mucronatum Stapf., increasing sodium chloride concentrations in nutrient solutions from 0.0 to
5220 mg L
Ϫ1
significantly decreased magnesium concentrations in the shoots and roots (134).
However, in hydroponically grown bean (Phaseolus vulgaris L.), sodium chloride increased leaf con-
centrations of magnesium, perhaps as a result of growth suppression (139). Growth suppression of
rice was associated with salinity, but the levels of magnesium in the leaves were unaffected (140).
Other research (141) found that sodium chloride increased accumulation of magnesium in shoots but
suppressed magnesium accumulation in roots of strawberry (Fragaria chiloensis Duchesne var.
ananassa Bailey). In fact, some (142) have attributed the salt tolerance of some soybean cultivars to
the ability to accumulate potassium, calcium, and magnesium, in spite of saline conditions.
6.3.3.5 Iron and Magnesium
Uptake and accumulation of iron may be inhibited or unaffected by increased magnesium fertilization.
In addition, the translocation of magnesium from the roots to the shoots may decrease in iron-
deficient plants relative to iron-sufficient plants (143). The antagonistic relationship of iron with mag-
nesium has been demonstrated in tomato (62) and radish (Raphanus sativus L.) (144). Nenova and
Stoyanov (143) noted that the uptake and translocation of magnesium was reduced in iron-deficient
plants compared to iron-sufficient plants. However, Bavaresco (145) reported that under lime-induced
chlorosis, chlorotic grape (Vitis vinifera L.) leaves did not differ from green leaves in nutrient compo-
sition, but the fruits of chlorotic plants were different in that they had higher magnesium than fruits
from normal plants. Iron concentrations did not differ among any of the tissues.
152 Handbook of Plant Nutrition
CRC_DK2972_Ch006.qxd 6/14/2006 7:04 AM Page 152
6.3.3.6 Manganese and Magnesium
Manganese, as a divalent cation, can compete with magnesium for binding sites on soil particles as
well as biological membranes within plants (146). However, manganese is required in such small
quantities (micromolar concentrations in nutrient solutions resulting in Manganese, as a divalent
cation, can compete with magnesium for binding sites on soil particles as well as biological mem-
branes within plants (146). However, manganese is required in such small quantities (micromolar
concentrations in nutrient solutions resulting in Ϸ 20 to 500 ppm in most plant tissues) that man-
ganese toxicity usually occurs before quantities are high enough to significantly inhibit magnesium
uptake to physiologically deficient levels (62,85). However, some experiments (147,148) have
demonstrated that manganese can inhibit magnesium uptake. However, Alam et al. (147) and
Qauartin et al. (148) did not indicate if the inhibition of magnesium was substantial enough to
induce magnesium deficiency symptoms. On the other hand, increased magnesium fertilization has
been shown to decrease manganese uptake and accumulation (34,80), and in some cases, magne-
sium fertilization may mitigate manganese toxicity (149,150). In one study (151), the tolerance of
certain cotton (Gossypium hirsutum L.) cultivars to manganese appeared to be related to the ability
to accumulate more magnesium than by the manganese-sensitive cultivars.
6.3.3.7 Zinc and Magnesium
As with manganese, zinc is a divalent cation that is required in minuscule quantities for normal
plant growth. Therefore, plants usually suffer from zinc toxicity before concentrations are high
enough to inhibit magnesium uptake. However, some research has indicated that as zinc increases
to toxic levels in plants, the accumulation of magnesium is suppressed, but not to the degree of
inducing magnesium deficiency symptoms. In hydroponically grown tomato (62), increasing zinc
concentrations from 0.0 to 1.58 mg L
Ϫ1
did not affect magnesium concentrations in shoots.
Similarly, nontoxic levels of zinc applications through zinc-containing fungicides or fertilization
(soil or foliar applied) did not affect magnesium concentrations in potato leaves, although zinc con-
centrations increased in leaves (152). However, at higher zinc concentrations (30 vs. 0.5mg L
Ϫ1
),
magnesium accumulation in tomato leaves and fruit was inhibited (153). Similarly, with blackgram
(Vigna mungo L.) grown in soil, accumulation of zinc in plants led to a suppression of magnesium,
calcium, and potassium in leaves (154). Bonnet et al. (155) also reported that zinc fertilization of
ryegrass (Lolium perenne L.) lowered magnesium content of leaves, in addition to lowering the
efficiency of photosynthetic energy conversion, and elevating the activities of ascorbate peroxidase
and superoxide dismutase. Conversely, pecan (Carya illinoinensis K. Koch) grown under zinc-
deficient conditions had higher leaf magnesium than trees grown under zinc-sufficient conditions
(156). However, in nutrient film-grown potatoes (Solanum tuberosum L.), increased levels of mag-
nesium fertilization (1.2 to 96.0 mg L
Ϫ1
) did not affect zinc concentrations in tissues.
6.3.3.8 Phosphorus and Magnesium
Phosphate ions have a synergistic effect on accumulation of magnesium in plants, and vice versa.
This phenomenon is associated with the ionic balance related to cation and anion uptake into plants
as well as the increased root growth sometimes observed with increased phosphorus fertilization.
For example, with hydroponically grown sunflower (Helianthus annuus L.), phosphorus accumula-
tion increased in tissues from 9.0 to 13.0 mg g
Ϫ1
plant dry weight as magnesium concentrations in
nutrient solutions were increased from 0.0 to 240 mg L
Ϫ1
(35). Likewise, increasing phosphorus fer-
tilization increases magnesium accumulation, as demonstrated in field-grown alfalfa (Medicago
sativa L.) (157). The effect of phosphorus fertilization increasing magnesium uptake has also been
documented in rice (Oryza sativa L.), wheat (Triticum aestivum L.), bean (Phaseolus vulgaris L.),
and corn (Zea mays L.) (158). Reinbott and Blevins (82,159) reported that phosphorus fertilization
of field-grown wheat (Triticum aestivum L.) and tall fescue (Festuca arundinacea Shreb.) increased
Magnesium 153
CRC_DK2972_Ch006.qxd 6/14/2006 7:04 AM Page 153
leaf calcium and magnesium accumulation and concluded that proper phosphorus nutrition may be
more important than warm root temperatures in promoting magnesium and calcium accumulation,
particularly if soils have suboptimal phosphorus concentrations. Reinbott and Blevins (160) also
showed a positive correlation between calcium and magnesium accumulation in shoots with
increased phosphorus fertilization of hydroponically grown squash (Cucurbita pepo L.).
6.3.3.9 Copper and Magnesium
Like other micronutrients, copper is a plant nutrient, which is required in such low concentrations
relative to the requirements for magnesium that high copper fertilization is more likely to induce
copper toxicity before causing magnesium deficiency symptoms. However, some studies have
shown that copper may competitively inhibit magnesium accumulation in plants (161,162). In taro
(Colocasia esculenta Schott), increasing the nutrient solution copper concentrations from 0.03
to 0.16 mg L
Ϫ1
, significantly decreased the accumulation of magnesium in leaves from 5.5 to
4.4 mg g
Ϫ1
dry weight (161). In a study (162) using young spinach (Spinacia oleracea L.), where
copper concentrations in nutrient solutions were increased from 0.0 to 10.0 mg L
Ϫ1
, which is two
orders of magnitude greater than the copper concentrations used in the study conducted by Hill et
al. (2000), copper toxicity symptoms did occur, and there was a significant suppression in magne-
sium accumulation in the leaves and roots from 322 and 372 mg kg
Ϫ1
to 41 and 203 mg kg
Ϫ1
,
respectively (162). However, the magnesium concentration reported in this study (162) is an order
of magnitude lower than what is found typically in most herbaceous plants (85). On the other hand,
effects of magnesium fertilization on copper uptake are not documented, although one study (34)
indicated that increasing rates of magnesium fertilization did not significantly reduce the uptake
and accumulation of copper.
6.3.3.10 Chloride and Magnesium
The effects of chloride on magnesium accumulation in plants have been studied in relation to the
effects of salinity on growth and nutrient accumulation. In many of these studies, it is difficult to
separate the effects of chloride from those of sodium ions; hence, many of the results show a depres-
sion of magnesium accumulation with increases in sodium chloride concentration in the root zone
(132–135). In grapes (Vitis vinifera L.), salinity from sodium chloride did not affect magnesium
concentrations in leaves, trunk, or roots (163). With tomato, increased magnesium fertilization rates
did not increase the accumulation of chlorine in the leaves, stems, or roots (37). With soybean,
uptake of chloride by excised roots was low from magnesium chloride solutions but was enhanced
by the addition of potassium chloride (100).
6.3.3.11 Aluminum and Magnesium
Free aluminum in the soil solution inhibits root growth, which in turn will reduce ability of plants
to take up nutrients (164). Research with red spruce (Picea rubens Sarg.) indicated that magnesium
concentrations in roots and needles of seedlings were suppressed by exposure to Ϸ 400 µM alu-
minum in nutrient solutions (165,166). Increasing concentrations of free aluminum have also been
shown to reduce magnesium accumulation in taro (167), maize (Zea mays L.) (168,169), and wheat
(Triticum aestivum L.) (170). Aluminum-induced magnesium deficiency may be one mechanism of
expression of aluminum toxicity in plants, and aluminum tolerance of plants may be related to the
capacity of plants to accumulate magnesium and other nutrients in the presence of aluminum
(67,95,168,170–172). Some studies (173) have shown that the toxic effects of aluminum were
reduced when magnesium was introduced into the nutrient solution and subsequently increased the
production and excretion of citrate from the root tips. The authors (173) hypothesized that the
citrate binds with free aluminum, forming nontoxic aluminum–citrate complexes. Keltjens (168)
also reported that aluminum chloride in solution culture restricted magnesium absorption by corn
154 Handbook of Plant Nutrition
CRC_DK2972_Ch006.qxd 6/14/2006 7:04 AM Page 154
but that aluminum citrate or organic complexes did not inhibit magnesium absorption and were not
phytotoxic.
Sensitivity to aluminum toxicity may or may not be cultivar-specific. In a study (170) with
wheat, differences in magnesium accumulation occurred for different cultivars, with a significantly
greater accumulation of magnesium in the leaves of the aluminum-tolerant ‘Atlas 66’ compared to
the aluminum-sensitive ‘Scout 66’ and increasing the magnesium concentration in nutrient solu-
tions relative to aluminum and potassium concentrations increased the aluminum tolerance of
‘Scout 66’ (170). However, in another study (174) with aluminum-tolerant and aluminum-sensitive
corn cultivars, increasing concentrations of aluminum resulted in higher nutrient concentrations in
the shoots of aluminum-sensitive than in the aluminum-tolerant cultivar, probably the result of a
greater suppression of growth in the sensitive cultivar.
6.3.4 PHENOTYPIC DIFFERENCES IN ACCUMULATION
The uptake and accumulation of magnesium may change during different stages of physiological
development. Knowledge of these changes is important in managing nutritional regimes for plant
growth and for sampling of plants to assess their nutritional status. In poinsettias, magnesium accu-
mulation was greatest from the period of flower induction to the visible bud stage, but then accumu-
lation decreased during the growth phase of visible bud to anthesis (130). With cotton (Gossypium
hirsutum L.), maximum daily influx of magnesium into roots occurred at peak bloom (175).
Accumulation (net influx) of magnesium in annual ryegrass (Lolium multiflorum Lam.) decreased
with increasing plant age (176,177). Similarly, magnesium uptake rates by tomato decreased from 68
to 17.5 µeq g
Ϫ1
fresh weight per day as the plants aged from 18 to 83 days (110). With anthurium
(Anthurium andraeanum Lind.), changes in the allocation of magnesium to different organs with
increased plant age were attributed to transport of nutrients from lower leaves to the flowers, result-
ing in a lowering of magnesium concentrations in the lower leaves (178). Tobacco (Nicotiana
tabacum L.) showed decreasing concentrations of leaf magnesium from base to top of the plants over
the growing season, and stem magnesium concentrations also fell with plant age (179). Sadiq and
Hussain (180) attributed the decline in magnesium concentration in bean (Phaseolus vulgaris L.)
plants to a dilution effect from plant growth. However, Jiménez et al. (181) reported no significant
differences in shoot-tissue magnesium concentrations throughout the different growth stages of
different soybean cultivars.
6.3.5 GENOTYPIC DIFFERENCES IN ACCUMULATION
Variation in magnesium accumulation might occur for different cultivars or plant selections
within a species. In a 2-year study with field-grown tomato plants in an acid soil, magnesium con-
centration of leaves was significantly greater in cultivar ‘Walter’ (1.1%) than in ‘Better Boy’
(0.9%) in a dry, warm year, but no differences (average 0.6%) occurred between the cultivars in
a wetter, cooler year that followed (182). Mullins and Burmester (183) noted that cotton cultivars
differed in concentrations of magnesium in leaves and burs under nonirrigated conditions.
Differences in magnesium concentrations in different cultivars of Bermuda grass (Cynodon
dactylon Pers.) have been reported (184). Rosa et al. (185) suggested that variation in calcium,
magnesium, and sulfur among broccoli (Brassica oleracea var. italica Plenck) varieties justifies
selection of a particular cultivar to increase dietary intake of these elements. Likewise, in
different wheat (Triticum aestivum L.) (170) and barley (Hordeum vulgare L.) (171) cultivars,
aluminum tolerance was associated with the ability to take up and accumulate magnesium under
conditions of relatively high aluminum concentrations (1.35 to 16.20 mg L
Ϫ1
) in the rhizosphere.
Similar studies (94) have been conducted to select clonal lines of tall fescue (Festuca arundi-
nacea Schreb.), which display higher accumulation of magnesium, in an effort to prevent mag-
nesium tetany in grazing animals.
Magnesium 155
CRC_DK2972_Ch006.qxd 6/14/2006 7:04 AM Page 155
6.4 CONCENTRATIONS OF MAGNESIUM IN PLANTS
6.4.1 M
AGNESIUM CONSTITUENTS
Magnesium is present in the plant in several biochemical forms. In studies with forage grasses,
magnesium was measured in water-soluble, acetone-soluble, and insoluble constituents (18). These
forms are present in the phloem, xylem, cytoplasm (water-soluble fraction), chlorophyll (acetone-
soluble fraction), and cell wall constituents (insoluble fraction).
6.4.1.1 Distribution in Plants
The quantity of magnesium accumulated will differ for various plant organs, with a tendency
toward greater allocation of magnesium in transpiring organs such as leaves and flowers, rather
than the roots (186–188); however, this translocation to different plant parts may be affected by the
status of other elements in the plant (143,164,189). Similarly, the ability of magnesium to remo-
bilize and translocate out of a particular plant organ may vary among plant organs (186,187). In
cucumber, magnesium concentrations were seven times higher in the shoots (70 µmol g
Ϫ1
fresh
weight) than in the roots (10 µmol g
Ϫ1
fresh weight) (190). In native stands of 13-year-old
Hooker’s Banksia (Banksia hookeriana Meissn.), magnesium was distributed to different plant
organs as follows (mg g
Ϫ1
dry weight): 0.99 in stems, 1.41 in leaves, and 0.73 in reproductive
structures, which account for 54, 21, and 25% of the total magnesium content, respectively (191).
In walnut (Juglans regia L.), magnesium remobilization from catkins was less than that from
leaves (186,187). Additional studies (192) indicate that the magnesium concentration in the seeds
of several halophytes ranged from 0.22 to 0.90% for forbs and 0.07 to 0.97% for grasses (192). In
corn (Zea mays L.), less magnesium was translocated from the roots to the shoots for iron-deficient
plants than with plants with sufficient iron (143). In a similar manner for hydroponically grown
tomatoes, increasing potassium concentrations of nutrient solutions resulted in decreased magne-
sium concentration in leaves and roots, but increased magnesium concentrations in fruits and seeds
(193).
Although magnesium accumulates to higher levels in aboveground organs than in belowground
organs, there may also be spatial differences in magnesium accumulation within a particular organ
(194). In corn leaves, magnesium concentration decreased from the leaf tip to the leaf base (194).
The relative distribution of magnesium within plants may be altered by magnesium fertilization
rates as well as the fertilization rates of other nutrients. Other environmental stresses, such as iron
deficiency, have also been shown to modify the spatial gradient of magnesium concentrations along
the leaf blade of corn (194).
6.4.1.2 Seasonal Variations
In perennial ryegrass (18) and walnut (186,187), magnesium concentration increased throughout the
growing season. For field-grown soybeans, there was an indication that magnesium was remobilized
from stems and leaves and translocated to developing pods later in the growing season (195), since
stems and leaf tissue magnesium concentrations decreased from approximately 0.70% to less than
0.50% as pod magnesium concentrations increased from 0.48 to 0.51%, indicating a remobilization
of magnesium from vegetative to reproductive tissue. However, the degrees of differences were
affected by soil type and irrigation frequency (195).
6.4.1.3 Physiological Aspects of Magnesium Allocation
Physiologically, certain stages of plant development, such as flowering and fruiting, may make
plants more susceptible to magnesium deficiencies. In camellia (Camellia sasanqua Thunb.
156 Handbook of Plant Nutrition
CRC_DK2972_Ch006.qxd 6/14/2006 7:04 AM Page 156
‘Shishi Gashira’), magnesium deficiency may be expressed after flowering, as the first vegetative
flush commences in the spring (56). This expression appears to be attributed to the large flowers
of ‘Shishi Gashira’ acting as sinks for magnesium. After flowering, when magnesium reserves in
the plants are low, plants may be markedly susceptible to magnesium deficiency and may
develop typical magnesium deficiency symptoms if sufficient magnesium is not available in the
soil for uptake. Similarly, in cucumber, magnesium concentration in leaves increased with leaf
age, until flowering and fruiting, at which point concentrations increased in the younger leaves
(190). In grapes (Vitis vinifera L.), the magnesium concentration (10.1 mg/cluster) of ripening
berries of ‘Pinot Blanc,’ a cultivar that is susceptible to lime-induced chlorosis during ripening,
was significantly higher than the magnesium concentration (7.1 mg/cluster) for berries of the
lime-tolerant cultivar ‘Sauvignon Blanc’ (145). However, in blades and petioles, there were no
differences in magnesium concentrations (145). In other grape cultivars (‘Canadian Muscat’ and
‘Himrod’) that are susceptible to berry drop and rachis necrosis, spray applications of magne-
sium were shown to increase berry yield through the alleviation of rachis necrosis and berry drop
(196). A similar observation was noted on grapefruit (Citrus paradisi Macfady) trees by Fudge
(197). As fruit and seed development occurred, a depletion of magnesium from leaves near to the
fruits was apparent, as only the leaves in proximity to the fruits expressed magnesium deficiency
symptoms.
6.4.2 CRITICAL CONCENTRATIONS
6.4.2.1 Tissue Magnesium Concentration Associations with Crop Yields
The magnesium concentration of tissues considered as deficient, sufficient, or toxic depends on
what growth parameter is being measured in the crops. In many food crops, classification of nutri-
ent sufficiency is based on harvestable yields and quality of the edible plant parts (198). In orna-
mental plants, sufficiency values are based on plant growth rate and visual quality of the
vegetative and reproductive organs. In forestry, ratings are based on rate of growth and wood
quantity and quality. For example, in birch (Betula pendula Roth.) seedlings, magnesium
sufficiency levels in leaves were correlated with relative growth rate (36). Based on their studies,
maximum growth rate was correlated with a mature healthy leaf magnesium concentration of
0.14%, a concentration that was considered deficient for rough lemon (Citrus jambhiri Lush.)
production (28). Austin et al. (199) reported that magnesium concentrations in taro (Colocasia
esculenta Schott) varied from 0.07 to 0.42% with hydroponically grown plants and noted that
growth parameters (biomass, leaf area, nutrient concentrations) did not vary as the magnesium in
solution varied from 1.20 to 19.2mg L
Ϫ1
. In corn, optimal leaf magnesium concentrations were
determined to range between 0.13 and 0.18% for maximum corn yields (198). With peach
(Prunus persica Batsch.), the critical concentration or marginal level of magnesium in leaves was
determined to be about 0.2% of the dry mass based on the appearance of symptoms of deficiency
but with no growth suppression at this concentration (200).
6.4.2.2 Tabulated Data of Concentrations by Crops
In most commercially grown crops, magnesium concentrations average between 0.1 and 0.5% on a
dry weight basis (29). However, total magnesium concentration may vary considerably between
different plant families. The legumes (Leguminosae or Fabaceae) can have nearly double the mag-
nesium concentration as most cereal crops (201). Likewise, oil seed crops and root crops can also
contain high concentrations of magnesium (201). A tabulated description of magnesium concentra-
tions for different crops is presented in Table 6.1.
Magnesium 157
CRC_DK2972_Ch006.qxd 6/14/2006 7:04 AM Page 157
158 Handbook of Plant Nutrition
TABLE 6.1
Ranges of Magnesium Concentrations in Different Crops, Which Were Considered
Deficient, Sufficient, or Excessive, Depending on the Crop and the Crop Yield Component
Being Considered
Type of Crop Diagnostic Range (%)
Latin Name Common Name Low Sufficient High
Abelia R. Br. Abelia 0.25–0.36
Abeliophyllum Nakai. White forsythia 0.20–0.24
Abies Mill. Fir 0.06–0.16
Acalypha hispida Burm.f. Chenille plant 0.60
Acer L. Maple 0.10–0.77
Achillea L. Yarrow 0.18–0.27
Acorus gramineus Ait. Japanese sweet flag 0.23–0.37
Actinidia Lindl. Kiwi-fruit 0.35–0.80
Aeschynanthus radicans Jack Lipstick plant 0.25–0.30
Aesculus L. Buckeye, horsechestnut 0.17–0.65
Aglaonema Schott Chinese evergreen 0.30–1.00
Agrostis L. Bent grass 0.25–0.30
Ajuga L. Bugleweed 0.23–0.53
Allamanda L. Allamanda 0.25–1.00
Allium cepa L. Onion 0.25–0.50
Allium sativum L. Garlic 0.15–2.5
Alocasia cucullata (Lour.) Chinese taro 0.87
G. Don.
Aloe L. Aloe 0.62–1.32
Alstroemeria L. Alstroemeria 0.20–0.50
Amelanchier Medic. Serviceberry 0.22–0.30
Amsonia Walt. Blue star 0.17–0.27
Anacardium L. Cashew 0.02–0.15
Ananas Mill. Pineapple 0.30–0.60
Annona L. Custard apple, soursop 0.30–0.50
Anthurium Schott. Anthurium 0.34–1.00
Antirrhinum L. Snapdragon 0.50–1.05
Aphelandra squarrosa Nees. Zebra plant 0.50–1.00
Apium L. Celery 0.20–0.50
Arachis hypogaea L. Peanut or groundnut 0.30–0.80
Aralia spinosa L. Devil’s walkingstick 0.14–0.55
Araucaria Juss. Bunya-bunya, 0.20–0.50
monkey puzzle tree,
Norfolk Island pine
Armoracia rusticana P. Horseradish 0.25–3.0
Gaertn., B. Mey. & Scherb.
Artemisia L. Dusty miller, 0.19–0.62
wormwood,
tarragon
Asarum L. Ginger or snakeroot 0.50–0.72
Asclepias L. Milkweed 0.22–0.40
Asparagus L. Asparagus 0.10–0.40
Aspidistra elatior Blume Cast-iron plant 0.12–0.33
Aster L. Aster 0.18–0.35
Astilbe Buch Ham. Ex D. Don Lilac rose 0.12–0.28
Aucuba japonica Thunb. Japanese laurel 0.13–0.26
CRC_DK2972_Ch006.qxd 6/14/2006 7:04 AM Page 158
Magnesium 159
TABLE 6.1 (
Continued
)
Type of Crop Diagnostic Range (%)
Latin Name Common Name Low Sufficient High
Avena sativa L. Oats 0.07–0.39 0.13–0.52
Beaucarnea recurvata Lem. Pony-tail palm 0.20–0.50
Begonia L. Begonia 0.30–0.88
Berberis L. Barberry 0.13–0.26
Beta vulgaris L. Beet 0.25–1.70
Betula L. Birch 0.14–0.37 0.16–1.00
Bougainvillea glabra Choisy. Paper flower 0.25–0.75
Bouvardia Salisb. Bouvardia 0.49–0.73
Brassica L. Mustard, kale, 0.17–1.08
cauliflower,
broccoli, cabbage
Bromelia L. Bromeliad 0.40–0.80
Bromus L. Bromegrass 0.08–0.30
Buddleia L. Butterfly bush 0.17–0.50
Buxus L. Boxwood 0.18–0.60
Caladium Venten. Fancy-leaf caladium 0.20–0.40
Calathea G. F. Mey. Feather calathea 0.25–1.30
Callicarpa L. Beautyberry 0.25–0.42
Callisia L. Wandering jew 0.92–1.40
Calycanthus L. Sweetshrub or 0.12–0.17
Carolina allspice
Camellia L. Tea 0.12–0.33
Campsis Lour. Trumpet creeper 0.14–0.19
Capsicum L. Pepper 0.30–2.80
Carex L. Sedge 0.15–0.28
Carica L. Papaya 0.40–1.20
Carissa grandiflora Natal plum 0.25–1.00
(E. H. Mey.) A. DC.
Carpinus L. Hornbeam 0.18–0.40
Carya Nutt. Hickory, pecan 0.04–0.12 0.18–0.82
Caryopteris Bunge. Bluebeard 0.16–0.17
Catalpa Scop. Catalpa 0.34–0.36
Catharanthus G Don Madagascar or 0.32–0.78
rosy periwinkle
Cattleya Lindl. Orchid, cattleya 0.27–0.70
Ceanothus impressus Trel. Santa Barbara ceanothus 0.16–0.19
Cedrus Trew. Cedar 0.09–0.35
Celosia L. Celosia 1.36–4.05
Celtis L. Hackberry 0.47–0.53
Cercis L. Redbud 0.12–0.39
Chaenomeles Lindl. Flowering quince 0.20–0.30
Chamaecyparis Spach Falsecypress 0.07–0.39
Chimonanthus praecox Fragrant wintersweet 0.23–0.37
(L.) Link
Chionanthus Lindl. Fringetree 0.13–0.31
Chlorophytum Ker-Gawl. Spider plant 0.25–1.50
Chrysanthemum L. Chrysanthemum 0.29–0.97
Chrysobalanus L. Coco plum 0.25–1.00
Cichorium endiva L. Endive 0.36–2.50
Citrullus lanatus (Thunb.) Watermelon 0.30–3.50
Matsum. & Nakai
Continued
CRC_DK2972_Ch006.qxd 6/14/2006 7:04 AM Page 159
160 Handbook of Plant Nutrition
TABLE 6.1 (
Continued
)
Type of Crop Diagnostic Range (%)
Latin Name Common Name Low Sufficient High
Citrus L. Lime, orange, 0.17–1.00
grapefruit, etc.
Cladrastis Raf. Yellowwood 0.24–0.32
Clematis L. Clematis 0.10–0.18
Clethra L. Summer-sweet 0.59–0.93
Cocculus DC. Laurel-leaf moonseed 0.13–0.21
Codiaeum A. Juss. Croton 0.40–0.75
Coffea L. Coffee 0.25–0.50
Coleus Lour. Coleus 1.27–1.48
Cordyline terminalis (L.) Ti plant 0.23–0.49
Kunth
Coreopsis L. Coreopsis 0.46–0.50
Cornus L. Dogwood 0.23–0.90
Coronilla L. Crownvetch 0.42–0.65
Corylopsis sinensis Hemsl. Chinese winterhazel 0.11–0.21
Corylus L. Hazelnut, Filbert 0.22–0.59
Cotinus Mill. Smoke tree 0.19–0.41
Cotoneaster Medic. Cotoneaster 0.17–0.45
Crassula Thunb. Jade plant 0.33–0.82
Crataegus L. Hawthorn 0.29–0.33
Crossandra Salisb. Crossandra or 0.40–0.60
firecracker flower
Cucumis L. Cantaloupe, honeydew, 0.35–0.80
cucumber
Cucurbita L. Pumpkin, squash 0.30–2.50
Cymbidium Swartz Orchid, cymbidium 0.19–1.00
Cynodon L. Bermuda grass 0.10–0.50
Dactylis L. Orchard grass 0.15–0.30
Daphne odora Thunb. Winter daphne 0.10–0.18
Daucus L. Wild carrot 0.25–0.60
Desmodium Desv. Tick trefoil 0.14–0.17
Dianthus L. Carnation 0.19–1.05
Dicentra Bernh. Dutchman’s breeches, 0.19–0.35
bleeding heart
Dieffenbachia Schott. Dumb cane 0.30–1.30
Digitalis L. Foxglove 0.24–0.40
Diospyros L. Persimmon 0.18–0.74
Dizygotheca N. E. Br. False aralia 0.20–0.40
Draceana L. Dracaena 0.20–1.00
Dypsis Noronha ex Mart. Areca palm 0.20–0.80
Elaeagnus pungens Thunb. Thorny elaeagnus 0.17–0.22
Elaeis Jacq. Oil palm 0.12–0.27 0.23–0.50
Epipremnum Schott. Devil’s ivy 0.30–1.00
Eriobotrya Lindl. Loquat 0.05
Eruca Mill. Arugula 0.28–0.29
Eucalyptus L’Hér. Mindanao gum or bagras 0.13–0.42
Euonymus L. Spindle tree 0.10–0.47
Euphorbia milii Desmoul. Crown-of-thorns 0.25–1.00
Euphorbia pulcherrima Poinsettia 0.20–1.00
Willd. ex Klotzsch
CRC_DK2972_Ch006.qxd 6/14/2006 7:04 AM Page 160
Magnesium 161
TABLE 6.1 (
Continued
)
Type of Crop Diagnostic Range (%)
Latin Name Common Name Low Sufficient High
Fagus L. Beech 0.13–0.36
Feijoa sellowiana O. Berg. Pineapple guava 0.15–0.22
Festuca L. Fescue 0.24–0.35
Ficus L. Fig 0.20–1.00
Forsythia Vahl. Golden-bells 0.12–0.26
Fothergilla L. Witchalder 0.20–0.42
Fragaria L. Strawberry 0.25–0.70
Fraxinus L. Ash 0.17–0.49
Gardenia Ellis Gardenia 0.25–1.00
Gelsemium sempervirens Carolina jasmine 0.13–0.20
(L.) Ait
Geranium L. Cranesbill 0.24–0.37
Gerbera L. Transvaal daisy 0.24–0.63
Ginkgo biloba L. Ginkgo 0.25–0.41
Gladiolus L. Gladiolus 0.50–4.50
Gleditsia L. Honeylocust 0.22–0.35
Glycine max (L.) Merrill Soybean 0.25–1.00
Gossypium L. Cotton 0.30–0.90
Gynura Cass. Royal velvet plant 0.70–0.94
Gypsophila L. Baby’s breath 0.40–1.30
Halesia L. Silverbell 0.14–0.37
Hamamelis L. Witchhazel 0.15–0.18
Hedera L. Ivy 0.15–0.70
Helianthus annuus L. Sunflower 0.25–1.00
Heliconia L. Parrot flower 0.33–0.74
Heliotropium L. Heliotrope 0.57–0.73
Helleborus L. Lenten rose 0.21–0.33
Hemerocallis L. Daylily 0.13–0.38
Heuchera L. Alumroot 0.20–0.30
Hibiscus syriacus L. Rose-of-Sharon 0.36–1.12
Hordeum L. Barley 0.15–0.40
Hosta Tratt. Hosta 0.11–0.51
Hydrangea L. Hydrangea 0.22–0.70
Hypericum L. St. Johnswort 0.18–0.35
Iberis L. Candytuft 0.36–0.53
Ilex L. Holly 0.16–1.00
Illicium L. Anise-tree 0.11–0.32
Impatiens L. Impatiens, New Guinea 0.30–3.64
Ipomoea batatas L. Lam. Sweet potato 0.35–1.00
Iris L. Iris 0.17–0.45
Itea virginica L. Sweetspire 0.13–0.20
Ixora L. Flame-of-the-woods or 0.20–1.00
Indian jasmine
Jasminum L. Jasmine 0.25–1.00
Juglans L. Walnut 0.29–1.01
Juniperus L. Juniper 0.08–0.41
Kalanchoe Adans. Kalanchoe 0.24–1.50
Kalmia L. Laurel 0.11–0.98
Kerria DC. Japanese rose 0.35–0.41
Continued
CRC_DK2972_Ch006.qxd 6/14/2006 7:04 AM Page 161
162 Handbook of Plant Nutrition
TABLE 6.1 (
Continued
)
Type of Crop Diagnostic Range (%)
Latin Name Common Name Low Sufficient High
Koelreuteria Laxm. Goldenraintree 0.21–0.31
Lactuca sativa L. Lettuce 0.24–3.50
Lagerstroemia L. Crepe myrtle 0.23–0.72
Larix Mill. Larch 0.11–0.15
Leea L. West Indian holly 0.25–0.80
Leucothoe D. Don Fetterbush 0.23–0.32
Liatris Gaertn. ex Schreb. Gayfeather 0.41–0.45
Ligustrum L. Privet 0.13–0.32
Lilium L. Lily, Asiatic 0.19–0.70
Limonium Mill. Statice, sea lavender 0.50–2.13
Lindera Thunb. Spicebush 0.16–0.49
Liquidambar L. Sweetgum 0.19–0.53
Liriope Lour. Lily-turf 0.10–0.49
Litchi Sonn. Lychee fruit 0.20–0.40
Lolium L. Ryegrass 0.16–0.32
Lonicera L. Honeysuckle 0.20–0.48
Loropetalum R. Br. Fringeflower 0.13–0.20
Lotus L. Bird’s-foot trefoil 0.40–0.60
Lycopersicon lycopersicum Tomato 0.30–2.50
(L.) Karst. ex Farw.
Lysimachia L. Loosestrife 0.28–0.54
Macadamia F. J. Muell. Macadamia nut 0.08–0.30
Magnolia L. Magnolia 0.12–0.45
Mahonia Nutt. Oregon holly 0.11–0.25
Malpighia glabra L. Barbados cherry 0.25–0.80
Malus Mill. Apple 0.01–0.47 0.12–0.72
Mandevilla Lindl. Mandevilla 0.25–0.50
Mangifera L. Mango 0.20–0.50
Manihot Mill. Cassava 0.25–0.60
Maranta L. Prayer plant 0.25–1.00
Medicago L. Alfalfa or lucerne 0.30–1.00
Metasequoia glyptostroboides Dawn redwood 0.24–0.31
H. H. Hu & Cheng.
Monstera Adans. Swiss-cheese plant or 0.25–0.65
Mexican breadfruit
Murraya paniculata (L.) Jack Orange jasmine 0.25–0.40
Musa L. Banana 0.04–0.09 0.25–0.80
Myrica cerifera L. Wax myrtle 0.11–0.35
Nandina Thunb. Heavenly bamboo 0.11–0.24
Nasturtium officinale R. Br. Watercress 1.00–2.00
Nephrolepis Schott. Sword fern 0.20–1.20
Nicotiana L. Tobacco 0.20–0.86
Nyssa L. Tupelo 0.23–0.51
Olea L. Olive 0.20–0.60
Ophiopogon Ker-Gawl. Mondo grass 0.15–0.67
Oryza sativa L. Rice 0.15–0.30
Osmanthus Lour. Devilweed 0.08–0.29
Ostyra Scop. Hornbeam 0.11–0.54
Oxydendrum DC. Sourwood 0.24–0.29
Pachysandra Michx. Spurge 0.16–0.73
Pandanus L. Screwpine 0.22–0.35
CRC_DK2972_Ch006.qxd 6/14/2006 7:04 AM Page 162
Magnesium 163
TABLE 6.1 (
Continued
)
Type of Crop Diagnostic Range (%)
Latin Name Common Name Low Sufficient High
Pandanus L. Screwpine 0.22–0.35
Panicum L. Switchgrass 0.14–0.33
Parrotia C.A. Mey. Persian ironwood 0.09–0.17
Parthenocissus Planch. Woodbine 0.14–0.33
Passiflora L. Passionfruit 0.25–0.35
Pelargonium zonale L. Geranium, Zonal 0.19–0.51
Pennisetum L. Fountain grass 0.18–0.19
Peperomia Ruiz & Pav. Peperomia 0.24–1.50
Persea Mill. Avocado 0.25–0.80
Petunia Juss. Petunia 0.36–1.37
Phalaenopsis Blume. Orchids, moth 0.40–1.07
Phalaris arundinacea L. Ribbon grass 0.19–0.22
Phaseolus L. Bean 0.25–1.00
Philodendron Schott. Philodendron 0.25–1.80
Phleum L. Timothy 0.16–0.25
Phlox L. Phlox 0.16–0.57
Photinia Lindl. Photinia 0.17–0.30
Picea A. Dietr. Spruce 0.08–0.63
Pieris D. Don Lily-of-the-valley bush 0.14–0.23
Pilea Lindl. Aluminum plant 0.53–1.80
Pinus L. Pine 0.09–0.50
Pistacia L. Pistachio, Mastic 0.18–1.25
Pisum L. Pea 0.27–0.70
Pittosporum Banks ex Gaertn. Mock orange 0.18–0.75
Platanus L. Sycamore 0.15–0.30
Platycodon A. DC. Balloonflower 0.28–0.32
Poa L. Bluegrass 0.13–0.37
Podocarpus L’Hér. Yew-pine 0.25–0.80
Polyscias J. R. Forst & G. Forst Ming aralia 0.43–0.47
Populus L. Cottonwood 0.14–0.72
Prunus L. Apricot, cherry, 0.25–1.20
plum, almond,
peach, nectarine
Psidium L. Guava 0.25–0.50
Pulmonaria L. Lungwort 0.18–0.27
Pyracantha M. J. Roem. Firethorn 0.22–0.23
Pyrus L. Pear 0.05 0.21–0.80
Quercus L. Oak 0.09–0.42
Rhapis L.f. Lady palm 0.20–0.30
Rhododendron L. Azalea 0.14–1.00
Rhus L. Sumac 0.18–0.27
Ribes L. Currant, gooseberry, 0.20–0.50
Rosa L. Rose, hybrid tea 0.22–0.64
Rosmarinus officinalis L. Rosemary 0.17–0.40
Rubus L. Blackberry, raspberry 0.25–0.80
Rudbeckia L. Coneflower 0.51–0.69
Ruscus aculeatus L. Butcher’s broom 0.16–0.17
Saccharum officinarum L. Sugarcane 0.10–0.20
Saintpaulia H. Wendl. African violet 0.35–0.85
Salix L. Willow 0.15–0.35
Continued
CRC_DK2972_Ch006.qxd 6/14/2006 7:04 AM Page 163
164 Handbook of Plant Nutrition
TABLE 6.1 (
Continued
)
Type of Crop Diagnostic Range (%)
Latin Name Common Name Low Sufficient High
Salvia L. Sage 0.25–0.86
Sansevieria Thunb. Mother-in-law tongue 0.30–1.40
Sarcococca Lindl. Sweetbox 0.24–0.55
Saxifraga L. Strawberry begonia 0.45–0.66
Schefflera J. R. Forst & Umbrella or octopus tree 0.25–1.00
G. Forst
Schlumbergera Lem. Christmas cactus 0.40–2.00
Secale cereale L. Rye 0.35–0.56
Sedum L. Stonecrop 0.24–0.67
Sinningia Nees Gloxinia 0.35–0.70
Solanum melongena L. Eggplant 0.30–1.00
Solanum tuberosum L. Potato 0.50–2.50
Solidago L. Goldenrod 0.30–0.43
Sophora L. Pagoda tree, mescal 0.27–0.40
Sorghum Moench. Sorghum 0.10–0.50
Spathiphyllum Schott. Peace lily 0.20–1.00
Spigelia marilandica L Indian pink 0.57–1.43
Spinacia oleracea L. Spinach 0.60–1.80
Spiraea L. Bridal-wreath 0.11–0.38
Stachys byzantina C. Koch Lamb’s ears 0.28–0.31
Stenotaphrum secundatum St. Augustine grass 0.15–0.25
(Walt.) O. Kuntze
Stewartia L. Stewartia 0.26–0.34
Strelitzia Ait. Bird-of-paradise 0.18–0.75
Stromanthe Sond. Stromanthe 0.30–0.50
Styrax L. Snowbell 0.08–0.24
Syringa L. Lilac 0.20–0.40
Tagetes L. Marigold 1.33–1.56
Taxodium L. Rich. Baldcypress 0.19–0.27
Taxus L. Yew 0.16–0.30
Ternstroemia Mutis ex L.f. False cleyera 0.29–0.33
Teucrium L. Wall germander 0.05–0.14
Thalictrum L. Meadow-rue 0.26–0.31
Theobroma cacao L. Cocoa or chocolate 0.20–0.50
Thuja L. Arborvitae 0.09–0.39
Thymus L. Thyme 0.29–0.40
Tilia L. Basswood 0.18–0.81
Torenia L. Wishbone flower 0.90–0.93
Trachelospermum Lem. Star jasmine 0.18–0.28
Tradescantia L. Spiderwort 0.33–1.32
Trifolium L. Clover 0.20–0.60
Tripogandra Raf. Tahitian bridal-veil or 0.42–0.46
fern–leaf inch plant
Triticum L. Wheat 0.15–1.00
Tsuga Carrière. Hemlock 0.16–0.26
Ulmus L. Elm 0.22–0.58
Vaccinium L. Blueberry, cranberry 0.12–0.40
Verbena L. Verbena 0.53–1.58
Veronica L. Speedwell 0.23–0.72
Viburnum L. Arrowwood 0.15–1.00
CRC_DK2972_Ch006.qxd 6/14/2006 7:04 AM Page 164
TABLE 6.1 (
Continued
)
Type of Crop Diagnostic Range (%)
Latin Name Common Name Low Sufficient High
Vigna unguiculata ssp. Black-eyed pea 0.30–0.50
unguiculata (L.) Walp.
Vinca L. Periwinkle 0.17–0.47
Viola L. Pansy 0.36–0.49
Vitex L. Chaste tree 0.22–0.33
Vitis L. Grape 0.13–1.50
Yucca L Soft yucca 0.20–1.00
Zamia L. Coontie fern 0.22–0.26
Zea L. Corn or maize 0.13–1.00
Zelkova Spach. Saw-leaf 0.13–0.20
Zingiber Boehmer. Ginger 0.35–0.47
Zoysi Willd. Zoysiagrass 0.11–0.15
Magnesium 165
6.5 ASSESSMENT OF MAGNESIUM IN SOILS
6.5.1 F
ORMS OF MAGNESIUM IN SOILS
Approximately 1.3, 4.7, and 4.3% of the earth’s continental upper layer, lower layer, and the ocean
crust is made up of magnesium, respectively (202). However, in surface soils, magnesium concen-
trations usually range from 0.03 to 0.84%, with sandy soils typically having the lowest magnesium
concentrations (Ϸ0.05%), and clay soils containing the highest magnesium concentrations
(Ϸ0.50%) (10,29). Like other metallic elements, the soil magnesium pool consists of three frac-
tions: nonexchangeable, exchangeable, and water-soluble fractions. The nonexchangeable fraction
consists of the magnesium present in the primary minerals and many of the secondary clay miner-
als (Table 6.2) (29). In many cases these compounds may be hydrated with one to several water
molecules. The exchangeable fraction may make up approximately 5% of the total magnesium in
the soil, accounting for 4 to 20% of the cation-exchange capacity of the soil (29). Magnesium con-
centrations in the soil solution typically range from 0.7 to 7.0 mM, but may be as high as 100 mM,
with the soil solutions of acid soils generally having a lower magnesium concentration (about
2.0 mM) than soil solutions derived from neutral soils (about 5.0 mM) (29,203–207).
6.5.2 SODIUM ABSORPTION RATIO
Magnesium is also an important component in evaluating the sodium absorption ratio (SAR) of irri-
gation waters and soil extracts. The SAR is calculated as
SAR ϭ (Na
ϩ
)/͙(Ca
2ϩ
ϩ Mg
2ϩ
)/2
In this equation, the concentrations of sodium (Na
ϩ
), calcium (Ca
2ϩ
), and magnesium (Mg
2ϩ
) ions
are expressed in meq L
Ϫ1
. When concentrations of magnesium, calcium, or both elements are
increased, relative to sodium, the SAR decreases. Many soils in arid climates are affected by SAR
in that as the SAR increases, the permeability of the soil decreases since the sodium reacts with clay,
causing soil particles to disperse resulting in reduced water penetration into the soil (208). In most
cases, a soil is considered sodic when the SAR Ͼ 13 (209). However, at lower SAR values, some
crops may still be susceptible to the adverse effects of sodium on nutrient uptake rather than to the
physiochemical effects on soil permeability.
CRC_DK2972_Ch006.qxd 6/14/2006 7:04 AM Page 165
TABLE 6.2
Primary and Secondary Minerals, Nonminerals, and Gems Containing
Magnesium
Magnesium
Name Chemical Formula Concentration (%)
Actinolite Ca
2
(Mg, Fe)
5
Si
8
O
22
(OH)
2
15
Adelite CaMg(AsO
4
)(OH) 11
Admontite MgB
6
O
10
·7H
2
O6
Amesite (Serpentine Group) Mg
2
Al(SiAl)O
5
(OH)
4
–
Amianthus See Parachrysotile –
Ankerite Ca(Fe, Mg, Mn)(CO
3
)
2
13
Anthophyllite Mg
7
Si
8
O
22
(OH)
2
22
Antigorite See Genthite –
Arfvedsonite Na
3
(Fe, Mg)
4
FeSi
8
O
22
(OH)
2
12
Artinite Mg
2
(CO
3
)(OH)
2
·3H
2
O25
Asbestos See Tremolite –
Ascharite See Camsellite –
Astrakanite MgSO
4
·Na
2
SO
4
·4H
2
O7
Augite (Ca, Na)(Mg, Fe, Al, Ti)(Si, Al)
2
O
6
12
Axinite See Magnesio-axinite –
Bayleyite Mg
2
(UO
2
)(CO
3
)
3
·18H
2
O6
Benstonite (Ba, Sr)
6
(Ca, Mn)
6
Mg(CO
3
)
13
2
Berthierine (Serpentine Group) (Fe, Fe, Mg)
2
(Si, Al)
2
O
5
(OH)
4
–
Bischofite MgCl
2
и6H
2
O12
Biotite K(Mg, Fe)
3
(Al, Fe)Si
3
O
10
(OH, F)
2
17
Blodite Na
2
Mg(SO
4
)
2
·4H
2
O7
Boracite Mg
3
B
7
O
13
Cl 19
Botryogen MgFe(SO
4
)
2
(OH)·7H
2
O6
Boussingaultite (NH
4
)
2
Mg(SO
4
)
2
·6H
2
O7
Brandesite See Seybertite –
Brindleyite (Serpentine Group) See Nimesite –
Bronzite See Hypersthene –
Brucite Mg(OH)
2
42
Calciotalc See Seybertite –
Camsellite See Szaibelyite –
Carnallite KMgCl
3
·6(H
2
O) 9
Caryopilite (Serpentine Group) (Mn, Mg)
3
Si
2
O
5
(OH)
4
4
Cebollite
a
Ca
2
(Mg, Fe, Al)Si
2
(O, OH)
7
9
Chlorite
b
(Mg, Fe)
6
(AlSi
3
)O
10
(OH)
8
26
Chloritoid (Fe, Mg, Mn)
2
Al
4
Si
2
O
10
(OH)
4
11
Chlorophoenicite (Mn, Mg)
3
Zn
2
(AsO
4
)(OH, O)
6
13
Chrysolite See Olivine –
Clinochlore (Mg, Fe)
5
Al(Si
3
Al)O
10
(OH)
8
22
(see Colerainite)
Clinochrysotile (Serpentine See Deweylite –
Group)
Clinoenstatite Mg
2
Si
2
O
6
24
Clintonite See Xanthophyllite –
Colerainite
c
4MgOиAl
2
O
3
·2SiO
2
·5H
2
O21
Collinsite Ca
2
(Mg, Fe)(PO
4
)
2
·2H
2
O7
Cordierite Mg
2
Al
4
Si
5
O
18
8
Corrensite (Ca, Na, K)(Mg, Fe, Al)
9
23
(Si, Al)
8
O
20
(OH)
10
·H
2
O
Crossite Na
2
(Mg, Fe)
3
(Al, Fe)
2
Si
8
O
22
(OH)
2
9
Cummingtonite (Mg, Fe)
7
Si
8
O
22
(OH)
2
22
Deweylite
d
Mg
3
Si
2
O
5
(OH)
4
4
Dickinsonite (K, Ba)(Na, Ca)
5
(Mn, Fe, 20
Mg)
14
Al(PO
4
)
12
(OH, F)
2
166 Handbook of Plant Nutrition
CRC_DK2972_Ch006.qxd 6/14/2006 7:04 AM Page 166
TABLE 6.2 (
Continued
)
Magnesium
Name Chemical Formula Concentration (%)
Diopsode CaMgSi
2
O
6
11
Dolomite CaMg(CO
3
)
2
13
Dypingite Mg
5
(CO
3
)
4
(OH)
2
·5H
2
O25
Edenite NaCa
2
(Mg, Fe)
5
Si
7
AlO
22
(OH)
2
15
Elbaite Na(Al, Fe, Li, 7
Mg)
3
B
3
Al
3
(Al
3
Si
6
O
27
)(O, OH, F)
4
Enstatite Mg
2
Si
2
O
6
24
Epsomite MgSO
4
·7H
2
O10
Falcondoite See Genthite –
Fayalite See Hortonolite –
Ferrierite (Na, K)
2
Mg(Si, Al)
18
O
36
(OH)·9H
2
O2
Fluoborite Mg
3
(BO
3
)(F, OH)
3
40
Forsterite Mg
2
SiO
4
35
Gageite (Mn, Mg, Zn)
42
Si
16
O
54
(OH)
40
34
Galaxite (Mn, Fe, Mg)(Al, Fe)
2
O
4
17
Ganophyllite (K, Na)
2
(Mn, Al, Mg)
8
15
(Si, Al)
12
O
29
(OH)
7
·8-9H
2
O
Garnierite
e
(Ni, Mg)
3
Si
2
O
5
(OH)
4
26
Genthite
f
2NiO·2MgO·3SiO
2
·6H
2
O9
Glauconite (K, Na)(Fe, Al, Mg)
2
(Si, Al)
4
O
10
(OH)
2
13
Glaucophane Na
2
(Mg, Fe)
3
Al
2
Si
8
O
22
(OH)
2
9
Gordonite MgAl
2
(PO
4
)
2
(OH)
2
·8H
2
O5
Griffithite 4(Mg, Fe, Ca)O·(Al, Fe)
2
O
3
·5SiO
2
·7H
2
O14
Griphite Na
4
Li
2
Ca
6
(Mn, Fe, 13
Mg)
19
Al
8
[(F,OH)(PO
4
)
3
]
8
Grunerite (Fe, Mg)
7
Si
8
O
22
(OH)
2
24
Harkerite Ca
24
Mg
8
Al
2
Si
8
(O,OH)
32
(BO
3
)
8
7
(CO
3
)
8
(H
2
O, Cl)
Hastingsite NaCa
2
(Fe, Mg)
4
Fe(Si
6
Al
2
)O
22
(OH)
2
12
Hectorite Na
0
.
3
(Mg, Li)
3
Si
4
O
10
(F, OH)
2
19
Hexahydrite MgSO
4
·6H
2
O11
Högbomite (Mg, Fe)
2
(Al, Ti)
5
O
10
14
Holdenite (Mn, Mg)
6
Zn
3
(AsO
4
)
2
(SiO
4
)(OH)
8
17
Hornblende Ca(Mg, Fe)
4
AlSi
7
AlO
22
(OH)
2
13
Hortonolite
g
(Fe, Mg, Mn)
2
SiO
4
35
Hulsite (Fe, Mg)
2
(Fe, Sn)BO
5
25
Huntite CaMg
3
(CO
3
)
4
21
Hydroboracite CaMgB
6
O
8
(OH)
6
·3H
2
O6
Hydromagnesite Mg
5
(CO
3
)
4
(OH)
2
·4H
2
O26
Hydrotalcite Mg
6
Al
2
(CO
3
)(OH)
16
·4H
2
O24
Hypersthene
h
(Fe, Mg)SiO
3
24
Iddingsite MgO·Fe
2
O
3
·3SiO
2
·4H
2
O5
Jurupaite
i
(Ca, Mg)
6
Si
6
O
17
(OH)
2
24
Kainite MgSO
4
·KCl·3H
2
O10
Kammererite-Red See Colerainite –
Kerolite
j
(Mg, Ni)
3
Si
4
O
10
(OH)
2
·H
2
O18
Kieserite MgSO
4
·H
2
O18
Kurchatovite Ca(Mg, Mn, Fe)B
2
O
5
15
Landesite (Mn, Mg)
9
Fe
3
(PO
4
)
8
(OH)
3
·9H
2
O16
Langbeinite K
2
Mg
2
(SO
4
)
3
13
Lansfordite MgCO
3
·5H
2
O14
Lazulite MgAl
2
(PO
4
)
2
(OH)
2
8
Leonite K
2
Mg(SO
4
)
2
·4H
2
O7
Lizardite (Serpentine Group) See Clinochrysotile –
Löweite Na
12
Mg
7
(SO
4
)
13
·15H
2
O9
Continued
Magnesium 167
CRC_DK2972_Ch006.qxd 6/14/2006 7:04 AM Page 167
TABLE 6.2 (
Continued
)
Magnesium
Name Chemical Formula Concentration (%)
Ludwigite Mg
2
FeBO
5
(see Magnesioludwigite) 25
Magnesio-axinite
k
Ca
2
MgAl
2
BO
3
Si
4
O
12
(OH) 5
Magnesioludwigite
l
3MgO·B
2
O
3
·MgOиFe
2
O
3
25
Magnesite MgCO
3
30
Mcgovernite Mn
9
Mg
4
Zn
2
As
2
Si
2
O
17
(OH)
14
7
Meerschaum
m
Mg
4
Si
6
O
15
(OH)
2
·6H
2
O15
Melilite (Ca, Na)
2
(Al, Mg)(Si, Al)
2
O
7
10
Merwinite Ca
3
Mg(SiO
4
)
2
7
Monticellite CaMgSiO
4
16
Montmorillonite (Na, Ca)
0
.
33
(Al, Mg)
2
Si
4
O
10
(OH)
2
·nH
2
O13
Mooreite (Mg, Zn, Mn)
15
(SO
4
)
2
(OH)
26
·8H
2
O32
Népouite See Garnierite –
Nesquehonite Mg(HCO
3
)(OH)·2H
2
O18
Nimesite
n
(Serpentine Group) (Ni, Mg, Fe)
2
Al(Si, Al)
5
(OH)
4
6
Norbergite Mg
3
(SiO
4
)(F,OH)
2
37
Northupite Na
3
Mg(CO
3
)
2
Cl 10
Novacekite Mg(UO
2
)
2
(AsO
4
)
2
·12H
2
O2
Odinite (Serpentine Group) (Fe, Mg, Al, Fe, Ti, Mn)
2
.
4
22
(Si, Al)
2
O
5
(OH)
4
Olivine
o
(Mg, Fe)
2
SiO
4
35
Orthoantigorite See Lizardite –
(Serpentine Group)
Orthochrysotile
p
Mg
3
Si
2
O
5
(OH)
4
26
(Serpentine Group)
Parachrysotile
p
Mg
3
Si
2
O
5
(OH)
4
–
(Serpentine Group)
Pargasite NaCa
2
(Mg, Fe)
4
Al(Si
6
Al
2
)O
22
(OH)
2
12
Penninite
q
(Fe, Mg)
5
Al(Si
3
Al)O
10
(OH)
8
22
Periclase MgO 60
Peridot See Olivine –
Phlogopite KMg
3
(Si
3
Al)O
10
(F,OH)
2
17
Pickeringite MgAl
2
(SO
4
)
4
·22H
2
O3
Picromerite See Schoenite –
Pimelite See Kerolite –
Polyhalite K
2
Ca
2
Mg(SO
4
)
4
·2H
2
O4
Prochlorite See Penninite –
Pyrope Mg
3
Al
2
(SiO
4
)
3
18
Rabbittite Ca
3
Mg
3
(UO
2
)
2
(CO
3
)
6
(OH)
4
·18H
2
O5
Ralstonite (Na)x(Mg)x(Al)(2Ϫx)(F,OH)
6
·H
2
O13
Redingtonite (Fe, Mg, Ni)(Cr, Al)
2
(SO
4
)
4
·22H
2
O3
Rhodonite (Mn, Fe, Mg, Ca)SiO
3
24
Riebeckite Na
2
(Fe, Mg)
3
Fe
2
Si
8
O
22
(OH)
2
9
Ripidolite See Penninite –
Roscoelite K(V, A, Mg)
2
AlSi
3
O
10
(OH)
2
12
Saleeite Mg(UO
2
)
2
(PO
4
)
2
·10H
2
O3
Saponite Ca
0
.
25
(Mg, Fe)
3
(Si, 18
Al)
4
O
10
(OH)
2
·nH
2
O
Sapphirine (Mg, Al)
8
(Al, Si)
6
O
20
29
Sarcopside (Fe, Mn, Mg)
3
(PO
4
)
2
28
Schoenite
r
K
2
Mg(SO
4
)
2
·6H
2
O4
Sepiolite See Meerschaum 15
Serpentine (Mg, Fe)
3
Si
2
O
5
(OH)
4
26
Seybertite
s
Ca(Mg, Al)
3
(Al
3
Si)O
10
(OH)
2
18
Sheridanite See Penninite –
Sklodowskite Mg(UO
2
)
2
(SiO
3
OH)
2
·5H
2
O3
168 Handbook of Plant Nutrition
CRC_DK2972_Ch006.qxd 6/14/2006 7:04 AM Page 168
TABLE 6.2 (
Continued
)
Magnesium
Name Chemical Formula Concentration (%)
Spadaite MgSiO
2
(OH)
2
·H
2
O18
Spinel MgAl
2
O
4
17
Staurolite (Fe, Mg, Zn)
2
Al
9
(Si, Al)
4
O
22
(OH)
2
6
Stevensite (Ca, Na)
x
Mg
3
Si
4
O
10
(OH)
2
18
Stichtite Mg
6
Cr
2
(CO
3
)(OH)
16
·4H
2
O22
Stilpnomelane K(Fe, Mg)
8
(Si, Al)
12
(O,OH)
27
20
Swartzite CaMg(UO
2
)(CO
3
)
3
·12H
2
O3
Szaibelyite
t
MgBO
2
(OH) 29
Tachyhydrite CaMg
2
Cl
6
·12H
2
O9
Taeniolite KLiMg
2
Si
4
O
10
F
2
12
Talc Mg
3
Si
4
O
10
(OH)
2
19
Tilasite CaMg(AsO
4
)F 11
Tremolite
p
Ca
2
(Mg, Fe)
5
Si
8
O
22
(OH)
2
15
Triplite (Mn, Fe, Mg, Ca)
2
(PO
4
)(F,OH) 30
Tychite Na
6
Mg
2
(CO
3
)
4
(SO
4
)9
Uvite (Ca, Na)(Mg, 10
Fe)
3
Al
5
Mg(BO
3
)
3
Si
6
O
18
(OH, F)
4
Vanthoffite Na
6
Mg(SO
4
)
4
4
Vesuvianite Ca
10
(Mg, Fe)
2
Al
4
Si
9
O
34
(OH)
4
3
Vosenite 3(Fe, Mg)O·B
2
O
3
·FeO·Fe
2
O
3
19
Wagnerite (Mg, Fe)
2
(PO
4
)F 30
Xanthophyllite
u
Ca(Mg, Al)
3
(Al
3
Si)O
10
(OH)
2
18
Xonotlite See Jurupaite and Stevensite –
Note: The concentration of magnesium in these products is calculated from the chemical formula. The
magnesium concentration presented in the table is based on the highest amount of magnesium possible in
the compound (when magnesium occupies all potential sites in the formula).
a
Cebollite (synonym: Cebollit or Cebollita) may be referred to as Ca
5
Al
2
(SiO
4
)
3
(OH)
4
with no Mg.
b
There are several different minerals apart from the Chlorite group of minerals.
c
Colerainite may be referred to as a synonym for Clinochlore.
d
Deweylite may be referred to as a synonym for Clinochrysotile and Lizardite.
e
Népouite may be referred to as a synonym for Garnierite with the same chemical formula and it may also
be referred to as Falcondoite as a synonym for Garnierite and Genthite with different chemical formulas.
f
Antigorite may be referred to as a synonym for Genthite with the chemical formula (Mg, Fe)
3
Si
2
O
5
(OH)
4
.
g
Fayalite may be referred to as a synonym for Hortonolite.
h
Bronzite may be referred to as a synonym for Hypersthene.
i
Mg-bearing Xonotlite may be referred to as a synonym for Jurupaite or Stevensite with different chemi-
cal formulas.
j
Kerolite (Ni) may be referred to as a synonym for Pimelite.
k
Axinite may be referred to as a synonym for Magnesio-axinite.
l
Ludwigite may be referred to as a synonym for Magnesioludwigite but with chemical formula Mg
2
FeBO
5
.
m
Sepiolite may be referred to as a synonym for Meerschaum.
n
Nimesite may be referred to as a synonym for Brindley
o
Olivine may be referred to as a synonym for Peridot or Chrysolite-light yellowish green.
p
Tremolite, Orthochrysotile, and Parachrysotile are occasionally referred to as Asbestos.
q
Colerainite, Kammererite–Red, Pennine, Prochlorite, Ripidolite, Sheridanite may all be referred to as syn-
onyms for Penninite.
r
Schoenite may be referred to as synonym for Picromerite.
s
Brandesite, Calciotalc, Seybertite, and Xanthophyllite may be referred to as synonyms for Seybertite.
t
Camsellite may be referred to as synonym for Szaibelyite and Ascharite.
u
Clintonite, Brandesite, Calciotalc, and Seybertite may be referred to as synonyms for Xanthophyllite.
Magnesium 169
CRC_DK2972_Ch006.qxd 6/14/2006 7:04 AM Page 169