Encyclopedia Of Animal Science - W doc
Bạn đang xem bản rút gọn của tài liệu. Xem và tải ngay bản đầy đủ của tài liệu tại đây (1.54 MB, 22 trang )
rumen; the remaining proportion is presumably directed to
the omasum. Within the remainder of the ruminant gut,
quantitative net water absorption is greatest in the
proximal small intestine, followed by the omasum and
large intestine.
[5]
Recent data
[6]
indicate that the lower net
water absorption in the large intestine by cattle than by
sheep results from a reduced ability to retain absorbed
water because more absorbed solvent/solute is drawn back
into the lumen through the larger paracellular pores
between colonic cells in cattle.
TRANSPORTATION-INDUCED
DEHYDRATION
Transport of animals on semitrailer trucks from the site of
birth to the site of growing and finishing can involve
periods of up to 24 hours or more without access to water,
and variable magnitudes of dehydration can occur. Feeder
calves seem to lose approximately 3.3% of body weight
during the loading and unloading process and can lose an
additional 0.3 to 0.4% of body weight/hour of trans-
port.
[7,8]
Weight losses of feeder pigs during transport can
be up to 0.6% of body weight/hour.
[9]
Loss of gastroin-
testinal tract contents and carcass weight has accounted
for 48 and 32%, respectively, of transport shrink by feeder
steers
[8]
and has accounted for 62 and 27%, respectively,
of transport weight loss by feeder pigs. Feces, urine, and
respiration accounted for 12.6, 26, and 60% of the water
loss.
[10]
Water accounted for 80% of weight lost by
wethers during 48 hours of feed and water deprivation.
[11]
Of total body water loss, 57% was from the intracellular
compartment and 29% was from the gastrointestinal tract.
In steers deprived of water for 4 days, thiocyanate space
(assumed to be extracellular space) accounted for 47% of
the weight lost (total loss=16% of body weight).
[12]
Thiocyanate space decreased 23% and plasma volume
decreased 28% during the 4-day period without water. The
exchange of water within the body in response to
dehydration is depicted in Fig. 2.
Water Mineral Composition
Drinking water is a source of various minerals that are
generally readily available for absorption unless com-
plexed by an interfering nutrient. Minerals ingested in
water and feed are a variable mix of positively and
negatively charged ions that contribute to the dietary
cation anion difference of consumed material (DCAD)
and have a direct influence on fluid and acid base
balance. The DCAD is calculated as the milliequivalents
(mEq) of Na
+
,K
+
,Ca
++
, and Mg
++
minus the mEq of Cl
À
,
S
=
, and P
=
.
[13]
As anion consumption and concentration in
the body increase, cellular acidosis can occur. As the
DCAD increases from negative to positive (e.g., À20 to
+100 mEq/kg), feed intake and performance are generally
increased. However, the prepartum dairy cow is one
exception to the generalization. Inducing mild metabolic
acidosis by feeding anionic diets before calving has been
an effective means of preventing milk fever by potenti-
ating calcium resorption from bone before the dramatic
calcium needs at parturition arise.
[13]
Few data are available on the contribution of water
minerals to overall DCAD. Socha et al.
[14]
reported
average mineral profiles of more than 3600 drinking water
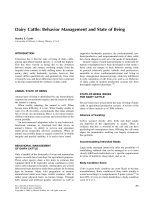
Fig. 2 Water change between body compartments during
dehydration. Water is osmotically drawn from transcellular and
intracellular compartments to interstitial and plasma compart
ments during dehydration, in response to losses by urinary and
fecal excretion and insensible routes. The magnitude of
reduction in compartmental volumes is dependent on the degree
of dehydration.
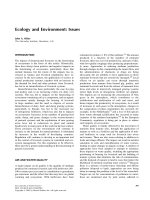
Fig. 1 Typical body water compartments (% of total body
water).
872 Water
samples collected across the United States. Assuming that
a growing feedlot steer weighing approximately 300 kg
and consuming 9 kg of a mixed diet (>85% dry matter)
meeting mineral requirements would drink 30 L of water/
day,
[2]
this steer would consume twice as much weight in
water compared to the weight of feed consumed, and
approximately 3 to 7% of calcium, sodium, and sulfur
consumed would be derived from water. However, ap-
proximately 20% of chloride consumed would be derived
from drinking water in this example. The DCAD cal-
culated for the surveyed samples
[14]
was approximately
0.4 mEq/kg. Estimates of the contribution of drinking
water minerals to overall DCAD are needed.
CONCLUSION
The polarity and ability of water to facilitate hydration of
polar and ionic molecules are central to the flow of water
and metabolites within the body. Saliva appears to be a
greater proportion of ruminal fluid than previously
thought, considering recent observations that some water
consumed by drinking in nonsuckling cattle bypasses the
rumen, but more intensive study is needed. The ability of
sheep to form drier feces than cattle results from tighter
junctions between colonic cells and a greater ability to
establish an osmotic gradient to retain absorbed water.
Cattle may lose approximately 3% of body weight during
loading and unloading for transport, plus an additional 0.3
to 0.4% of body weight per hour of transport. Indirect data
suggest that water may constitute up to 80% of this weight
loss. Estimates of the contribution of drinking water
minerals to overall cation anion difference and of the
influence of water cation anion difference on animal
performance are needed.
REFERENCES
1. Bohinsky, R.C. Modern Concepts in Biochemistry, 5th Ed.;
Allyn and Bacon, Inc.: Boston, MA, 1987.
2. Parker, D.B.; Brown, M.S. Water Consumption for
Livestock and Poultry Production. In Encyclopedia of
Water Science, 1st Ed.; Stewart, B.A., Howell, T.A., Eds.;
Marcel Dekker, Inc.: New York, NY, 2003.
3. Christopherson, R.J.; Webster, A.J.F. Changes during
eating in oxygen consumption, cardiac function and body
fluids of sheep. J. Physiol. 1972, 221, 441 457.
4. Zorrilla Rios, J.J.; Garza, D.; Owens, F.N. Fate of
Drinking Water in Ruminants: Simultaneous Comparison
of Two Methods to Estimate Ruminal Evasion; Animal
Science Research Report MP 129; Oklahoma Agricultural
Experiment Station: Stillwater, OK, 1990; 167 169.
5. Sklan, D.; Hurwitz, S. Movement and absorption of major
minerals and water in ovine gastrointestinal tract. J. Dairy
Sci. 1985, 68, 1659 1666.
6. McKie, A.T.; Goecke, I.A.; Naftalin, R.J. Comparison of
fluid absorption by bovine and ovine descending colon in
vitro. Am. J. Physiol. 1991, 261, G433 G442.
7. Bartle, S.J.; Preston, R.L. Feedlot Cattle Receiving
Experiments, 1988 89; Animal Science Research Report
# T 5 263; Texas Tech University: Lubbock, TX, 1989;
28 30.
8. Self, H.L.; Gay, N. Shrink during shipment of feeder cattle.
J. Anim. Sci. 1972, 35, 489 494.
9. Jesse, G.W.; Weiss, C.N.; Mayes, H.F.; Zinn, G.M. Effect
of marketing treatments and transportation on feeder pig
performance. J. Anim. Sci. 1990, 68, 611 617.
10. Mayes, H.F.; Hahn, G.L.; Becker, B.A.; Anderson, M.E.;
Nienaber, J.A. A report on the effect of fasting and
transportation on liveweight losses, carcass weight losses
and heat production measures of slaughter hogs. Appl.
Eng. Agric. 1988, 4, 254 258.
11. Cole, N.A. Influence of a three day feed and water
deprivation period on gut fill, tissue weights, and tissue
composition in mature wethers. J. Anim. Sci. 1995, 73,
2548 2557.
12. Weeth, H.J.; Sawhney, D.S.; Lesperance, A.L. Changes in
body fluids, excreta and kidney function of cattle deprived
of water. J. Anim. Sci. 1967, 26, 418 423.
13. Goff, J. Factors to Concentrate on to Prevent Periparturient
Disease in the Dairy Cow, Proceedings of the Mid South
Ruminant Nutrition Conference, Texas Agricultural Ex
tension Service: College Station, TX, 1998; 63.
14. Socha, M.T.; Ensley, S.M.; Tomlinson, D.J.; Ward, T.
Water composition variability may affect performance.
Feedstuffs 2003, 75 (24), 10.
Water 873
Water Buffalo
Nguyen van Thu
Cantho University, Can Tho City, Vietnam
INTRODUCTION
The water buffalo is considered to be a very useful
animal in many countries, supplying draft power, meat,
milk, and other by-products such as hides, horn, etc.
The water buffalo is closely associated with water or
mud, and with smallholder farmers in the rice fields.
In recent years, buffalo production has developed well,
not only in Asia, but also in Europe, South America,
and other continents where the buffalo has been
introduced. This article aims to introduce some basic
knowledge of the water buffalo, with an emphasis on
its great contribution to our living standards and
improved productivity that could be better exploited
for a more sustainable agriculture development in the
21st century.
TAXONOMY AND TYPES
The world’s buffaloes are classified into two groups,
the African and the Asian, with genus names Syncerus
and Bubalus, respectively. According to the zoological
classification,
[1]
buffaloes belong to the class Mammalia,
subclass Ungulata, order Artiodactila, suborder Ruminan-
tia, family Bovidae, subfamily Bovinae, tribe Bovini. The
tribe Bovini includes three groups: Bovina (cattle),
Bubalina (the Asian buffalo), and Syncerina (the African
buffalo). The Asian and African buffaloes are generally
similar, but there are some anatomic differences. The
African buffalo includes only one species, Syncerus
caffer, while the Asian buffalo comprises three species:
Anoa (Bubalus depressicornis) from the Island of
Celebes, Tamarao (Bubalus mindorensis) from the Island
of Mindoro, and Arni (Bubalus Arnee), or the Indian wild
buffalo. Of these four species of African and Asian
buffalo, only the India Arni buffalo has been domesticated
and given the species name bubalis. Therefore, the
domestic buffalo currently reared with the name of water
buffalo is classified as bubalus bubalis. It is believed that
the domestication of the buffalo occurred about 5000
years ago on the Indian subcontinent, and the domestica-
tion of the Swamp buffalo took place in China about 1000
years later.
The water buffalo can be classified into two breed
types, the River type (2n = 50) and the Swamp type
(2n = 48). River breeds consist of: 1) Asian breeds such
as those in India and Pakistan (including Murrah, Nili
Ravi, Surti, etc.; and 2) Mediterranean breeds found in
Italy, Romania, and the Middle East. The skin of River
buffaloes is black, but some specimens have a dark slate-
colored skin. The horns of the River buffalo grow
downward and backward, then curve upward in a spiral.
The Swamp type is found mainly in China and Southeast
Asia. The skin of the Swamp buffaloes is gray at birth, but
becomes slate blue later. Albinoid Swamp buffaloes are
quite common in some areas, for example, in the north of
Thailand. Normally, the horns of Swamp buffaloes are
longer than those of the River buffaloes, grow outward,
and curve in a semicircle. More than 70% of the buffaloes
in the world belong to the River type.
[2]
MEAT, MILK, AND DRAFT ATTRIBUTES
In general, the River types are mainly used for milk in
South Asian countries, while the Swamp types are used
for draft power in Southeast Asian countries and China
(Table 1). However, both the River and Swamp types have
been used for multiple purposes such as work, milk, meat,
manure, fuel, etc. by small farmers in different crop
livestock farming systems. In addition, crossbreeding
programs of the River and Swamp buffaloes have shown
great potential for improving meat, work, and milk
outputs. Recently, the U.S. Department of Agriculture
(USDA) estimated the nutritional value of water buffalo
meat and compared it to beef and chicken. The findings
showed that water buffalo meat has 41% less cholester-
ol, 92% less fat, and 56% fewer calories than traditional
beef. Furthermore, there are as yet no reports on the
occurrence of bovine spongiform encephalopathy (BSE),
also known as mad cow disease, in buffaloes in any part
of Asia.
[4]
The milk yield of the buffalo is lower than that of
cattle, and average milk production is 1500 kg per lac-
tation. However, some individuals can produce 3500 kg
per lactation. Buffalo milk has high nutritive value and
is excellent for the preparation of dairy products. Using
874 Encyclopedia of Animal Science
DOI: 10.1081/E EAS 120019837
Copyright D 2005 by Marcel Dekker, Inc. All rights reserved.
buffaloes for a single purpose makes them less compet-
itive with cattle and tractors. This is believed to be an
important reason for the serious decline of the buffalo
population in a number of Southeast Asian countries,
including some parts of Vietnam. Alexiev reported that
the Swamp-type Wenzhou buffalo in China can give an
average milk yield of 1030 kg per 280-day lactation.
[2]
Thus, milk production of the Swamp buffalo is sufficient
for family consumption. In addition, the Swamp buffalo
provides draft power, and thus has potential in rural areas
of China and Southeast Asian countries. In Europe and the
Near East, the main purpose of raising buffaloes is for
milk. Milk can be used for liquid consumption and making
different cheeses or yogurt, particularly in Italy, where
most of the buffalo milk is used for making a well-known
cheese called Italian Mozarella, which retails at a very
high price.
[5,6]
The total number of buffalo in the World in 2002 was
about 167,126,000 and it is increasing, particularly in
India, China, Brazil, etc., where the River buffaloes are
raised. However, there is a serious reduction of the Swamp
buffalo population in some countries such as Thailand,
Malaysia, and Cambodia due to mechanization, over-
slaughtering for meat, and other reasons (Table 2).
In many cases, knowledge from studies on cattle can
also be applied to buffalo research and practices. How-
ever, differences in anatomy, physiology, feeding behav-
ior, reproductive characteristics, and productivity between
the species have been reported.
[8]
The water buffalo is a
ruminant, and the rumen reticulum of buffaloes is similar
to that of cattle. However, it is heavier than in cattle and
5 10% more capacious.
[9]
Studies comparing buffaloes to
cattle have suggested a higher feed intake, longer retention
time of feed in the digestive tract, longer rumination, less
depression of cellulose digestion by soluble carbohydrates,
a wider range of plant preferences, and a higher popula-
tion of cellulolytic bacteria.
[9]
However, some authors
have found no significant difference in feed digestibility
between the two species. It was suggested that the better
performance of buffaloes fed coarse fodder may not be
related to a superior capacity for fiber digestion, but rather
that they are less discriminating against plants not readily
eaten by cattle. In Colombia, cattle are sometimes first
used to graze pasture, whereafter buffaloes are allowed to
graze the remaining and less desirable parts of the
sward.
[10]
Recently, in a comparative study on cattle and
Swamp buffaloes raised under the same village conditions,
some authors reported higher bacteria, lower protozoa, and
higher fungal zoospore counts in Swamp buffaloes.
[11]
It
was also found that the Swamp buffalo can adapt better in
the acid sulphate soil areas compared to the cattle and
goats in the Mekong delta of Vietnam.
Based on results of a number of studies, buffalo might
utilize protein more efficiently than cattle.
[9]
An ability of
buffaloes to utilize endogenous urea more efficiently than
cattle may explain in part their apparent superiority in
utilizing high-fiber and low-nitrogen feed resources. It is
concluded that there have been contradictory results for
fiber digestion abilities of buffaloes compared to cattle.
Buffaloes, however, seem to have a superior ability to
consume coarse roughage, perhaps as a result of a better
rumination capacity. There is evidence that urea recycling
and purine excretion in buffaloes are different from those
in cattle, but more comprehensive studies are lacking.
Table 2 Buffalo population (head) in the world and in selected countries (1970 2000)
1970 1980 1990 2000
World 107,437,984 121,757,733 148,184,210 164,339,658
India 56,118,000 66,070,000 80,570,000 93,772,000
China 15,713,063 18,439,152 21,421,975 22,596,439
Brazil 118,000 495,000 1,397,097 1,102,551
Italy 48,600 88,900 112,400 201,000
(From Ref. 7.)
Table 1 Plowing and harrowing performance of swamp
buffaloes in the Mekong delta, Vietnam
Sex
Female
(n
a
= 24)
Male
(n
a
= 24)
Criteria Mean ± std Mean ± std
Plowing time
b
(hrs/day)
5.35± 0.58 5.39± 0.31
Plowed area
(ha/pair/day)
0.29± 0.025 0.31±0.035
Harrowing time
b
(hrs/day)
5.05± 0.17 5.28± 0.30
Harrowed area
(ha/pair/day)
0.73± 0.167 0.77±0.170
a
In pair.
b
With a break.
(From Ref. 3.)
Water Buffalo 875
CONCLUSION
It may be concluded that the water buffalo has a great
potential to develop in the future. A number of promising
buffalo farming models have been developed in Brazil,
Australia, Italy, Philippines, Colombia, etc. Valuable
products of water buffaloes, such as milk, meat, draft
power, and manure, are relevant for the people and our
living environment, particularly with respect to the trend
toward organic agriculture in many parts of the world.
REFERENCES
1. Alexiev, A. The Water Buffalo; St. Kliment Ohridski
University Press: Sofia, 1998.
2. Chantalakhana, C. Long term breeding strategies for ge
netic improvement of buffaloes in developing countries.
Asian Aust. J. Anim. Sci. 1999, 12, 1152 1161.
3. Thu, N.V. A Study of Performance, Physiological Param
eters and Economic Efficiency of Working Buffaloes in the
Mekong Delta of Vietnam. In Working Animals in
Agriculture and Transport; Pearson, R.A., Lhoste, P.,
Saastamoinen, M., Martin Rosset, W., Eds.; EAAP Tech
nical Series, Wageningen Academic Publisher, 2003; Vol.
6, 165 171.
4. Ranjhan, S.K. A Vision of buffalo production with special
reference to milk and meat production. Proc. Symp. Series
1 of the 8th World Conf. Anim. Prod., Seoul, Korea, June
28 July 4, 1998; 263 270.
5. Borghese, A.; Moioli, B.; Tripadi, C. Processing and
Product Development in Mediterranean Countries. In
Proceedings of the Third Asian Buffalo Congress, Kandy,
Sri Lanka, 2000; 37 46.
6. Chantalakhana, C. Long term breeding strategies for
genetic improvement of buffaloes in developing countries.
Asian Aust. J. Anim. Sci. 1999, 12 (7), 1152 1161.
7. FAO. Live Animals. FAOstat Agriculture Data; 2003.
= agriculture.
8. Cockrill, W.R. The Husbandry and Health of Domestic
Buffalo; FAO: Rome, 1974.
9. Khajarern, S.; Khajarern, J.M. Feeding Swamp Buffalo for
Milk Production. In Feeding Dairy Cows in the Tropics;
FAO Animal Production and Health Paper, Wageningen
Academic Publishers: The Netherlands, 1991; Vol. 86,
115 125.
10. Thu, N.V. A Study of the Use of Female Cattle and Buffalo
Crusing Sugar Cane in Colombia. M.Sc. Thesis; Swedish
University of Agricultural Sciences: Uppsala, Sweden,
Food and Agriculture of the United Nations, 1994.
11. Wanapat, M.; Ngarmsang, A.; Korkhuntot, S.; Nontaso,
N.; Wachirapakorn, C.; Keakes, G.; Rowlinson, P. A
comparative study on the rumen microbial population of
cattle and Swamp buffalo raised under traditional village
conditions in the Northeast of Thailand. Asian Aust. J.
Anim. Sci. 2000, 13 (7), 918 921.
876 Water Buffalo
Well-Being and Handling
Temple Grandin
Colorado State University, Fort Collins, Colorado, U.S.A.
INTRODUCTION
Reducing stress during handling for procedures such as
vaccinations, milking, and herding will improve both
animal welfare and productivity. Pigs and dairy cows that
are afraid of people have reduced productivity. Pigs have
lower weight gains and fewer piglets and dairy cows
produce less milk. Fearfulness was assessed by measuring
the animal’s willingness to approach people. Cows on
dairies where the employees had received training in
stockmanship and animal behavior had a smaller flight
zone and gave more milk.
[1]
The trained employees
engaged in fewer negative interactions with the cows,
such as hitting or yelling. Further studies have shown that
wild, excitable cattle that become highly agitated in the
squeeze chute had lower weight gains,
[2]
poor beef
quality, and tougher meat.
BIOLOGICAL BASIS OF FEAR
Fear is a strong stressor and it can be detrimental to both
productivity and welfare. People working with animals
should take steps to reduce the animal’s fear. Other
stressors such as weather extremes often cannot be
avoided, but livestock producers can easily reduce fear.
Fear is a basic emotion and it motivates animals to
avoid predators. The amygdala is the brain’s fear center.
[3]
If the amygdala is destroyed, the animal will no longer
become fearful of things that would normally cause fear,
such as sudden loud noise. It also loses learned fear
responses. An example of a learned fear response is
refusing to enter a squeeze chute for vaccinations because
the cow was accidentally hit on the head by the headgate.
In wild animals that are not accustomed to handling,
destruction of the amygdala will make them act tame.
INDICATORS OF FEARFULNESS
One indicator of fearfulness in grazing animals is the size
of the flight zone. Animals with larger flight zones are
more fearful. Another indicator is the startle response to
a sudden stimulus such as a firecracker. Some other
behavioral indicators of fear are a cow struggling in a
squeeze chute, sweating in horses when there is little
physical exertion, flapping in caged layers, and a horse
rearing when he is suddenly startled. Isolation is a strong
stressor, and a single cow or lamb may run into a fence or
try to jump it when it is separated from its herdmates.
Physiological measures such as cortisol in the blood
can also be used as indicators of fear stress that occurs
during nonpainful restraint in a squeeze chute.
[4]
Cortisol
is a time-dependent measure and it takes 10 to 20 minutes
for it to reach peak levels. It is important to differentiate
between fear and pain stress. Cortisol levels can also rise
in response to pain from procedures such as hot iron
branding. The variable of the handling stress needs to be
separated from the variable of pain caused by a procedure
such as castration. Handling stress is mostly fear, and
stress from castration is caused by pain and injury
to tissues.
VARIATIONS IN HANDLING STRESS
Fear stress during handling can vary from almost none to
extreme. Extensively raised cattle that were not accus-
tomed to close contact with people had much higher
cortisol levels when they were restrained in a squeeze
chute compared to hand-reared dairy cattle.
[5]
Taming of
an animal may reduce physiological reactivity of the
nervous system. Hand-reared deer that were raised in
close contact with people had significantly lower cortisol
levels after restraint than free-range deer.
[6]
There are three basic variables that will affect both
the intensity of fear stress during handling and the size of
the animal’s flight zone. They are: 1) genetic factors;
2) amount of contact with people; and 3) previous
experiences with handling that can be either aversive
or nonaversive.
GENETIC FACTORS
The domestic phenotype has reduced responses to changes
in its environment.
[7]
Several studies have shown that
there are differences in how different breeds of cattle react
to handling. Brahman cattle had higher cortisol levels
after restraint than crosses of the English breeds such as
Encyclopedia of Animal Science 877
DOI: 10.1081/E EAS 120019847
Copyright D 2005 by Marcel Dekker, Inc. All rights reserved.
Hereford or Angus. Some genetic lines of cattle, pigs,
or chickens are more likely to be extremely agitated
during handling.
Animals that have flighty, excitable, high-fear genetics
are more likely to become highly agitated when they
are suddenly placed in a new situation, compared to
animals with a calmer temperament. Flighty animals
have to be introduced more gradually to new things to
avoid agitation and panic, compared to animals with a
calmer temperament.
An experiment by Ted Friend showed that measure-
ments of epinephrine (adrenalin) showed that some pigs
habituated to a novel, nonpainful swimming task where
they were suddenly placed in a pool of water. The task
was repeated over a series of days. In some of the pigs, the
elevated epinephrine levels returned to normal and in
other individuals, the epinephrine levels remained high.
Some of the pigs lost their fear of swimming and others
remained scared. Genetic factors may have accounted for
these differences.
EFFECT OF PREVIOUS EXPERIENCES
An animal’s previous experiences with handling will
affect how it will react in the future. Cattle that had been
accidentally bumped on the head in a squeeze chute were
more reluctant to reenter the chute a month later. Sheep
that had been turned upside down in a restraint device
were more reluctant to reenter the facility the following
year compared to sheep that were restrained in an upright
position.
[8]
It is important that an animal’s first experience with a
new person or new place be a good one. Progressive
ranchers walk cows and calves through the corrals prior to
doing procedures so that they will associate corrals with
being fed. Sometimes painful procedures have to be done,
but it is recommended that they not be associated with the
animal’s first experience with either a new person or a
new place. A rat experiment indicated that if a rat was
shocked severely the first time it entered a new arm on a
maze, it would never enter that arm again. However, if the
rat was fed the first time he went into the new arm and
then subjected to gradually increasing shocks, he would
keep entering the arm to get the food.
[9]
FEAR MEMORIES
If an animal is subjected to either a frightening or a painful
experience, it may form a permanent fear memory that
cannot be erased.
[3]
This memory is formed in the lower
subcortical pathway in the brain, and extinguishing the
conditioned fear is difficult because it has to be sup-
pressed by an active learning process that requires input
from higher parts of the cortex. The fear memory is
suppressed by the cortex, but it can sometimes reappear.
Careful, quiet handling of animals will help prevent the
formation of fear memories that may compromise welfare,
lower productivity, or cause behavior problems, as in
horses. Animals can associate certain types of clothing or
a person’s voice with either a frightening or a painful
experience. Animals also have the ability to recognize the
voice of a familiar safe person who can calm them down.
FEAR OF NOVELTY
New experiences and new things are both scary and
attractive to animals. They are attractive when the animal
is allowed to voluntarily approach, but frightening when
suddenly introduced.
[7]
If a flag is placed in the middle of
a large field, cattle and horses will approach it and
investigate. However, if the same flag is suddenly waved
next to a horse, he may become highly agitated.
[7]
Animals can be trained to tolerate new things if they
are gradually introduced. Cattle should become accus-
tomed to being handled and fed by different people in
different vehicles. This will help reduce stress when they
are moved to a new place. Training animals to tolerate
new experiences will help keep them calmer. It is
important to train cattle on being moved by both people
on foot and people on horses. Cattle appear to perceive a
person riding a horse and a person walking on foot as two
different things.
TRAIN FOR HANDLING
Training calves and pigs to handling procedures helps to
produce calmer adult animals. Pigs differentiate between a
person in the aisle and a person in their pens. Pigs will
move more easily in and out of trucks and through chutes
at a meat plant if the producer trained them by walking
through their pens several times each week.
Animals will have the lowest amount of fear stress
when they voluntarily cooperate with being restrained and
handled. Zoos and aquariums are training animals, such as
apes, lions, and dolphins, to cooperate with blood testing
and veterinary procedures. Highly excitable Bongo
antelope were trained to enter a box and allow blood
samples to be taken when they were fed treats. Almost
baseline cortisol (stress hormone) levels were obtained.
The levels of glucose in the blood of trained animals was
significantly lower compared to the same animal immo-
bilized with a dart.
[10]
878 Well-Being and Handling
CONCLUSIONS
Reducing fear during handling will improve animal
productivity.
[1]
There are many different stressors that
animals encounter such as stimuli that evoke fear, heat
stress, cold stress, pain, or fatigue. Fear is a strong stressor
and it is one stressor that is easy to reduce. Fearful animals
have lower productivity. Animals remember frightening
or painful events and producers should be careful to avoid
creation of fear memories. An animal’s first experience
with a new corral or person should be low stress. Training
animals to handling procedures will help reduce fear
stress. Both animal welfare and productivity will be
improved by reducing fear stress.
ARTICLE OF FURTHER INTEREST
Animal Handling-Behavior,p.22
REFERENCES
1. Hemsworth, P.H.; Coleman, G.J.; Barnett, J.C.; Berg, S.;
Dowling, S. The effect of cognitive behavioral interven
tions on the attitude and behavior of stock persons and
the behavior and productivity of commercial dairy cows.
J. Anim. Sci. 2002, 80, 68 78.
2. Voisinet, B.D.; Grandin, T.; Tatum, J.D.; O’Connor, S.F.;
Struthers, J.J. Feedlot cattle with calm temperaments
have higher daily weight gains than cattle with excitable
temperaments. J. Anim. Sci. 75, 892 896.
3. LeDoux, J. The Emotional Brain; Simon and Schuster:
New York, New York, 1996.
4. Grandin, T. Assessment of stress during handling and
transport. J. Anim. Sci. 1997, 75, 249 257.
5. Lay, D.C.; Friend, T.H.; Bowers, C.C.; Grissom, K.K.;
Jenkins, O.C. A comparative physiological and behavioral
study of freeze and hot iron branding using dairy cows.
J. Anim. Sci. 1992, 70, 1121 1125.
6. Hastings, B.E.; Abott, D.E.; George, L.M.; Staler, S.G.
Stress Factors influencing plasma cortisol levels and
adrenal weights in Chinese water deer. Res. Vet. Sci.
1992, 53, 375 380.
7. Grandin, T.; Deesing, M.J. Behavioral Genetics and
Animal Science. In Genetics and the Behavior of Domestic
Animals; Grandin, T., Ed.; Academic Press: San Diego,
CA, 1998; 1 30.
8. Hutson, G.D. The influence of barley food rewards on
sheep movement through a handling system. Appl. Anim.
Behav. Sci. 1985, 14, 263 273.
9. Miller, N.E. Learning resistance to pain and fear, effects of
over learning exposure and rewarded exposure in context.
J. Exp. Psych. 1960, 60, 137 142.
10. Phillips, M.; Grandin, T.; Graffam, W.; Irlbeck, N.A.;
Cambre, R.C. Crate conditioning of Bongo (Trage
laptous eurycerus) for veterinary and husbandry proce
dures at Denver Zoological Garden. Zoo. Bio. 1998, 17,
25 32.
Well-Being and Handling 879
Well-Being Assessment: Behavioral Indicators
J. C. Swanson
M. Rassette
Kansas State University, Manhattan, Kansas, U.S.A.
INTRODUCTION
Animal well-being can be characterized as the harmony an
animal is experiencing mentally and physically with its
environment. Animal well-being is often used inter-
changeably with the term animal welfare. Domestic
livestock and poultry are raised under a variety of
environmental conditions that are vastly different from
those of their wild ancestors. The scientific assessment of
the well-being of livestock and poultry has become
important to the sustainability of raising them for food.
The best scientific approach and criteria to assess animal
well-being have yet to achieve a scientific consensus, but
it is generally accepted that behavior, physiology, health,
productivity, cognition, and system ecology are indicators
of animal well-being.
BEHAVIORAL INDICATORS
The repertoire of behavior expressed by a domestic animal
reflects a living history of its natural and artificial
selection. Generally, behavior is used to identify and
assess animal needs, preferences, state of health, ability to
adapt and cope with its social and physical environment,
emotional state, and to gain insight into what an animal
may comprehend or feel about its environment.
Several behavioral indicators are commonly cited as
useful to understanding and assessing animal well-being
including abnormal behavior, posture, vocalization, re-
sponsiveness, grooming and displacement behavior, pre-
ferences animals express toward features of their living
environment, and the presence/absence of stereotypies.
Abnormal Behavior
The use of abnormal behavior as an indicator of well-
being requires a clear knowledge of what constitutes
normal behavior for a species. Species behavior is se-
quenced, measured, described, and recorded to construct
an ethogram. The ethogram characterizes both instinctive
and learned behavior displayed throughout a species’ life
cycle. Ethograms of wild ancestors, close relatives, or
feral members of the same species are useful in studying
the behavioral similarities and differences induced by
domestication. An example of abnormal behavior is an
outbreak of tail biting in pigs. The interpretation of
behavior elicited under domestic conditions is complicat-
ed and requires that we understand the cause, develop-
mental aspects, and function of the behavior within the
construct of the evolutionary and domestic history of
the species.
Posture
The posture of an animal represents a coping response to a
stimulus. Posture is often coupled with other behavioral
indicators such as vocalization and locomotion to assess
well-being. Researchers have studied the usefulness of
posture to correctly assess the amount of pain and distress
an animal may experience after being subjected to
common animal management procedures. For example,
a behavioral method using posture was validated to assess
acute pain associated with different castration procedures
used on lambs.
[1]
Each procedure was ranked according to
an established index of expected pain. Physiologic and
behavioral data (including posture) were then collected for
a period of 60 minutes postprocedure. The data were
analyzed according to the ability to place a lamb into the
correct procedure group. A combination of behavior and
posture data correctly placed 79% of the lambs into their
respective treatment groups.
[1]
As technology advances, so too does the sophistication
of using an animal’s posture or movement for assessing
well-being. For example, computer image analysis has
been used to measure the severity of head movements of
cattle undergoing various types of branding to measure
their aversion to the procedure,
[2]
and to evaluate the
thermal comfort of pigs based on their proximity to one
another.
[3]
While assessments must be validated for other
species and for different types of practices, postural
measures appear to be useful behavioral indicators of
well-being.
Vocalization
Animals convey a range of emotional states through
various types of vocalizations. Vocalizations are context-
880 Encyclopedia of Animal Science
DOI: 10.1081/E EAS 120019844
Copyright D 2005 by Marcel Dekker, Inc. All rights reserved.
specific, and the circumstances under which vocalizations
are emitted must be carefully considered. For example, a
recent study compared the vocalizing of cattle in slaughter
plants before and after modifications were made in animal
handling procedures.
[4]
The data were used to evaluate the
effectiveness of the plant modifications. Indeed, a
reduction in observable aversive events (prod use,
slippage, excessive restraint pressure) decreased the
amount of vocalization behavior.
[4]
Other researchers
have found similar uses for vocalization in different
species. One study measured the occurrence and frequen-
cy of calls in piglets being castrated, and found a
significantly greater rate of high-frequency calls (>1000
Hz) compared with controls who were handled similarly
but not actually castrated.
[5]
The researchers were able to
isolate the most painful part of the procedure itself, and
the effect these vocalizations had on other piglets, both of
which have important implications for well-being.
Responsiveness
The degree of an animal’s responsiveness to stimuli also
acts as an indicator of well-being. For example, the
attitudes and behavior of dairy stockpersons toward
cows have been researched and a correlation found
between the stockperson’s behaviors and the avoidance
distance of cows.
[6]
Avoidance behavior can shed light
on an animal’s past relationship with humans and reflect
the well-being of individuals or groups. Another
example of responsiveness as an indicator of well-being
comes from a study using tonic immobility.
[7]
Tonic
immobility is a state of petrification induced by
positioning a bird on its back or side consequently,
no movement is detected for a given period of time. The
time until the bird recovers head movement, stands, and
walks is measured. Shorter latencies to recovery indicate
a better coping response by the bird. Reduced or absent
responsiveness of an animal has been recognized as an
indicator of poor well-being.
Grooming and Displacement Behaviors
Grooming as a social and self-maintenance behavior
can reflect the relative well-being of an individual or an
entire group. Disruption or abnormal manifestations of
grooming are measurable events. The lack of grooming,
indicated by poor hair/fur coat or feather condition, is often
used as an indicator of sickness or depression for indi-
vidual animals. Abnormal pulling of hair/fur or feathers
or obsessive grooming activities may occur in individ-
uals or within groups. Both are considered abnormal.
A displacement behavior is the result of frustration or
behavioral disinhibition, or is performed when an animal
is in conflict with how to behave in a given set of
circumstances. For example, abnormal feather pecking in
laying hens may be the displaced behavior of natural
foraging or dustbathing and has been used to assess
different housing conditions of egg-laying hens.
[8]
Feather
pecking in hens can lead to significant feather loss or even
skin damage. Thus, the occurrence of displacement
behavior and abnormal forms of grooming can be
measured and used to assess well-being.
Preferences
Preference tests are valuable tools to evaluate stimuli or
conditions by appealing to the desires of the animal. For
example, such tests can be used to assess the effects on
well-being of different enrichment devices or housing
conditions. In one study, researchers tested the prefer-
ences of dairy cattle for different kinds of flooring sand,
straw, or a soft rubber mat.
[9]
The cows avoided sand and
preferred either the mat or straw. The researchers then
tested whether a preference existed between the mat and
straw. They found that cattle preferred straw in winter, but
in summer, cows showed no special preference for one
system over the other. Preference testing of this type
allows for better design of housing systems. However,
extreme care must be taken when designing and drawing
conclusions from such tests. For example, exposure to
resource cues can affect the performance of an animal in
preference tests.
[10]
Cues such as odors can be undetect-
able to humans, but obvious to animals. Carefully
controlled preference tests are useful in validating the
needs and choices of animals.
Stereotypies
Stereotypy is a common abnormal behavior observed in
intensively farmed species and thought to be the product
of impoverished environments. Stereotypies are behavior
patterns repeated without variation and appear to have no
obvious goal or function. Examples include bar-biting;
fur, hair, or wool chewing; sham chewing; tongue lolling;
and a variety of locomotion patterns such as head-
weaving. Once developed, stereotypies can be difficult to
extinguish, even when animals are moved into more
enriched environments. This indicates an addictive
quality to the behavior that requires an understanding of
its neurophysiological development. Performance of
stereotypic behavior is often cited as an indicator of poor
well-being.
Researchers have studied stereotypies in nearly all
farmed species, including those farmed for fur, such as
mink raised in cages.
[11]
Potential remedies such as
environmental enrichment are often explored to provide
relief. However, the view that all stereotypies indicate
poor well-being is controversial.
[12–14]
Performance of
Well-Being Assessment: Behavioral Indicators 881
stereotypy could also indicate excitement or anticipation
of a resource. Thus, stereotypic behaviors are complex
and must be fully examined to determine the effect on
well-being.
Although the motivation to stereotype in domestic
species has been researched, the neurophysiological
implications are only beginning to be elucidated. For
example, recent studies have linked altered brain func-
tioning and enhanced frustration to stereotypies found in
caged birds.
[15]
Greater understanding of the disruption to
brain function could eventually adjudicate the competing
views on stereotypic behavior. At present, the exhibition
of stereotypies in domestic animals should prompt a closer
look at other well-being indicators to further assess the
possibility of a poor state of well-being.
CONCLUSION
Behavior is one of several indicators used to assess animal
well-being. There is still much to be learned about the
behavior of our domestic livestock and poultry and what
constitutes a state of good well-being or contentment.
Although scientific consensus has not been reached
regarding good versus poor well-being, there is general
agreement that behavior provides insight into factors that
promote or detract from an animal’s quality of life.
REFERENCES
1. Molony, V.; Kent, J.E.; McKendrick, I.J. Validation of a
method for assessment of an acute pain in lambs. Appl.
Anim. Behav. Sci. 2002, 76 (3), 215 238.
2. Schwartzkopf Genswein, K.S.; Stookey, J.M.; Crowe,
T.G.; Genswein, B.M. Comparison of image analysis,
exertion force, and behavior measurements for use in the
assessment of beef cattle responses to hot iron and freeze
branding. J. Anim. Sci. 1998, 76 (4), 972 979.
3. Xin, H. Assessing swine thermal comfort by image
analysis of postural behaviors. J. Anim. Sci. 1998, 77
(supplement 2), 1 9.
4. Grandin, T. Cattle vocalizations are associated with
handling and equipment problems at beef slaughter plants.
Appl. Anim. Behav. Sci. 2001, 71 (3), 191 201.
5. Weary, D.M.; Braithwaite, L.A.; Fraser, D. Vocal response
to pain in piglets. Appl. Anim. Behav. Sci. 1998, 56 (2 4),
161 172.
6. Waiblinger, S.; Menke, C.; Coleman, G. The relationship
between attitudes, personal characteristics and behaviour
of stockpeople and subsequent behaviour and production of
dairy cows. Appl. Anim. Behav. Sci. 2002, 79 (3), 195
219.
7. Hocking, P.M.; Maxwell, M.H.; Robertson, G.W.;
Mitchell, M.A. Welfare assessment of broiler breeders
that are food restricted after peak rate of lay. British
Poultry Science 2002, 43 (1), 5 15.
8. El Lethey, H.; Aerni, V.; Jungi, T.W.; Wechsler, B. Stress
and feather pecking in laying hens in relation to housing
conditions. British Poultry Science 2000, 41 (1), 22
28.
9. Manninen, E.; de Passille´, A.M.; Rushen, J.; Norring, M.;
Saloniemi, H. Preferences of dairy cows kept in unheated
buildings for different kinds of flooring. Appl. Anim.
Behav. Sci. 2002, 75 (4), 281 292.
10. Warburton; Mason, G.J. Is out of sight out of mind? The
effects of resources cues on motivation in mink. Anim.
Behav. 2003, 65 (4), 755 762.
11. Nimon, A.J.; Broom, D.M. The welfare of farmed mink
(Mustela vison) in relation to housing and management: A
review. Animal Welfare 1999, 8 (3), 205 228.
12. Vinke, C.M. Some comments on the review of nimon and
broom on the welfare of farmed mink. Animal Welfare
2001, 10 (3), 315 324.
13. Mason, G.J.; Mendel, M. Do Stereotypies of pigs,
chickens, and mink reflect adaptive species differentiation
in control of foraging? Appl. Anim. Behav. Sci. 1997, 53
(1/2), 45 58.
14. Broom, D.M.; Nimon, A.J. Response to Vinke’s short
communication: Comments on mink needs and welfare
indicators. Animal Welfare 2001, 10 (3), 325 326.
15. Garner, J.P.; Mason, G.J.; Smith, R. Stereotypic route
tracing in experimentally caged songbirds correlates with
general behavioural disinhibition. Anim. Behav. 2003, 66
(4), 711 727.
882 Well-Being Assessment: Behavioral Indicators
Well-Being Assessment: Concepts and Definitions
John J. McGlone
Texas Tech University, Lubbock, Texas, U.S.A.
INTRODUCTION
Animal welfare and animal well-being are more or less
interchangeable terms. Assessment of animal welfare
seems to include some subjective assessments, while the
term animal well-being is viewed as more objective in
some circles. In practice, the two terms have very similar
meaning to the public and most scientists.
Animal welfare/well-being assessment is often criti-
cized by scientists as being anthropomorphic. Anthropo-
morphism is the ascribing of human traits to nonhumans
(e.g., animals or inanimate objects). Most scientists have
historically not been comfortable with assessing animal
happiness or pleasure. Still, there is a need to objectively
measure and assess animal well-being. From this need, the
science of farm animal welfare was born. Animal
cognitive experiences, including their feelings, are
included in this science along with measures of physio-
logical status (endocrine and immune status), behavior,
growth, and reproduction.
HISTORICAL PERSPECTIVE
Philosophers have examined the relationship between
humans and animals from moral and theological views
for centuries. The modern concept of farm animal well-
being began with the issuing of the Brambell report in
1965 in the United Kingdom. The group of biologists, led
by Brambell, concluded that animals have ‘‘Five Free-
doms.’’ These freedoms (some would call them ‘‘rights’’
today) include the freedom to get up, lie down, stretch
their limbs, turn around, and groom (themselves or others,
depending on the species). The assignment of the original
‘‘Five Freedoms’’ is considered more of a moral argument
than a scientific argument there was no science to sup-
port these basic freedoms in 1965.
ANIMAL RIGHTS VS. ANIMAL
WELFARE/WELL-BEING
The public and the media often confuse animal rights and
animal welfare/well-being. Animals have limited legal
rights and few widely agreed-upon moral rights. Animals
have a legal right to not be abused or neglected. Other than
that right, animals do not have the right to life or liberty.
Some activist groups attribute rights to animals to the
extent that they believe animals should not be eaten,
exhibited, or used in research.
Animal welfare/well-being is the concern of all people
who own animals. People give animals adequate environ-
ments to ensure that they have good welfare/well-being.
The subject of animal welfare/well-being science is a
recognized area of investigation. Those who hope to
improve the lives of animals will do so through careful
examination of animal welfare/well-being.
DEFINING AND ASSESSING
ANIMAL WELFARE/WELL-BEING
Scientists working in the field of farm animal welfare
science have struggled with defining and assessing animal
welfare/well-being. The most widely-held view is that to
properly assess farm animal welfare, a multidisciplinary
approach is required. Measures should include behavior,
physiology, growth, and reproduction. All these measures
are responsive to stress to varying degrees. A sample of
other views are provided here.
Duncan
[1]
suggested that animal welfare has to do with
how animals feel their cognitive experiences. Moberg
[2]
suggested that when animals experience stress, their
welfare is compromised when they reach a prepatholog-
ical state as measured by animal physiology and disease
state (including infectious and metabolic diseases). In
another view, because behavior is adaptive, simply
finding a behavioral effect cannot be said to be a negative
welfare situation. Only when the environment is stressful
to the point that physiological changes are invoked can the
animal be said to be in a state of reduced welfare,
McGlone
[3]
argued. In another model, animal welfare has
to do with behavioral needs, and when behavioral needs
are met, welfare is adequate.
[4]
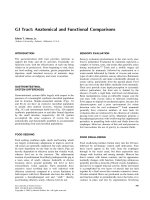
The most recent model,
proposed by Curtis,
[5]
includes an assessment of the
animals’ state of being its state relative to a continuum
from a bad to a good state of being (Fig. 1). Many models
of animal welfare/well-being overlap.
Encyclopedia of Animal Science 883
DOI: 10.1081/E EAS 120019846
Copyright D 2005 by Marcel Dekker, Inc. All rights reserved.
THE MULTIDISCIPLINARY APPROACH
In the multidisciplinary approach, one measures behavior,
physiology, and performance and then uses all of this
information to determine whether welfare/well-being is
adequate. This approach is the safest approach in that
several of the other models can be examined if all of these
measures are collected. This approach was used recently
to assess sow welfare in various housing systems using a
meta-analysis of selected scientific publications.
[6]
Measures of performance include, for growing animals,
rates of growth and efficiency of nutrient utilization.
Fig. 1 The continuum of states of animal welfare/well being.
Table 1 Definitions in the field of animal welfare/well being science
Name Definition Source
a
Agonistic Aggressive, submissive, and threat behaviors. Hurnik et al.
[7]
Fixed action pattern Any action pattern typical of a given
species or breed that is performed in a very
similar way by its individual members.
In contemporary ethology, the term ‘‘fixed
action pattern’’ often is replaced by ‘‘modal
action pattern’’ because of inevitable individual
variations in behavior. Examples: face grooming
in mice, egg retrieval in geese.
Rights (12 definitions were
given in this source)
Qualities (as adherence to duty or obedience to
lawful authority) that together constitute the
ideal of moral propriety or merit moral approval;
something to which one has a just claim,
such as the power or privilege to which
one is justly entitled.
Merriam Webster
[8]
Rights (animal) The idea that animals have a just or moral claim or
privilege to certain items such as lack of
abuse or neglect, life, or freedom.
Stereotyped Repeated behaviors shown in sequence that vary
only slightly in sequence; may be caused by the
environment genetics, or a combination.
Examples: chewing, suckling.
Stereotyped behavior
b
Behavior repeated in a very constant way.
The term generally is used to refer to behavior that
develops as a consequence of a problem situation
such as extended social isolation, low level of
environmental complexity, deprivation, etc.
Stereotypy also may arise from genetic predispositions,
or from disease of, or damage to, the brain.
Hurnik et al.
[7]
Stereotypy Stereotyped behavior that serves no apparent function;
often associated with disease or adaptation to a
stressful environment. Example: navel sucking in
weaned piglets.
Welfare The state of being of an animal. Welfare can
range from very good to very bad.
Well being A term used in the scientific literature to
indicate animal welfare.
a
A source is given when the definition is widely accepted.
b
This definition has been functionally divided into ‘‘normal’’ stereotyped behavior and stereotypies among farm animal welfare scientists.
884 Well-Being Assessment: Concepts and Definitions
Among adult animals, rates of reproduction are included
in animal performance measures. Growth and reproduc-
tion are suppressed when animals are stressed.
Measures of behavior include maintenance behaviors
(feeding, drinking, standing, moving, laying, and sleep-
ing), social behaviors (agonistic and nonagonistic behav-
iors), goal-directed behaviors (exploration, food-search-
ing, water-searching), preferences, emotional behaviors
(fear, frustration, rage, etc.) and abnormal behaviors.
Among abnormal behaviors are aberrant behaviors in-
cluding tail biting, ear chewing, navel sucking, buller-steer
mounting, wind sucking, and cribbing in horses, wool-
picking in sheep, and a host of others. In a gray area of
science, certain behaviors are considered abnormal by
some authors but other authors simply conclude they have
unknown cause. Included in this gray area are stereotyped
behaviors that develop into stereotypies (Table 1). Exam-
ples of behaviors that clearly are stereotyped but may
become stereotypies are bar biting in sows, tongue rolling
in calves, and pacing among captive wild animals.
Measures of physiology include both endocrine and
immune measures. Endocrine measures used in assessment
of animal welfare include adrenal cortical and medullary
hormones. Glucocorticoids (cortisol or corticosterone) and
catecholamines are the most commonly measured endo-
crine measures of stress. Measures of immune status are
measures of stress in that if the immune system is
suppressed and a pathogenic microorganism (or even a
normally nonpathogenic microorganism) is present in
sufficient quantity, then the animal will become ill. Illness
is clearly a state of reduced welfare/well-being. Stress
suppresses the immune system and so an important
measure of the animal’s welfare/well-being would be its
relative immune status. Examples of measures of immunity
that are sensitive to stress include natural killer cell activity,
neutrophil function (chemotaxis and phagocytosis), and
levels of some cytokines. Other measures of immunity such
as antibody response to a foreign antigen and lymphocyte
proliferation in the presence of mitogen have been used in
welfare/well-being assessment; however, these measures
require very stressful environments to induce changes.
Two examples of use of the multidisciplinary approach to
assessment of animal welfare are given below.
Hicks et al.
[9]
examined the effects of heat stress,
shipping stress, and social stress on pig behavior,
immunity, and endocrine and performance measures. Pig
behavior was significantly changed by all acute, mild
stressors. Pig physiology was only slightly changed. Pig
social stratus (dominant, intermediate, or submissive)
interacted with stress treatments. Dominant pigs were
heavier and less negatively influenced by stressors than
were subordinate pigs. The authors concluded that
behavioral changes were more consistent and reliable
measures of the effects of acute stress. Stockpeople could
use the behavioral responses as early indicators of reduced
welfare and as a sign that interventions are required to
maintain adequate animal welfare.
Mitlohner et al.
[10]
examined the effects of shade on
cattle performance, carcass traits, physiology, and behav-
ior while they were experiencing heat stress. The
provisions of shade increased weight gain of cattle that
were in a warm climate. Shade also reduced neutrophil
numbers and respiratory rates and caused altered cattle
behavior. Because shade increased cattle weight gain and
improved some measures of physiology, one could
conclude that the cattle with shade in the summertime
had improved welfare/well-being.
CONCLUSIONS
Animal welfare/well-being can be examined as a science;
as a legal, moral, or ethical argument; or as a subject for
activism. Farm animals have the right to not be abused or
neglected, but beyond that they have few agreed-upon
rights. Livestock producers provide environments that are
conducive to good animal welfare. Several animal welfare
models are presented. Measuring animal welfare by using
a multidisciplinary approach would provide information
on animal behavior, physiology, and performance so that
decisions about animal welfare/well-being can be made
with the most possible information
[11]
and if possible in
context with other society issues.
[12]
REFERENCES
1. Duncan, I.J.H. Animal welfare defined in terms of feelings.
Acta agric. Scand., A Anim. Sci. 1996, 27, 29 35.
2. Moberg, G.P. Suffering from stress: An approach for
evaluating the welfare of an animal. Acta Agric. Scand., A
Anim. Sci. 1996, 27, 46 49.
3. McGlone, J.J. What is animal welfare? J. Agric. Ethics
1993, 6, 26 36.
4. Duncan, I.J.H. Behavior and behavioral needs. Poultry Sci.
1998, 77, 1766 1772.
5. Curtis, S.E. Stress: State of being. Encycl. Anim. Sci.
2004. (in press).
6. McGlone, J.J.; von Borell, E.H.; Deen, J.; Johnson, A.K.;
Levis, D.G.; Meunier Salau¨n, M.; Morrow, J.; Reeves, D.;
Salak Johnson, J.L.; Sundberg, P.L. Review: Compilation
of the scientific literature comparing housing systems for
gestating sows and gilts using measures of physiology,
behavior, performance, and health. Prof. Anim. Sci. 2004,
20, 105 119.
7. Hurnik, J.F.; Webster, A.B.; Siegel, P.B. Dictionary of
Well-Being Assessment: Concepts and Definitions 885
Farm Animal Behavior, 2nd Ed.; Iowa State University
Press: Ames, 1995.
8. Merriam Webster. Merriam Webster Online Dictionary;
2004. http://www.m w.com/netdict.htm. Accessed March
28, 2004.
9. Hicks, T.A.; McGlone, J.J.; Whisnant, C.S.; Kattesh, H.G.;
Norman, R.L. Behavioral, endocrine, immune, and perfor
mance measures for pigs exposed to acute stress. J. Anim.
Sci. 1998, 76, 474 483.
10. Mitlo¨hner, F.M.; Galyean, M.L.; McGlone, J.J. Shade
effects on performance, carcass traits, physiology, and
behavior of heat stressed feedlot heifers. J. Anim. Sci.
2002, 80, 2043 2050.
11. Brambell, F.W.R. Report of the Technical Committee to
Enquire into the Welfare of Animals Kept Under Intensive
Livestock Husbandry Systems; Command Paper, Her
Majesty’s Stationery Office: London, 1965; Vol. 2836.
12. McGlone, J.J. Farm animal welfare in the context of other
society issues: Toward sustainable systems. Livest. Prod.
Sci. 2001, 72, 75 81.
886 Well-Being Assessment: Concepts and Definitions
Well-Being Assessment: Physiological Criteria
Katherine Albro Houpt
Cornell University, Ithaca, New York, U.S.A.
INTRODUCTION
There is no single valid measure of stress (or well-being).
Nevertheless, we can use physiological variables to assist
in validation. The hormone most often used for measuring
well-being is cortisol, the product of the mammalian
adrenal cortex. One also can measure the levels of
hormones and metabolites that are affected by cortisol.
The sympathetic nervous system is the other major source
of reactions to stress, pain, or fright.
SYMPATHETIC NERVOUS SYSTEM
There are two components to the sympathetic nervous
system neural and hormonal. The most rapid response is
neural. Centers in the diencephalon (the hypothalamus,
primarily) are stimulated by the frightening event, and
therefore, the sympathetic pathways in the spinal cord and
then the nerves of the sympathetic chain are stimulated.
The neurotransmitters released by the sympathetic nerves
are norepinephrine and epinephrine (adrenaline and
noradrenaline are alternative names). The structures
innervated by the sympathetic nerves are the blood
vessels, the hair follicles, the heart and lungs, and the
gastrointestinal tract. The action on the gastrointestinal
tract is primarily negative: Secretion and motility are
inhibited. The actions on the heart are to increase the
frequency and strength of contraction and to dilate the
bronchioles of the lungs. The pupils of the eyes dilate. The
hair stands on end (piloerection).
Any of these reactions can be measured to assess
welfare. The hormones norepinephrine and epinephrine
are very quickly degraded, so blood samples need to be
taken quickly and the blood kept cold and processed
quickly. The hormones can also be measured in saliva,
which is a less invasive method, but still involves restraint
of the animal. For this reason, it is more practical and
probably more valid to measure the results of sympathetic
stimulation, for example, heart rate. There are heart rate
monitors that can be attached to the animal with a chest
band. These can be retrieved later to determine any
change in heart rate or in variability of heart rate.
There can be confounding factors in any measure of
stress. For example, ceiling effects can make interpreta-
tion difficult. A ceiling effect occurs when the response is
already high and cannot be any higher physiologically.
Branding is used for identification of beef cattle in the
United States. Although the modern techniques of micro-
chipping would also make identification possible, what
the rancher needs is a symbol, unique to his ranch, that is
visible from a distance. There are two methods of
branding: hot-iron branding and freeze branding. Hot-
iron branding destroys the hair follicles and creates a scar.
Freeze branding does not destroy the hair follicles, but
causes the hair to regrow white rather than pigmented.
These brands are somewhat harder to read than hot-iron
brands, but presumably are more humane. When the
responses of beef cattle to the two types of branding were
compared, the heart rate and catecholamine levels were
high following both procedures. The explanation is that
the restraint necessary to brand the animals was extremely
stressful to all the cattle, so their response was maximal.
In other words, there was a ceiling effect. When the
comparison of branding methods was repeated using dairy
cattle, hot-iron branding caused higher heart rate and more
avoidance than freeze branding.
[1]
Dairy cattle are much
more accustomed to the presence of humans, to restraint,
and to being handled than are most beef cattle.
HYPOTHALAMIC-PITUITARY ADRENAL AXIS
Stress to the animal leads to stimulation of those
hypothalamic neurons that produce corticotropin releasing
factor (CRF).
[2]
This is carried in the hypothalamic
pituitary portal system to the anterior pituitary, where it
stimulates release of adrenal corticotropic hormone
(ACTH). This, in turn, stimulates release of the adrenal
cortical hormones, in particular cortisol (in mammals) and
corticosterone (in birds). The mineral corticoids aldo-
sterone may also be released to a lesser degree. This
hormonal cascade will take some time (minutes to hours),
in contrast to the more rapid neural activity of the
sympathetic nervous system. One important question is
how much does an animal’s cortisol level have to rise
Encyclopedia of Animal Science 887
DOI: 10.1081/E EAS 120019845
Copyright D 2005 by Marcel Dekker, Inc. All rights reserved.
before we should consider the animal stressed. Barnett and
Hemsworth
[3]
have suggested that a 40% increase
indicates stress. One could use any increase above the
normal range for the particular laboratory and species.
There are pitfalls in the use of cortisol (or any other
physiological measurement), not because cortisol is not an
indicator of stress, but because of confounding circum-
stances. For example, veal calf welfare is frequently
questioned, so measuring cortisol was assumed to be a
valid measure. As expected, when the calves were first
placed in veal crates their cortisol was elevated, but
several weeks later their cortisol was lower than age-
matched calves that were housed in pens.
[4]
The controls
had higher cortisol than the confined calves, probably
because they had to be chased and caught before the blood
samples were taken.
The method of obtaining the sample is important. If
blood is taken by direct venipuncture and several attempts
have to be made before the vein is punctured, the cortisol
may be high for that reason. Taking blood from the
anterior vena cava of a supine pig is much more likely to
be stressful than taking it from the jugular vein of a horse
habituated to handling and injections. Preplacement of an
indwelling vascular catheter avoids some of those
problems. There is a definite circadian rhythm of cortisol
secretion, so that morning cannot be used as a control for
afternoon. In fact, loss of the rhythmicity is another sign
of stress. Twenty minutes should be allowed after the
stressor for cortisol to rise.
Cortisol can be measured in other body fluids. Salivary
cortisol can be collected easily by putting a cotton-tipped
applicator in the animal’s mouth. Urinary cortisol can be
measured, but creatinine must be measured also in order to
control for concentration of the urine. A low cortisol
concentration in dilute urine could represent a higher
plasma level than a higher level of cortisol in concentrated
urine. Fecal cortisol has been measured successfully and is
particularly useful when the well-being of free-ranging or
wild species is to be evaluated. One advantage of
measuring fecal cortisol is that cortisol production over
a matter of hours is represented, rather than cortisol at a
single point in time, as with a blood sample.
The actions of cortisol on the rest of the body can also
be measured and used to evaluate welfare. Cortisol has
effects on the liver, the fat depots, and the immune system.
The hormone stimulates gluconeogenesis. Gluconeogen-
esis is the deamination of amino acids, freeing glucose for
immediate energy. The ammonia produced forms urea,
and urea can be measured as a sign of stress. In this case
cortisol stimulation more urea is produced, but levels
may be high because less is excreted. Impaired excretion
would indicate a kidney problem. Therefore, when a high
level of urea is detected, renal health should be evaluated
before stress is diagnosed. Renal function can be
measured from the specific gravity of the urine, from
the presence or absence of protein in the urine, and by the
ratio of urea to creatinine, a compound that rarely varies in
plasma concentration.
Under the influence of cortisol, fatty acids are metab-
olized rather than forming more adipose tissue. These two
actions, gluconeogenesis and antilipogenesis, complement
the actions of the adrenal medullary hormones that
stimulate glycogenolysis and lipolysis.
One of the major actions of cortisol is the reduction of
inflammation, and inflammation is reduced by suppres-
sion of the immune system. The number and type of white
blood cells can be measured. There are several types of
white blood cells, including neutrophils and lymphocytes.
The lymphocytes are the antibody-producing cells, and
these are the cells suppressed by cortisol. The ratio of
neutrophils to lymphocytes can therefore be used as a
measure of stress. The fewer the lymphocytes, the more
likely the animal is secreting more cortisol and is stressed.
One can also measure the activity of white blood cells
rather than simply the number of cells. Some of these
measures are mitogen-induced lymphocytic proliferation
and natural killer-cell cytotoxicity. These have been used
to assess well-being, but the results are often inconsist-
ent.
[5]
Suppression of the immune system is the most
dangerous effect of cortisol. Although the swelling and
pain of inflammation will be decreased, the white blood
cells that cause these signs will not be protecting the body
from invasion by bacteria or viruses. Antibodies will not
form complexes with foreign antigens, and bacteria will
not be destroyed by phagocytosis. The result of suppres-
sion of the immune response is illness. The respiratory
or gastrointestinal pathology (shipping fever) seen in
newly mixed or transported animals is a result of stress-
induced immunosuppression.
The adrenal glands are not the only ones stimulated by
stress. Thyroid-stimulating hormone is released from the
pituitary and stimulates release of thyroxine from the
thyroid gland. Thyroxine increases metabolic rate and,
therefore, calorigenesis. Carbohydrate stores will be
utilized first, and then fat stores.
Cortisol is a useful measure of some kinds of stress,
but not others. For example, cortisol increases when
horses are transferred from one environment to another
and when they are trailered, but chronic deprivation of
water or exercise does not cause cortisol to rise or the
response of cortisol to ACTH to change. Fortunately,
there are other physiological values that can be used.
Examples include plasma protein, which can be used to
assess the effects of furosemide. Furosemide is a drug
frequently administered to race horses, ostensibly to
prevent exercise-induced pulmonary hemorrhage. How-
ever, it also improves the animal’s performance, because
888 Well-Being Assessment: Physiological Criteria
the horse is 10 20 kilograms lighter in weight as a
consequence of diuresis. If a horse is treated with
furosemide, the loss of fluid from the circulation causes
an increase in plasma protein. If horses are given limited
amounts of water, as in mares used for estrogen
production, they have normal plasma protein but an
elevated osmotic pressure.
[6]
The most recently used physiological measure of well-
being is acute phase proteins. These are haptoglobins, a
glycoprotein of the alpha-2-globulin fraction by hapto-
cytes in response to stress, ACTH, and cortisol. They are
elevated following castration of piglets and after trans-
porting older pigs for more than 3 hours.
CONCLUSION
The animal whose well-being is compromised responds
with a variety of physiological changes. These can be
used, in combination with behavioral measures, to help us
determine the optimum housing, social grouping, and
transport of farm animals.
REFERENCES
1. Lay, D.C., Jr.; Friend, T.H.; Bowers, C.L.; Grissom, K.K.;
Jenkins, O.C. A comparative physiological and behav
ioral study of freeze and hot iron branding using dairy
cows. J. Anim. Sci. 1992, 70, 1120.
2. Dantzer, R.; Mormede, P. Stress in Domestic Animals: A
Psychoneuroendocrine Approach. In Animal Stress;
Moberg, G.P., Ed.; American Physiological Society:
Bethesda, MD, 1985; 81 95.
3. Barnett, J.L.; Hemsworth, P.H. The validity of physiolog
ical and behavioral measures of animal welfare. Appl.
Anim. Behav. Sci. 1990, 20, 177 187.
4. Stull, C.; McDonough, P. Multidisciplinary approach to
evaluating welfare of veal calves in commercial facilities.
J. Anim. Sci. 1994, 72, 2518 2524.
5. McGlone, J.J.; Salak, J.L.; Lumpkin, E.A.; Nicholson, R.I.;
Gibson, M.; Normal, R.L. Shipping stress and social status
effects on pig performance, plasma cortisol, natural killer
cell activity, and leukocyte numbers. J. Anim. Sci. 1993,
71 (4), 888.
6. Houpt, K.A.; Houpt, T.R.; Johnson, J.L.; Erb, H.N.; Yeon,
S.C. The effect of exercise deprivation on the behaviour
and physiology of straight stall confined pregnant mares.
Anim. Welf. 2001, 10, 257 267.
Well-Being Assessment: Physiological Criteria 889
Wool: Biology and Production
A. C. Schlink
N. R. Adams
CSIRO Livestock Industries, Wembley, Western Australia
INTRODUCTION
Wool is a generic description of hair from various breeds
of domesticated sheep (Ovis aries). Wool appears to be
the earliest material man used to spin and weave into
clothing, with evidence of shears for harvesting wool
being used around 1000
B.C. Requirement for shearing
implies development of sheep with a continuously
growing fleece. These developments associated with
domestication have continued until this day, although
wool is no longer a dominant textile fiber.
BIOLOGY
The gross morphology of a wool fiber is shown in Fig. 1.
[1]
The fiber is surrounded by cuticle cells that overlap in
only one direction, leading to directional frictional
characteristics and wool felting. The cuticle has four
layers with a combined thickness of 0.5 to 0.8 mm,
occupying between 6 and 16% of total fiber weight.
The cortex, composing 90% of fiber weight, consists of
two cell types, ortho- (60 to 90%) and paracortex cells (10
to 40%), the latter containing higher quantities of sulphur
than the former, resulting in a tougher cell with more
cross-linkage. Cortex cell-type arrangement changes with
increasing fiber diameter. In fine-wool Merinos, the
cortical cells are arranged in a bilateral manner, and the
border between cell types is arranged in helical pattern
along the fiber axis. This helical pattern results in fiber
crimp, with paracortex being situated in the inner part and
orthocortex in the outer part of the crimp. Cortex cells
have a spindlelike shape, being 45 to 95 mm long and 2 to
6 mm wide. Ortho-cortex cells rarely contain nuclear
remnants and cytoplasmic residues.
At its widest point, each cortical cell contains 5 to 20
clearly separated macrofibrils embedded in intermacrofi-
brillar matrix material, in a hexagonal array. Macrofibrils
are composed of bundles of 500 to 800 microfibrils.
Microfibrils, or intermediate filaments, are composed of
alpha-helical proteins of comparatively low cystine
content that are linked by both disulphide and hydrogen
bonds. A matrix of intermediate filament-associated
proteins surrounds microfibrils and is composed of two
families of nonhelical proteins, one being cystine-rich and
the other, glycine- and tyrosine-rich.
Wool is almost entirely composed of a family of
proteins known as alpha-keratins. Merino wool has higher
cystine content than coarse wools as a result of having a
larger proportion of high-sulphur alpha-keratin proteins.
Amino acid composition can vary between sheep, with the
growth phase of the wool follicle cycle and with the
nutritional status of the sheep.
Wool fiber diameters range 10 to 80 mm and have a
density of 1.304 g/cm
3
, with slightly and imperfectly
elliptical cross-sections. Wools with higher fiber diameter
tend to be hairlike and medulated. Proteins in wool have
the ability to adsorb water. At standard atmosphere of
65% relative humidity and 20°C, water regain ranges from
14 to 18%.
[2]
Wool fibers are highly elastic, and if not strained by
more than 30% of length for longer than one hour, they
can return to their original state by soaking in water. The
intrinsic strength of wool is low, varying between 50 and
300 megapascals.
Sheep wool follicles have a very long anagen phase,
with 1 2% of follicles inactive at any one time. The
general morphology of anagen follicles is shown in
Fig. 2.
[3]
A connective tissue sheath surrounds the tubular
down growth of epithelium, and there is a dermal papilla
responsible for cell division. Blood vessels are found in
the connective tissue sheath and, except in the smaller
secondary follicles of Merino sheep, the dermal papilla.
Primary and secondary follicles are distinguished by
their appendages and time of initiation in fetal skin.
Primary follicles form first, at about 60 days postconcep-
tion, and secondary follicles start 14 to 20 days later.
Variable numbers of secondary follicles may form either
as separate follicles or as outgrowths of other secondary
follicles. Sweat glands and arrector pili muscles are
appendages of primary follicles. Both follicle types have
sebaceous glands. The ratio of primary to secondary
follicles varies between sheep. Merino sheep with 19 mm
890 Encyclopedia of Animal Science
DOI: 10.1081/E EAS 120023830
Published 2005 by Marcel Dekker, Inc. All rights reserved.
Fig. 1 Gross morphology of a Merino wool fiber. (From CSIRO Livestock Industries.) (View this art in color at www.dekker.com.)
Fig. 2 Diagram of skin and wool follicle groups showing primary follicles, with arrector pili muscles and sweat glands, and secondary
follicles. (From CSIRO Livestock Industries.)
Wool: Biology and Production 891
wool have 80 follicles/mm
2
and a secondary to primary
follicle ratio of 20:1, whereas Drysdale sheep (43 mm)
have 13 follicles/mm
2
and a secondary to primary follicle
ratio of 5:1.
PRODUCTION
Wool production normally occurs in areas where the
pasture quality is adequate, but insufficient for meat
production. Seasonal variation in clean wool growth is
similar to the variation in availability of digestible dry
matter per hectare, or crude protein available per
hectare.
[4]
The amplitude in seasonal wool growth rate
ranged from 20.3% in Armidale, New South Wales, to
650% in Huang Cheng, China. Peak wool growth occurred
in the spring for cold, wet winter areas and in the summer
in summer rainfall, tropical areas. These changes in wool
growth are also seen in follicle bulb diameter, dermal
papilla length, skin weight, and the incidence of active
follicles in the skin.
[5]
Wool growth also varies between
years, reflecting annual pasture production cycles, with
amplitude in fleece weight between years varying from
15.8% to 118.5%.
Only 20% of the protein synthesized in skin is excreted
as wool, with the remaining 80% being degraded in the
skin or desquamated as epithelial cells. The value of 20%
is robust for a wide range of sheep breeds and feeding
levels.
[6]
Thus, genetic selection to increase fleece weight
also increases the rate of skin protein synthesis.
Fleece weight is affected by age, pregnancy, lactation,
and sex, with rams producing more wool than wethers or
ewes.
[7]
Fiber diameter increases by 3.9 mm from 18
months to 6 years of age in rams, but for ewes the increase
is 0.4 mm over the same period. Pregnancy and lactation
reduce fleece weight by 30 to 600 grams and fiber diame-
ter by 0.4 to 1.5 mm, and also affect staple strength.
[8]
Strong seasonal patterns in wool growth occur in many
breeds, with annual rhythms synchronized by photoperiod
acting through melatonin secreted by the pineal gland.
Breeds such as the Merino have a reduced response
to photoperiod.
Fiber diameter is the first determinant of wool price,
and many wool breeding programs aim to reduce fiber
diameter. Fiber diameter is changed by nutrient availabil-
ity between and within years, but is mainly determined by
the strain of sheep.
Seasonal variation in wool growth reduces staple
strength, which is the second most important determinant
of wool price. Staple strength has a strong genetic
component, depending on variation in fiber diameter,
fiber shedding, and the strength of individual fibers. For
breeding ewes, the most critical time remains the last two
weeks of pregnancy.
[9]
World greasy wool production peaked in 1990, with a
total production of 2970 million kilograms, and declined
to 2217 million kilograms in 2002 (Table 1). On a clean
wool basis, Australia and New Zealand are the world’s
two largest wool producers, although China produces
more greasy wool than New Zealand. Australia is the
dominant producer of Merino sheep in the 18- to 23-mm
range for apparel production. New Zealand wool produc-
tion is dominated by Romney sheep in the 30- to 38-mm
range, which is suitable for carpets. China has increased
wool production from 7.2% of world greasy wool in 1988
to 13.2% in 2002.
World production statistics are provided on a greasy
wool basis, and greasy wool contains from 30 to 70%
impurities. Wool impurities are wax, suint, dust, and
vegetable matter. Sheep coats successfully reduce these
contaminants. Low wool yields in countries such as China
are a consequence of overnight corralling of sheep
for feeding during cold winters and protection from
the elements.
CONCLUSION
The average fine-wool sheep produces some 6000 kilo-
meters of a complex protein fiber each year. This fiber is
produced from wool follicles that use 20% of the protein
turnover in skin. Wool is predominantly produced from
Table 1 Principal greasy wool producing countries and world
production from 1988 to 2002 (million kg)
Year Australia
New
Zealand China
Eastern
Europe World
1988 916 346 209 613 2,919
1989 959 339 222 627 2,967
1990 1102 311 237 623 2,970
1991 1066 305 239 592 2,953
1992 875 296 240 526 2,989
1993 869 256 238 456 2,913
1994 829 284 240 439 2,817
1995 731 289 260 409 2,689
1996 725 275 298 263 2,541
1997 700 266 255 229 2,418
1998 684 252 277 198 2,379
1999 678 253 283 188 2,348
2000 652 237 291 187 2,303
2001 600 246 294 188 2,239
2002 565 253 293 189 2,217
(From the International Wool Textile Organization.)
892 Wool: Biology and Production
grazing lands and is highly seasonal in growth. Australia
is the largest producer, with 25.5% of the world
production of 2217 million kilograms in 2002.
REFERENCES
1. Hocker, H. Fibre Morphology. In Wool: Science and
Technology; Simpson, W.S., Crawshaw, G.H., Eds.; CRC
Press: Cambridge, England, 2002; 60 79.
2. Heale, J.W.S. Physical Properties of Wool. In Wool: Science
and Technology; Simpson, W.S., Crawshaw, G.H., Eds.;
CRC Press: Cambridge, England, 2002; 80 129.
3. Orwin, D.F.G. Variation in Wool Follicle Morphology. In
The Biology of Wool and Hair; Rogers, G.E., Reis, P.J.,
Ward, K.A., Marshall, R.C., Eds.; Chapman and Hall: New
York, 1989; 227 241.
4. Schlink, A.C.; Mata, G.; Lea, J.M.; Ritchie, A.J.M. Seasonal
variation in fibre diameter and length in wool of grazing
Merino sheep with low or high staple strength. Aust. J. Exp.
Agric. 1999, 39, 507 517.
5. Schlink, A.C.; Sanders, M.; Hollis, D.E. Seasonal variations
in skin and wool follicle morphology of grazing Merino
sheep with low or high staple strength. Asian Australas. J.
Anim. Sci. 2000, 13 (Suppl. A), 253 256.
6. Adams, N.R.; Liu, S.; Masters, D.G. Regulation of Protein
Synthesis for Wool Growth. In Ruminant Physiology:
Digestion, Metabolism, Growth and Reproduction; Cronje,
P.B., Ed.; CAB International, 2000; 255 272.
7. Corbett, J.L. Variation in Wool Growth with Physiolog
ical State. In Physiology and Environmental Limitations
to Wool Growth; Black, J.L., Reis, P.J., Eds.; The Uni
versity of New England Publishing Unit: Australia, 1979;
79 98.
8. Hynd, P.I.; Masters, D.G. Nutrition and Wool Growth. In
Sheep Nutrition; Freer, M., Dove, H., Eds.; CAB Interna
tional, 2002; 165 187.
9. Robertson, S.M.; Robards, G.E.; Wofle, E.C. The timing of
nutritional restriction during reproduction influences staple
strength. Aust. J. Agric. Res. 2000, 51, 125 132.
Wool: Biology and Production 893