Synthesis and Physical Properties of Polyester Amides Derived from Lipid-Based Components
Bạn đang xem bản rút gọn của tài liệu. Xem và tải ngay bản đầy đủ của tài liệu tại đây (1.93 MB, 40 trang )
1
Synthesis and Physical Properties of
Polyester Amides Derived from
Lipid-Based Components
By: Jiaqing Zuo
Trent Biomaterials Research Group
March 2011
2
Outline
Introduction of polyester amide (PEA)
What is polyester amide
Applications
Advantage of Lipid-based components
Previous Examples of Lipid-based PEA
Objectives and Results
Conclusions
3
Introduction
What is polyester amide (PEA)
Boc
H
N COOH
Boc
H
N
O O O O
H
N
Boc
O OOO
TFA
H
N
O O O O
H
N
O OOO
Cl Cl
O O
H
2
N
O O O O
NH
2
O OOO
*
O
*
O
n
HO O O OH
O O
1
2
Ester linkage Amide linkage
Ester linkage: Biodegradability
Amide linkage: Thermal Stability, Mechanical Strength
4
Applications
Biomedical applications:
Stent-coatings for drug delivery
Absorbable surgical materials
Material requirements:
Biodegradable
Good processing property
Safely metabolized by human bodies
References:
1. Lee, S.H., et al., Coronary Artery Disease, 2002. 13(4): p. 237-241.
2. Legashvili, I., et al., Journal of Biomaterials Science-Polymer Edition, 2007. 18(6): p. 673-685.
3. Guo, K. and C.C. Chu, Journal of Polymer Science Part a-Polymer Chemistry, 2005. 43(17): p. 3932-3944.
5
Advantage of Lipid-based
components
Functional groups:
Carboxylic group
Double bonds
Advantages:
Economically friendly
Environmentally friendly
Potentially have good performance
as petroleum based materials
References:
1. Hojabri, L., X.H. Kong, and S.S. Narine,. Biomacromolecules, 2009. 10(4): p. 884-891.
2. Williams, C.K. and M.A. Hillmyer,. Polymer Reviews, 2008. 48(1): p. 1-10.
6
Previous Examples of
Lipid-based PEA
PEA derived from:
Pongamia glabra oil Linseed oil
Disadvantages:
Not all building blocks are from sustainable materials
Not suitable for biomedical applications
References:
1. Ahmad, S., S.M. Ashraf, and F. Zafar,. Journal of Applied Polymer Science, 2007. 104(2): p. 1143-1148.
2. Zafar, F., et al.,. Journal of Applied Polymer Science, 2005. 97(5): p. 1818-1824.
3. Ahmad, S., et al.,. Progress in Organic Coatings, 2003. 47(2): p. 95-102.
O
O
O
O
R
R
O
R
O
HN
OH
OH
+
N
OH
OH
R
O
OH
O
HO
O
NaOCH
3
Diethanolamine
7
Objectives
1. Synthesis of PEAs with different ester/amide
ratios
PEA (I) with ester: amide= 1:1
PEA (II) with ester: amide= 2:1
PEA (III) with ester: amide= 3:1
8
Hypotheses:
1. The increase of ester to amide ratios in the PEA
structure will result in a decrease of thermal stability
2. The increase of ester to amide ratio in PEA structure
will decrease the glass transition temperature
3. The increase of ester to amide ratio in PEA will result in
increased elasticity
4. The increase of ester to amide ratio in PEA structure
will diminish the mechanical strength of the polymer
9
Step 1: Synthesis of different diols from oleic acid
1, 9-Nonanediol
Synthesis of the PEA
10
Di-ester diol
Tetra-ester diol
Step 1: Synthesis of different diols from oleic acid
11
Characterization of the diols
1
H-NMR spectra
1, 9-Nonanediol Di-ester diol
Tetra-ester diol
12
Step 2: Polyester amide preparation
PEA
13
FT-IR spectra of PEAs
Characterization of PEAs
N-H stretching vibration:
3200–3500 cm
-1
C-H stretching vibration:
2850-3000 cm
-1
C=O stretching vibration:
1700–1740 cm
-1
N-H bending vibration:
1560-1640 cm
-1
( ) ( ) ( )
( ) ( ) ( )
: : 1: 2:3
ester I ester II ester III
amide I amide II amide III
A A A
A A A
14
Characterization of the PEAs
M
n
M
w
PDI
PEA (I) 2.08e4 2.98e4 1.43
PEA (II) 2.09e4 3.44e4 1.64
PEA (III) 2.26e4 3.63e4 1. 61
GPC results
M
n
: Number average molecular weight
M
w
: Weight average molecular weight
PDI: Polydispersity index
15
The hydrogen bonding structures
PEA(I)
PEA(II)
PEA(III)
PEA (I)
PEA (II)
PEA
(III)
Molecular weight of
the repeating unit
(g/mol)
484
712
1025
Hydrogen bonding
sites
86
58
44
Length of the repeating
unit (Å)
31
48
73
Hydrogen bond density
(1/Å)
0.065
0.042
0.028
16
Physical Tests
1) Thermogravimetric Analysis (TGA)
• Thermal stability
• Weight changes vs. Temperature
17
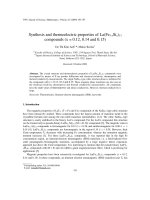
TGA Results
T
D1
(
o
C) WL1
(%)
T
D2
(
o
C) WL2
(%)
T
D3
(
o
C)
WL3
(%)
T
D4
(
o
C) WL4
(%)
T
D5
(
o
C) WL5
(%)
PEA (I) 367 35.4 411 33.7 446 13.3 461 6.2
PEA (II) 371 35.6 402 29.8 432 25.6 444 4.3 458 3.7
PEA (III) 383 31.0 410 30.1 452 28.2 467 3.5
T
D:
Decomposition Temperature WL: Weight Loss
18
2) Modulated Differential Scanning Calorimetry (MDSC)
• Melting temperature (T
m
)
• Crystallization temperature (T
c
)
• Glass transition temperature (T
g
)
19
T
g
: Glass Transition Temperature
T
g
MDSC Results
PEA (I) PEA (II) PEA (III)
T
g
(
o
C) (DSC) 3.4 -20.0 -34.1
20
T
c1
(
o
C) T
m1
(
o
C) T
c2
(
o
C) T
m2
(
o
C)
PEA (I)
66.1 87.8
PEA (II)
14.2 49.3 56.0 77.4
PEA (III)
31.9 54.9 58.8 76.0
T
m
: Melting Temperature; T
c
: Crystallization Temperature
MDSC Results
21
• Viscoelastic properties
• Measuring glass transition temperature
3) Dynamic Mechanical Analysis (DMA)
22
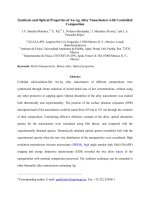
DMA Results
Storage Modulus at 37
o
C
23
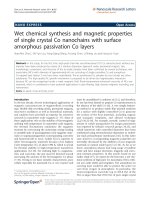
PEA (I) PEA (II) PEA (III)
T
g
(
o
C) (DMA)
17.9 -1.6 -15.0
T
g
(
o
C) (DSC) 3.4 -20.0 -34.1
T
g
(DMA) is reported from the peak value of tan δ
DMA Results
/Tan E E
24
T
g
(DMA) versus Structures
25
4) Tensile analysis
• Ultimate strength
• Elongation
• Young’s Modulus