Vault Career Guide to Investment Banking Part 2 potx
Bạn đang xem bản rút gọn của tài liệu. Xem và tải ngay bản đầy đủ của tài liệu tại đây (395.54 KB, 20 trang )
Visit the Vault Finance Career Channel at www.vault.com/finance – with
insider firm profiles, message boards, the Vault Finance Job Board and more.
17
C A R E E R
L I B R A R Y
“The Dow Jones Industrial Average added 38.93 points to 10,424.41,
bolstered by a 1.2 percent gain in component Intel,” The Wall Street
Journal reported on November 11, 2004. The Journal also reported
that Intel gains helped boost the Nasdaq Composite Index, but oil
futures were on the decline again.”
If you are new to the financial industry, you may be wondering exactly what
all of these headlines mean and how to interpret them. The next two
chapters are intended to provide a quick overview of the financial markets
and what drives them, and introduce you to some market lingo as well. For
reference, many definitions and explanations of many common types of
securities can be found in the glossary at the end of this guide.
Bears vs. Bulls
Almost everyone loves a bull market, and an investor seemingly cannot go
wrong when the market continues to reach new highs. At Goldman Sachs,
a bull market is said to occur when stocks exhibit expanding multiples – we
will give you a simpler definition. Essentially, a bull market occurs when
stock prices (as measured by an index like the Dow Jones Industrial or the
S&P 500) move up. A bear market occurs when stocks fall. Simple. More
specifically, bear markets generally occur when the market has fallen by
greater than 20 percent from its highs, and a correction occurs when the
market has fallen by more than 10 percent but less than 20 percent. The
most widely publicized, most widely traded, and most widely tracked stock
index in the world is the Dow Jones Industrial Average. The Dow was
created in 1896 as a yardstick to measure the performance of the U.S. stock
market in general. Initially composed of only 12 stocks, the Dow began
trading at a mere 41 points. Today the Dow is made up of 30 large
companies in a variety of industries and is measured in the thousands of
points. In November 1999, the Dow Jones updated its composite, adding
and removing companies to better reflect the current economy. Union
Carbide, Goodyear Tire & Rubber, Sears, Roebuck & Co., and Chevron
were removed. Microsoft, Intel, SBC Communications, and Home Depot
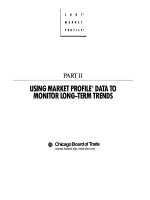
were added. The stocks in the following chart comprise the index as of the
publication of this guide.
The Equity Markets
CHAPTER 3
© 2005 Vault Inc.
1818
Components of the Dow Jones Industrial
Average (as of 12/04)
The Dow and Nasdaq
The Dow has historically performed remarkably well, particularly in the
late 1990s. In 2000 the Dow soared above 11,000 points (as of December
2004, it was back down below that threshold). Propelling the Dow upward
was a combination of the success of U.S. businesses in capturing
productivity/efficiency gains, the continuing economic expansion, rapidly
growing market share in world markets, and the U.S.’s global dominance in
the expanding technology sectors. Although the Dow is widely watched
and cited because it’s comprised of select, very large companies (known as
“large caps”), the Dow cannot gauge fluctuations and movements in
smaller companies (or “small caps”).
The Nasdaq Composite has garnered significant interest in recent years
mainly because it is driven by technology-related stocks. The Nasdaq stock
market is an electronic market on which the stocks of many well-know
technology companies (including Microsoft and Intel) trade. In early 2000,
the Nasdaq stock market became the first stock market to trade two billion
shares in a single day.
In early 2000, both the Dow and the Nasdaq were at record highs, but critics
were wary of the end of the bull market. April 2000 was that end; both indices
started a slow slide that lasted over a year and coincided with a general
economic malaise. The indices’ slow slide became a free-fall on September
17, 2001, the first day of trading after the terrorist attacks on the World
Trade Center and the Pentagon. The Dow fell 7.13 percent, losing 684.81,
the largest point drop ever. The Nasdaq was down 6.83 percent, or 115.83
percent. The plunge is a good illustration of how outside events affect the
stock markets; investors feared the economic impact of the attacks and the
Vault Career Guide to Investment Banking
The Equity Markets
3M Co. Exxon Mobil McDonald’s
Alcoa General Electric Merck & Co.
Altria Group General Motors Microsoft
American Express Honeywell International Pfizer
Caterpillar United Technologies
Boeing Home Depot SBC Communications
A.I.G Hewlett-Packard Procter & Gamble
IBM
Citigroup Intel Verizon Communications
Coca-Cola Co. Johnson & Johnson Wal-Mart
E.I. DuPont de Nemours JPMorgan Chase Walt Disney
Source: Dow Jones & Co.
ensuing military response. It’s worth noting that the markets reacted the
same way after events of similar historical significance, including the
bombing of Pearl Harbor and the assassination of President John F. Kennedy.
More recently, in 2003, for the first year since 1999, the Dow Jones
Industrial Index finished on an uptick, gaining 25.3 percent and surpassing
the 25.2 percent climb it made in 1999. The Nasdaq composite index also
ended 2003 in solid fashion, increasing 50 percent during the year. Driving
the gains in the market were low interest rates, a weaker dollar and low
inventories. The only real downtick during the year, when stocks hit their
lows, came in March during the outset of the war in Iraq.
Visit the Vault Finance Career Channel at www.vault.com/finance – with
insider firm profiles, message boards, the Vault Finance Job Board and more.
19
C A R E E R
L I B R A R Y
Vault Career Guide to Investment Banking
The Equity Markets
A Word of Caution about the Dow
While the Dow may dominate news and conversation, investors should
take care to know it has limitations as a market barometer. For one, the
Dow can move be swiftly moved by changes in only one stock. Roughly
speaking, for every dollar that a Dow component stock moves, the Dow
Index will move by approximately four points. Therefore, a $10 move
in IBM one day will cause a change in the Dow of 40 points! Also, the
Dow is only composed of immense companies, and will only reflect
movements in big-cap stocks. The Dow tends to have more
psychological significance to individual investors than to professional
investors, who tend to follow broader market indices.
© 2005 Vault Inc.
2020
Other benchmarks
Besides the Dow Jones and the Nasdaq Composite, investors follow many
other important benchmarks. The NYSE Composite Index, which
measures the performance of every stock traded on the New York Stock
Exchange, represents an excellent broad market measure. The S&P 500
Index, composed of the 500 largest publicly traded companies in the
U.S., also presents a widely followed broad market measure, but, like the
Dow is limited to large companies. The Russell 2000 compiles 2000 small-
cap stocks, and measures stock performance in that segment of companies.
Note that Wall Street money managers tend to measure their performance
against one of these market indices.
Big-cap and small-cap
At a basic level, market capitalization or market cap represents the
company’s value according to the market, and is calculated by multiplying
the total number of shares by share price. (This is the equity value of the
company.) Companies and their stocks tend to be categorized into three
broad categories: big-cap, mid-cap and small-cap.
While there are no hard and fast rules, generally speaking, a company with
a market cap greater than $5 billion will be classified as a big-cap stock.
These companies tend to be established, mature companies, although with
some IPOs rising rapidly, this is not necessarily the case. Sometimes huge
companies with $25 billion and greater market caps, for example, GE and
Microsoft, are called mega-cap stocks. Small-cap stocks tend to be riskier,
but are also often the faster growing companies. Roughly speaking, a
small-cap stock includes those companies with market caps less than $1
billion. And as one might expect, the stocks in between $1 billion and $5
billion are referred to as mid-cap stocks.
What moves the stock market?
Not surprisingly, the factors that most influence the broader stock market
are economic in nature. Among equities, corporate profits and the interest
rates are king.
Corporate profits: When Gross Domestic Product slows substantially,
market investors fear a recession and a drop in corporate profits. And if
economic conditions worsen and the market enters a recession, many
companies will face reduced demand for their products, company earnings
will be hurt, and hence equity (stock) prices will decline. Thus, when the
GDP suffers, so does the stock market.
Vault Career Guide to Investment Banking
The Equity Markets
Visit the Vault Finance Career Channel at www.vault.com/finance – with
insider firm profiles, message boards, the Vault Finance Job Board and more.
21
C A R E E R
L I B R A R Y
Interest rates: When the Consumer Price Index heats up, investors fear
inflation. Inflation fears trigger a different chain of events than fears of
recession. Most importantly, inflation will cause interest rates to rise.
Companies with debt will be forced to pay higher interest rates on existing
debt, thereby reducing earnings (and earnings per share). And
compounding the problem, because inflation fears cause interest rates to
rise, higher rates will make investments other than stocks more attractive
from the investor’s perspective. Why would an investor purchase a stock
that may only earn 8 percent (and carries substantial risk), when lower risk
CD’s and government bonds offer similar yields with less risk? These
inflation fears are known as capital allocations in the market (whether
investors are putting money into stocks vs. bonds), which can substantially
impact stock and bond prices. Investors typically re-allocate funds from
stocks to low-risk bonds when the economy experiences a slowdown and
vice versa when the opposite occurs.
What moves individual stocks?
When it comes to individual stocks, it’s all about earnings, earnings,
earnings. No other measure even compares to earnings per share (EPS)
when it comes to an individual stock’s price. Every quarter, public
companies must report EPS figures, and stockholders wait with bated
breath, ready to compare the actual EPS figure with the EPS estimates set
by Wall Street research analysts. For instance, if a company reports $1.00
EPS for a quarter, but the market had anticipated EPS of $1.20, then the
stock will almost certainly be dramatically hit in the market the next trading
day. Conversely, a company that beats its estimates will typically rally in
the markets.
It is important to note at this point, that in the frenzied Internet stock market
of 1999 and early 2000, investors did not show the traditional focus on near-
term earnings. It was acceptable for these companies to operate at a loss for
a year or more, because these companies, investors hoped, would achieve
long term future earnings. However, when the markets turned in the spring
of 2000 investors began to expect even “new economy” companies to
demonstrate more substantial near-term earnings capacity.
The market does not care about last year’s earnings or even last quarter’s
earnings. What matters most is what will happen in the near future.
Investors maintain a tough, “what have you done for me lately” attitude,
and forgive slowly a company that consistently fails to meet analysts’
estimates (“misses its numbers”).
Vault Career Guide to Investment Banking
The Equity Markets
© 2005 Vault Inc.
2222
Stock Valuation Measures and Ratios
As far as stocks go, it is important to realize that absolute stock prices mean
nothing. A $100 stock could be “cheaper” than a $10 stock. To clarify how
this works, consider the following ratios and what they mean. Keep in mind
that these are only a few of the major ratios, and that literally hundreds of
financial and accounting ratios have been invented to compare dissimilar
companies. Again, it is important to note that most of these ratios were not
as applicable in the market’s recent evaluation of certain Internet and
technology stocks.
P/E ratio
You can’t go far into a discussion about the stock market without hearing
about the all-important price to earnings ratio, or P/E ratio. By definition,
a P/E ratio equals the stock price divided by the earnings per share. In
usage, investors use the P/E ratio to indicate how cheap or expensive a
stock is.
Consider the following example. Two similar firms each have $1.50 in
EPS. Company A’s stock price is $15.00 per share, and Company B’s stock
price is $30.00 per share.
Clearly, Company A is cheaper than Company B with regard to the P/E ratio
because both firms exhibit the same level of earnings, but A’s stock trades
at a higher price. That is, Company A’s P/E ratio of 10 (15/1.5) is lower
than Company B’s P/E ratio of 20 (30/1.5). Hence, Company A’s stock
trades at a lower price. The terminology one hears in the market is,
“Company A is trading at 10 times earnings, while Company B is trading at
20 times earnings.” Twenty times is a higher multiple.
However, the true measure of cheapness vs. richness cannot be summed up
by the P/E ratio. Some firms simply deserve higher P/E ratios than others,
and some deserve lower P/Es. Importantly, the distinguishing factor is the
anticipated growth in earnings per share.
Vault Career Guide to Investment Banking
The Equity Markets
Company Stock Price
Earnings
Per Share
P/E Ratio
A
$ 15.00 $1.50 10x
B
$ 30.00 $1.50 20x
Visit the Vault Finance Career Channel at www.vault.com/finance – with
insider firm profiles, message boards, the Vault Finance Job Board and more.
23
C A R E E R
L I B R A R Y
PEG ratio
Because companies grow at different rates, another comparison investors
often make is between the P/E ratio and the stock’s expected growth rate in
EPS. Returning to our previous example, let’s say Company A has an
expected EPS growth rate of 10 percent, while Company B’s expected
growth rate is 20 percent.
We might propose that the market values Company A at 10 times earnings
because it anticipates 10 percent annual growth in EPS over the next five
years. Company B is growing faster – at a 20 percent rate – and therefore
justifies the 20 times earnings stock price. To determine true cheapness,
market analysts have developed a ratio that compares the P/E to the growth
rate – the PEG ratio. In this example, one could argue that both companies
are priced similarly (both have PEG ratios of 1).
Sophisticated market investors therefore utilize this PEG ratio rather than
just the P/E ratio. Roughly speaking, the average company has a PEG ratio
of 1:1 or 1 (i.e., the P/E ratio matches the anticipated growth rate). By
convention, “expensive” firms have a PEG ratio greater than one, and
“cheap” stocks have a PEG ratio less than one.
Cash flow multiples
For companies with no earnings (or losses) and therefore no EPS (or
negative EPS), one cannot calculate the P/E ratio – it is a meaningless
number. An alternative is to compute the firm’s cash flow and compare that
to the market value of the firm. The following example illustrates how a
typical cash flow multiple like Enterprise Value/EBITDA ratio is
calculated.
EBITDA: A proxy for cash flow, EBITDA stands for Earnings Before
Interest, Taxes, Depreciation and Amortization. To calculate EBITDA,
work your way up the Income Statement, adding back the appropriate
items to net income. (Note: For a more detailed explanation of this and
other financial caculations, see the Vault Guide to Finance Interviews.)
Adding together depreciation and amortization to operating earnings, a
common subtotal on the income statement, can serve as a shortcut to
calculating EBITDA.
Vault Career Guide to Investment Banking
The Equity Markets
Company Stock Price
Earnings
Per Share
P/E Ratio
A
$ 15.00 $1.50 10x
B
$ 30.00 $1.50 20x
Estimated Growth
Rate in EPS
10x
20x
Enterprise value (EV) = market value of equity + net debt. To
compute market value of equity, simply multiply the current stock price
times the number of shares outstanding. Net debt is simply the firm’s
total debt (as found on the balance sheet) minus cash.
Enterprise value to revenue multiple (EV/revenue)
If you follow startup companies or young technology or healthcare related
companies, you have probably heard the multiple of revenue lingo.
Sometimes it is called the price-sales ratio (though this technically is not
correct). Why use this ratio? For one, many firms not only have negative
earnings, but also negative cash flow. That means any cash flow or P/E
multiple must be thrown out the window, leaving revenue as the last
positive income statement number left to compare to the firm’s enterprise
value. Specifically one calculates this ratio by dividing EV by the last 12
months revenue figure.
Return on equity (ROE)
ROE = Net income divided by total shareholders equity. An important
measure, especially for financial services companies, that evaluates the
income return that a firm earned in any given year. Return on equity is
expressed as a percentage. Many firms’ financial goal is to achieve a
certain level of ROE per year, say 20 percent or more.
© 2005 Vault Inc.
2424
Vault Career Guide to Investment Banking
The Equity Markets
For more information on valuation, bond pricing, and other
finance interview concepts, go to the Finance Career Channel
• Vault Guide to Finance Interviews
• Vault Finance Interviews Practice Guide
• Vault Guide to Advanced and Quantitative Finance Interviews
• One-on-one Finance Interview Prep with Vault experts
www.vault.com/finance
Value Stocks, Growth Stocks and Momentum
Investors
It is important to know that investors typically classify stocks into one of
two categories – growth and value stocks. Momentum investors buy a
subset of the stocks in the growth category.
Value stocks are those that often have been battered by investors.
Typically, a stock that trades at low P/E ratios after having once traded at
high P/E’s, or a stock with declining sales or earnings fits into the value
category. Investors choose value stocks with the hope that their businesses
will turn around and profits will return. Or, investors perhaps realize that a
stock is trading close to or even below its “break-up value” (net proceeds
upon liquidation of the company), and hence have little downside.
Growth stocks are just the opposite. High P/E’s, high growth rates, and
often hot stocks fit the growth category. Technology stocks, with
sometimes astoundingly high P/E’s, may be classified as growth stocks,
based on their high growth potential. Keep in mind that a P/E ratio often
serves as a proxy for a firm’s average expected growth rate, because as
discussed, investors will generally pay a high P/E for a faster growing
company.
Momentum investors buy growth stocks that have exhibited strong upward
price appreciation. Usually trading at or near their “52-week highs” (the
highest trading price during the previous two weeks), momentum investors
cause these stocks to trade up and down with extreme volatility.
Momentum investors, who typically don’t care much about the firm’s
business or valuation ratios, will dump their stocks the moment they show
price weakness. Thus, a stock run-up by momentum investors can
potentially crash dramatically as they bail out at the first sign of trouble.
Vault Career Guide to Investment Banking
The Equity Markets
Visit the Vault Finance Career Channel at www.vault.com/finance – with
insider firm profiles, message boards, the Vault Finance Job Board and more.
25
C A R E E R
L I B R A R Y
Basic Equity Definitions
Common stock: Also called common equity, common stock represents
an ownership interest in a company. The vast majority of stock traded
in the markets today is common. Common stock enables investors to
vote on company matters.
Convertible preferred stock: This is a relatively uncommon type of
equity issued by a company, often when it cannot successfully sell
Vault Career Guide to Investment Banking
The Equity Markets
© 2005 Vault Inc.
26
either straight common stock or straight debt. in a manner similar to the
way a bond pays coupon payments. However, preferred stock
ultimately converts to common stock after a period of time. Preferred
stock can be viewed as a mix of debt and equity, and is most often used
as a way for a risky company to obtain capital when neither debt nor
equity works.
Non-convertible preferred stock: Sometimes companies (usually those
with steady and predictable earnings) issue non-convertible preferred
stock that pays steady dividends. This stock remains outstanding in
perpetuity and trades similar to bonds. Utilities represent the best
example of non-convertible preferred stock issuers. Preferred stock
pays a dividend,
Visit the Vault Finance Career Channel at www.vault.com/finance – with
insider firm profiles, message boards, the Vault Finance Job Board and more.
27
C A R E E R
L I B R A R Y
What is the Bond Market?
What is the bond market? The average person doesn’t follow it and often
doesn’t even hear very much about it. Because of the bond market’s low
profile, it’s surprising to many people that the bond markets are even larger
than the equity markets.
Until the late 1970s and early 80s, bonds were considered unsexy
investments, bought by retired grandparents, retirement funds, and
insurance companies. They traded infrequently, and provided safe, steady
returns. Beginning in the early 1980s, however, Michael Milken essentially
created the “junk bond” world, making a killing at the same time. And with
the development of mortgage-backed securities, Salomon Brothers also
helped transform bonds into something exciting and extremely profitable for
investment banks.
To begin our discussion of the fixed income markets, we’ll identify the
main types of securities that comprise it. We’ll discuss some of these more
in-depth throughout the chapter.
• U.S. Government Treasury securities
• Agency bonds
• High grade corporate bonds
• High yield (junk) bonds
• Municipal bonds
• Mortgage-backed bonds
• Asset-backed securities
• Emerging market bonds
Bond Market Indicators
The yield curve
Bond “yields” are the current rate of return to an investor who buys the
bond. (Yield is measured in “basis points”; each basis point = 1/100 of one
The Fixed
Income Markets
CHAPTER 4
© 2005 Vault Inc.
2828
percent.) A primary measure of importance to fixed income investors is the
yield curve. The yield curve (also called the “term structure of interest
rates”) depicts graphically the yields on different maturity U.S. government
securities. To construct a simple yield curve, investors typically look at the
yield on a 90-day U.S. T-bill and then the yield on the 30-year U.S.
government bond (called the Long Bond). Typically, the yields of shorter-
term government T-bill are lower than Long Bond’s yield, indicating what
is called an “upward sloping yield curve.” Sometimes, short-term interest
rates are higher than long-term rates, creating what is known as an “inverse
yield curve.”
Bond indices
As with the stock market, the bond market has some widely watched
indexes of its own. One prominent example is the Lehman Government
Corporate Bond Index (“LGC”). The LGC index measures the returns on
mostly government securities, but also blends in a portion of corporate
bonds. The index is adjusted periodically to reflect the percentage of assets
in government and in corporate bonds in the market. Mortgage bonds are
excluded entirely from the LGC index.
U.S. government bonds
Particularly important in the universe of fixed income products are U.S.
government bonds. These bonds are the most reliable in the world, as the
U.S. government is unlikely to default on its loans (and if it ever did, the
world financial market would essentially be in shambles). Because they are
virtually risk-free, U.S. government bonds, also called Treasuries, offer
relatively low yields (a low rate of interest), and are the standards by which
other bond yields are measured.
Spreads
In the bond world, investors track “spreads” as carefully as any single index
of bond prices or any single bond. The spread is essentially the difference
between a bond’s yield (the amount of interest, measured in percent, paid to
Vault Career Guide to Investment Banking
Fixed Income Markets
Visit the Vault Finance Career Channel at www.vault.com/finance – with
insider firm profiles, message boards, the Vault Finance Job Board and more.
29
C A R E E R
L I B R A R Y
bondholders), and the yield on a U.S. Treasury bond of the same time to
maturity. For instance, an investor investigating the 20-year Acme Corp.
bond would compare it to a U.S. Treasury bond that has 20 years remaining
until maturity. Because U.S. Treasury bonds are considered to have zero
risk of default, a corporation’s bond will always trade at a yield that is over
the yield on a comparable Treasury bond. For example, if the Acme Corp.
10-year bond traded at a yield of 8.4 percent and a 10-year Treasury note
was trading at 8 percent, a trader would say that the Acme bond was trading
at “40 over” (here, the “40” refers to 40 basis points).
Bond ratings for corporate and municipal bonds
A bond’s risk level, or the risk that the bond issuer will default on payments
to bondholders, is measured by bond rating agencies. Several companies
rate credit, but Standard & Poor’s and Moody’s are the two largest. The
riskier a bond, the larger the spread: low-risk bonds trade at a small spread
to Treasuries, while below-investment grade bonds trade at tremendous
spreads to Treasuries. Investors refer to company specific risk as credit
risk.
Triple A ratings represents the highest possible corporate bond designation,
and are reserved for the best-managed, largest blue-chip companies. Triple
A bonds trade at a yield close to the yield on a risk-free government
Treasury. Junk bonds, or bonds with a rating of BB or below on the S&P
scale, currently trade at yields ranging from 10 to 15 percent, depending on
the precise rating and government bond interest rates at the time.
Companies continue to be monitored by the rating agencies as long as their
bonds trade in the markets. If a company is put on “credit watch,” it is
possible that the rating agencies are considering raising or lowering the
rating on the company. Often an agency will put a company’s bonds on
credit watch “with postive or negative implications,” giving investors a
preview of which way any future change will go. When a bond is actually
downgraded by Moody’s or S&P, the bond’s price drops dramatically (and
therefore its yield increases).
Vault Career Guide to Investment Banking
Fixed Income Markets
© 2005 Vault Inc.
3030
The following table summarizes rating symbols of the two major rating
agencies and provides a brief definition of each.
Factors affecting the bond market
What factors affect the bond market? In short, interest rates. The general
level of interest rates, as measured by many different barometers (see inset)
moves bond prices up and down, in dramatic inverse fashion. In other
words, if interest rates rise, the bond markets suffer.
Think of it this way. Say you own a bond that is paying you a fixed rate of
8 percent today, and that this rate represents a 1.5 percent spread over
Treasuries. An increase in rates of 1 percent means that this same bond
purchased now (as opposed to when you purchased the bond) will now
yield 9 percent. And as the yield goes up, the price declines. So, your bond
loses value and you are only earning 8 percent when the rest of the market
is earning 9 percent.
You could have waited, purchased the bond after the rate increase, and
earned a greater yield. The opposite occurs when rates go down. If you
lock in a fixed rate of 8 percent and rates plunge by 1 percent, you now earn
more than those who purchase the bond after the rate decrease. Therefore,
as interest rates change the price or value of bonds will rise or fall so that
all comparaqble bonds will trade at the same yield regardless of when or at
what interest rate these bonds were issued.
Vault Career Guide to Investment Banking
Fixed Income Markets
S & P Moody’s
Rating
AAA AaaHighest quality
AA AaHigh quality
A A
Upper medium quality
BBB Baa
Medium grade
BB Ba
Somewhat speculative
B BLow grade, speculative
CCC CaaLow grade, default possible
CC CaLow grade, partial recovery possible
C CDefault expected
Source: Moody’s Investor’s Service and Standard and Poor’s
Bond Rating Codes
Visit the Vault Finance Career Channel at www.vault.com/finance – with
insider firm profiles, message boards, the Vault Finance Job Board and more.
31
C A R E E R
L I B R A R Y
Vault Career Guide to Investment Banking
Fixed Income Markets
Which Interest Rate Are You Talking
About?
Investment banking professionals often discuss interest rates in general
terms. But what are they really talking about? So many rates are
tossed about that they may be difficult to track. To clarify, we will take
a brief look at the key rates worth tracking. We have ranked them in
typically ascending order: the discount rate usually is the lowest rate; the
yield on junk bonds is usually the highest.
The discount rate: The discount rate is the rate that the Federal Reserve
charges on overnight loans to banks. Today, the discount rate can be
directly changed by the Fed, but maintains a largely symbolic role.
Federal funds rate: The rate domestic banks charge one another on
overnight loans to meet Federal Reserve requirements. This rate is also
directly controlled by the Fed and is a critical interest rate to financial
markets.
T-Bill yields: The yield or internal rate of return an investor would receive
at any given moment on a 90- to 360-day Treasury bill.
LIBOR (London Interbank Offered Rate): The rate banks in England
charge one another on overnight loans or loans up to five years. Often
used by banks to quote floating rate loan interest rates. Typically, the
benchmark LIBOR used on loans is the three-month rate.
The Long Bond (30-Year Treasury) yield: The yield or internal rate of
return an investor would receive at any given moment on the 30-year
U.S. Treasury bond.
Municipal bond yields: The yield or internal rate of return an investor
would receive at any given moment by investing in municipal bonds.
We should note that the interest on municipal bonds typically is free
from federal government taxes and therefore has a lower yield than
other bonds of similar risk. These yields, however, can vary
substantially depending on their rating, so could be higher or lower than
presented here.
High grade corporate bond yield: The yield or internal rate of return an
investor would receive by purchasing a corporate bond with a rating
above BB.
© 2005 Vault Inc.
3232
Why do interest rates move?
Interest rates react mostly to inflation expectations (expectations of a rise
in prices). If it is believed that inflation will rise, then interest rates rise.
Think of it this way. Say inflation is 5 percent a year. In order to make
money on a loan, a bank would have to at least charge more than 5 percent
– otherwise it would essentially be losing money on the loan. The same is
true with bonds and other fixed income products.
In the late 1970s, interest rates topped 20 percent, as inflation began to
spiral out of control (and the market expected continued high inflation).
Today, many believe that the Federal Reserve has successfully slayed
inflation and has all but eliminated market concerns of future inflation, at
least in the near term. This is certainly debatable, but clearly, the sound
monetary policies and remarkable price stability in the U.S. have made it the
envy of the world.
Vault Career Guide to Investment Banking
Fixed Income Markets
Prime rate: The average rate that U.S. banks charge to companies for
loans.
30-year mortgage rates: The average interest rate on 30-year home
mortgages. Mortgage rates typically move in line with the yield on the
10-year Treasury note
High yield bonds: The yield or internal rate of return an investor would
receive by purchasing a corporate bond with a rating below BBB (also
called junk bonds).
A Note About the Federal Reserve
The Federal Reserve Bank, called the Fed and headed by Alan
Greenspan, monitors the U.S. money supply and regulates banking
institutions. The Fed’s role is crucial to the U.S. economy and stock
market.
Academic studies of economic history have shown that a country’s
inflation rate tends to track that country’s increase in its money supply.
Therefore, if the Fed allows the money supply to increase by 2 percent
this year, inflation can best be predicted to increase by about 2 percent
as well. And because inflation so dramatically impacts the stock and
Visit the Vault Finance Career Channel at www.vault.com/finance – with
insider firm profiles, message boards, the Vault Finance Job Board and more.
33
C A R E E R
L I B R A R Y
Vault Career Guide to Investment Banking
Fixed Income Markets
bond markets, the markets scrutinize the daily activities of the Fed and
hang onto every word uttered by Greenspan.
The Fed can manage consumption patterns and hence the GDP by
raising or lowering interest rates.
The chain of events when the Fed raises rates is as follows:
The Fed raises interest rates. This interest rate increase
triggers banks to raise interest rates, which leads to consumers
and businesses borrowing less and spending less. This
decrease in consumption tends to slow down GDP, thereby
reducing earnings at companies. Since consumers and
businesses borrow less, they have left their money in the bank
and hence the money supply does not expand. Note also that
since companies tend to borrow less when rates go up, they
therefore typically invest less in capital equipment, which
discourages productivity gains and hurts earnings of capital
goods providers. Any economist will tell you that a key to a
growing economy on a per capita basis is improving labor
productivity.
Fixed Income Definitions
The following glossary may be useful for defining securities that trade in
the markets as well as talking about the factors that influence them. Note
that this is just a list of the most common types of fixed income products
and economic indicators. Thousands of fixed income products actually
trade in the markets.
Vault Career Guide to Investment Banking
Fixed Income Markets
© 2005 Vault Inc.
34
Municipal bonds
Bonds issued by local and state governments,
a.k.a. municipalities. Municipal bond income is
tax-free for the investor, which means investors in
“muni’s” earn interest payments without having to
pay federal taxes. Sometimes investors are
exempt from state and local taxes too.
Consequently, municipalities can pay lower
interest rates on muni bonds than other bonds of
similar risk.
Treasury securities
United States government-issued securities.
Categorized as Treasury bills (maturity of up to –
but not including – two years), Treasury notes
(from two years to 10 years maturity), and
Treasury bonds (10 years to 30 years). As they
are government-guaranteed, Treasuries are
considered “risk-free.” In fact, U.S. Treasuries
have no default risk, but do have interest rate risk
– if rates increase, then the price of US
Treasuries issued in the past will decrease.
Agency bonds
Agencies represent all bonds issued by the
federal government and federal agencies, but
excluding those issued by the Treasury (i.e.,
bonds issued by other agencies of the federal
government). Examples of agencies that issue
bonds include Federal National Mortgage
Association (FNMA) and Guaranteed National
Mortgage Association (GNMA).
Investment grade
corporate bonds
Bonds with a Standard & Poor’s rating of at least
a BBB Typically big, blue-chip companies issue
highly rated bonds.
High yield (junk)
bonds
Bonds with a Standard & Poor’s rating lower than
BBB Typically smaller, riskier companies issue
high yield bonds.
Types of Securities
Vault Career Guide to Investment Banking
Fixed Income Markets
Visit the Vault Finance Career Channel at www.vault.com/finance — with
insider firm profiles, message boards, the Vault Finance Job Board and more.
35
C A R E E R
L I B R A R Y
Money market
securities
The market for securities (typically corporate, but also
Treasury securities) maturing within one year, including
short-term CDs, Repurchase Agreements, and
Commercial Paper (low-risk corporate issues), among
others. These are low-risk, short-term securities that
have yields similar to Treasuries.
Gross Domestic
Product
GDP measures the total domestic output of goods and
services in the United States. Generally, when the
GDP grows at a rate of less than 2%, the economy is
considered to be in an economic slowdown; negative
growth, or shrinkage, indicates recession.
Consumer Price
Index
The CPI measures the percentage increase in the price
for goods and services. Essentially, the CPI measures
inflation affecting consumers.
Producer Price
Index
The PPI measures the percentage increase in the price
of a standard basket of goods and services. PPI is a
measure of inflation for producers and manufacturers.
Unemployment
Rate and Wages
In 1999 through early 2000, U.S. unemployment was at
record lows. Clearly, this was a positive sign for the
U.S. economy because jobs are plentiful. The markets
sometimes react negatively to extremely low levels of
unemployment, since, as a tight labor market means
that firms may have to raise wages (called wage
pressure). Substantial wage pressure may force firms
to raise prices, and hence may cause inflation to flare
up. Marked increases in unemployment are seen as a
sign of economic weakness, and can be a symptom of
a slowdown or recession.
Mortgage-backed
bonds
Bonds collateralized by a pool of mortgages. Interest
and principal payments are based on the individual
homeowners making their mortgage payments. The
more diverse the pool of mortgages backing the bond,
the less risky they are typically considered.
Economic Indicators
NYU Law | Stern MBA | Harvard | Williams | Northwester
- Kellogg | Amherst | Princeton | Swarthmore | Yale
Pomona College | Wellesley | Carleton | Harvard Busines
School | MIT | Duke | Stanford | Columbia Law | Penn
CalTech | Middlebury | Harvard Law | Wharton | Davidso
Washington University St. Louis | Dartmouth | Yale Law
Haverford | Bowdoin | Columbia | Boalt School of Law
Wesleyan | Chicago GSB | Northwestern | Claremon
McKenna | Washington and Lee | Georgetown Law
University of Chicago | Darden MBA | Cornell | Vassar
Grinnell | Johns Hopkins | Rice | Berkeley - Haas | Smith
Brown | Bryn Mawr | Colgate | Duke Law | Emory | Notr
Dame | Cardozo Law | Vanderbilt | University of Virginia
Hamilton | UC Berkeley | UCLA Law | Trinity | Bates
Carnegie Mellon | UCLA Anderson | Stanford GSB
Northwestern Law | Tufts | Morehouse | University o
Michigan | Stanford Law | Thunderbird | Emory | Boal
Hall | Pitt | UT Austin | USC | Indiana Law | Penn State
BYU | U Chicago Law | Boston College | Purdue MBA
Wisconsin-Madison | Tulane | Duke - Fuqua | UNC Chape
Hill | Wake Forest | Penn | CalTech | NYU Law | Ster
MBA | Harvard | Williams | Northwestern - Kellogg
Amherst | Princeton | Swarthmore | Yale | Pomon
College | Wellesley | Carleton | Harvard Business School
MIT | Duke | Stanford | Columbia Law | Penn | CalTech
Middlebury | Harvard Law | Wharton | Davidson
Washington University St. Louis | Dartmouth | Yale Law
Haverford | Bowdoin | Columbia | Boalt School of Law
Wesleyan | Chicago GSB | Northwestern | Claremon
McKenna | Washington and Lee | Georgetown Law
University of Chicago | Darden MBA | Cornell | Vassar
Grinnell | Johns Hopkins | Rice | Berkeley - Haas | Smith
Brown | Bryn Mawr | Colgate | Duke Law | Emory | Notr
Dame | Cardozo Law | Vanderbilt | University of Virginia
Hamilton | UC Berkeley | UCLA Law | Trinity | Bates
Carnegie Mellon | UCLA Anderson | Stanford GSB
Northwestern Law | Tufts | Morehouse | University o
Michigan | Stanford Law | Thunderbird | Emory | Boal
Hall | Pitt | UT Austin | USC | Indiana Law | Penn State
BYU | U Chicago Law | Boston College | Purdue MBA
Get the BUZZ on
Top Schools
Read what STUDENTS and ALUMNI
have to say about:
• Admissions
• Academics
• Career Opportunities
• Quality of Life
• Social Life
Surveys on thousands of top programs
College • MBA • Law School • Grad School
Go to www.vault.com