SAS/ETS 9.22 User''''s Guide 270 pptx
Bạn đang xem bản rút gọn của tài liệu. Xem và tải ngay bản đầy đủ của tài liệu tại đây (782.97 KB, 10 trang )
2682 ✦ Chapter 41: Specifying Forecasting Models
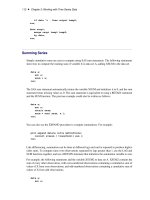
Figure 41.1 Automobile Sales Series
Select “Diagnose Series” from the Tools menu. You can do this from the Develop Models window or
from the Time Series Viewer window. Figure 41.2 shows this from the Develop Models window.
Series Diagnostics ✦ 2683
Figure 41.2 Selecting Series Diagnostics
This opens the Series Diagnostics window, as shown in Figure 41.3.
2684 ✦ Chapter 41: Specifying Forecasting Models
Figure 41.3 Series Diagnostics Window
Each of the three series characteristics—need for log transformation, presence of a trend, and
seasonality—has a set of options for
Yes, No,
and
Maybe. Yes
indicates that the series has the
characteristic and that forecasting models fit to the series should be able to model and predict this
behavior.
No
indicates that you do not need to consider forecasting models designed to predict series
with this characteristic.
Maybe
indicates that models with and without the characteristic should be
considered. Initially, all these values are set to Maybe.
To have the system diagnose the series characteristics, select the Automatic Series Diagnostics button.
This runs the diagnostic routines described in Chapter 46, “Forecasting Process Details,” and sets the
options according to the results. In this example,
Trend
and
Seasonality
are changed from
Maybe
to Yes, while Log Transform remains set to Maybe.
These diagnostic criteria affect the models displayed when you use the Models to Fit window or
the Automatic Model Selection model-fitting options described in the following section. You can
set the criteria manually, according to your judgment, by selecting any of the options, whether you
have used the Automatic Series Diagnostics button or not. For this exercise, leave them as set by the
automatic diagnostics. Select the OK button to close the Series Diagnostics window.
Models to Fit Window ✦ 2685
Models to Fit Window
As you saw in the previous chapter, you can select models from a list. Invoke the Models to Fit
window by clicking the middle of the table and selecting “Fit Models from List” from the menu.
This can also be selected from the tool bar or the Fit Model submenu of the Edit menu. The Models
to Fit window comes up, as shown in Figure 41.4.
Figure 41.4 Models to Fit Window
Since you have performed series diagnostics, the models shown are the subset that fits the diagnostic
criteria.
Suppose you want to consider models other than those in this subset because you are undecided about
including a trend in the model. Select the Show all models option. Now the entire model selection
list is shown. Scroll through the list until you find
Log Seasonal Exponential Smoothing
, as
shown in Figure 41.5.
2686 ✦ Chapter 41: Specifying Forecasting Models
Figure 41.5 Selecting a Model from List
This is a nontrended model, which seems a good candidate. Select this model, and then select the
OK button. The model is fit to the series and then appears in the table with the value of the selected
fit criterion, as shown in Figure 41.6.
Automatic Model Selection ✦ 2687
Figure 41.6 Develop Models Window Showing Model Fit
You can edit the model list that appears in the Models to Fit window by selecting “Options” and
“Model Selection List” from the menu bar or by selecting the Edit Model List toolbar icon. You can
then delete models you are not interested in from the default list and add models using any of the
model specification methods described in this chapter. When you save your project, the edited model
selection list is saved in the project file. In this way, you can use the Select from List item and the
Automatic Model Selection item to select models from a customized search set.
Automatic Model Selection
Automatic model selection is equivalent to choosing Select from List, as you did in the preceding
section, fitting all the models in the subset list and then deleting all except the best fitting of the
models. If series diagnostics have not yet been done, they are performed automatically to determine
the model subset to fit. If you set the series diagnostics for log, trend, or seasonal criteria manually
using the radio buttons, these choices are honored by the automatic fitting process.
2688 ✦ Chapter 41: Specifying Forecasting Models
Using automatic selection, the system does not pause to warn you of model fitting errors, such as
failure of the estimates to converge (you can track these using the audit trail feature).
By default, only the best fitting model is kept. However, you can control the number of automatically
fit models retained in the Develop Models list, and the following example shows how to do this.
From the menu bar, choose “Options” and “Automatic Fit.” This opens the Automatic Model
Selection Options window. Click the
Models to Keep
list arrow, and select “All models”, as shown
in Figure 41.7. Now select OK.
Figure 41.7 Selecting Number of Automatic Fit Models to Keep
Next, select “Fit Models Automatically” by clicking the middle of the table or using the toolbar
or Edit menu. The Automatic Model Selection window appears, showing the diagnostic criteria in
effect and the number of models to be fit, as shown in Figure 41.8.
Automatic Model Selection ✦ 2689
Figure 41.8 Automatic Model Selection Window
Select the OK button. After the models have been fit, all of them appear in the table, in addition to
the model which you fit earlier, as shown in Figure 41.9.
2690 ✦ Chapter 41: Specifying Forecasting Models
Figure 41.9 Automatically Fit Models
Smoothing Model Specification Window
To fit exponential smoothing and Winters models not already provided in the Models to Fit window,
select “Fit Smoothing Model” from the pop-up menu or toolbar or select “Smoothing Model” from
the Fit Model submenu of the Edit menu. This opens the Smoothing Model Specification window, as
shown in Figure 41.10.
Smoothing Model Specification Window ✦ 2691
Figure 41.10 Smoothing Model Specification Window
The Smoothing Model Specification window consists of several parts. At the top is the series name
and a field for the label of the model you are specifying. The model label is filled in with an
automatically generated label as you specify options. You can type over the automatic label with
your own label for the model. To restore the automatic label, enter a blank label.
The
Smoothing Methods
box lists the different methods available. Below the
Smoothing
Methods
box is the Transformation field, which is used to apply the smoothing method to transformed
series values.
The
Smoothing Weights
box specifies how the smoothing weights are determined. By default, the
smoothing weights are automatically set to optimize the fit of the model to the data. See Chapter 46,
“Forecasting Process Details,” for more information about how the smoothing weights are fit.
Under smoothing methods, select “Winters Method – Additive.” Notice the smoothing weights
box to the right. The third item,
Damping
, is grayed out, while the other items,
Level
,
Trend
, and
Season
, show the word
Optimize
. This tells you that these three smoothing weights are applicable
to the smoothing method that you selected and that the system is currently set to optimize these
weights for you.
Next, specify a transformation using the
Transformation
list. A menu of transformation choices
pops up, as shown in Figure 41.11.