Agile Processes in Software Engineering and Extreme Programming- P4 potx
Bạn đang xem bản rút gọn của tài liệu. Xem và tải ngay bản đầy đủ của tài liệu tại đây (3.2 MB, 30 trang )
78 E. Damiani et al.
organizations to specify the goals for their projects, and traces these goals to the
data that are intended to define these goals operationally, providing a framework
to interpret the data and understand the goals.
Specifically, our measurement meta-model is defined as a skeletal generic
framework exploitable to get measures from any development process.
The InformationNeed node is the container node that identifies the informa-
tion need over which all the measuring actions are based, as for instance an
internal process assessment. This node is used as a conceptual link between the
two meta-models.
Following the GQM paradigm, the measurableConcept class defines the areas
over which the analysis is based; examples of measurableConcept data instances
could be “Software Reuse” or “Software Quality”, indicating as goals an assess-
ment of software reuse and software quality level within the organization.
The measurableAttributes node defines which attributes have to be measured
in order to accomplish the analysis goals. Furthermore, this element specifies
the way how attribute values could be collected: indeed, there a strict relation
between workProduct and measurableAttribute classes.
The measure class defines the structure of measurement values observed dur-
ing a measurement campaign. Measure is strictly related to unit and scaleType
classes, that define, respectively, the unit of measurement used and the type
of scale adopted (nominal, ordinal, and so forth). In particular, measure is in
relation with the metric class, that defines conditioning and pre-processing of
measurements in order to provide meaningful indicators. Finally, the metric class
is in relation with the t hreshold node that specifies the threshold values for each
metric when needed for qualitative evaluation.
3.3 Trigger Meta-Model
The trigger meta-model defines a skeletal middle layer that connects develop-
ment process and measurement framework meta-models, factoring out entities
that model application of measures to attributes. Fig. 3 shows the trigger meta-
model and its relation with the other two meta-models.
The trigger meta-model is composed of two entities: trigger and triggerData.
Trigger is the class that represents a specific question, component, or probe
that evaluates a specific attribute in a given moment of the development process.
Indeed, trigger is related to the measurableAttribute class in order to specify
which attributes are to be measured, and with organization, project, phase,and
activity classes to indicate the organizational coordinates where attributes have
to be measured.
Finally, the triggerData class identifies a single result of a measurement ac-
tion performed by a trigger instance. There is a slight but important difference
between data represented by triggerData and raw measures: measure instances
supply triggerData values to metrics applying, whenever necessary, suitable ag-
gregations to reduce the cardinality of triggerData result set.
A Metamodel for Modeling and Measuring Scrum Development Process 79
Fig. 3. Trigger Meta-model
4 Scrum Model
In this section we use our software process meta-model to model an agile process
and couple it with measurement framework. As a proof-of-concept, we shall focus
on the Scrum development process [2,4]. A major difference between traditional
development processes and empirical ones like Scrum is that analysis, design, and
development activities during a Scrum process are intrinsically unpredictable;
however, a distributed control mechanism is used to manage unpredictability
and to guarantee flexibility, responsiveness, and reliability of the results. At first
sight, it may seem that Scrum’s unpredictability could make it difficult to use a
measurement framework to assess a Scrum process. However, we shall see that
our meta-model seamlessly superimposes a measurement framework to Scrum
activities.
4.1 The Scrum Development Process
In the following sections we propose an instance of our development process
meta-model based on Scrum, defining phases, activities, and workproducts of
it. Our description of Scrum is based on the work of Schwaber [11] that clearly
defines Scrum phases and workproducts and gives guidelines for defining its
activities.
Phases and Activities. The Scrum process is composed by the following five
phases (see Fig. 4):
1. Planning, whose main tasks are the preparation of a comprehensive Backlog
list (see Section 4.1), the definition of delivering dates, the assessment of the
risk, the definition of project teams, and the estimation of the costs. For this
phase, none activity has been formalized; to maintain coherence with the
proposed meta-model, we define a generic planningActivity.
80 E. Damiani et al.
Fig. 4. Scrum model
2. Ar chitecture, that includes the designing of the structure of Backlog items
and the definition and design of the system structure; also for this phase we
have instanced a generic architectureActivity.
3. Sprint, that is a set of development activities conducted over a predefined
period, in the course of the risk is assessed continuously and adequate risk
controls and responses put in place. Each Sprint phase consists of one or
more teams performing the following activities:
A Metamodel for Modeling and Measuring Scrum Development Process 81
– Develop: that defines all the development actions needed to implement
Backlog requirements into packets, performing changes, adding new fea-
tures or fixings old bugs, and documenting the changes;
– Wrap: that consists in closing the modified packets and creating an ex-
ecutable version of them showing the implementation of requirements;
– Review: that includes a review of the release by team members, which
raise and resolve issues and problems, and add new Backlog items to the
Backlog list;
– Adjust: that permits to consolidate in modified packets all the informa-
tion gathered during Sprint meetings.
4. Sprint Review, that follows each Sprint phase, whereby it is defined an iter-
ation within the Scrum process. Recent literature [11] identified a series of
activities also for the Sprint Review phase:
– Software Reviewing: the whole team, product management and, possibly,
customers jointly review the executable provided by the developers team
and occurred changes;
– Backlog Comparing: the implementation of Backlog requirements in the
product is verified;
– Backlog Editing: the review activities described above yield to the for-
malization of new Backlog items that are inserted into the Backlog list;
– Backlog Items Assigning: new Backlog items are assigned to developers
teams, changing the content and direction of deliverables;
– Next Review Planning: the time of the next review is defined based on
the progress and the complexity of the work.
5. Closur e, that occurs when the expected requirements have been implemented
or the project manager “feels” that the product can be released. For this
phase, a generic closureActivity has been provided.
Workproducts. A typical Scrum work product is the Backlog, a prioritized list
of Backlog Items [3] that defines the requirements that drive further work to be
performed on a product. The Backlog is a dynamic entity, constantly changed
by management, and evolves as the product and its environment change. The
Backlog is accessed during all activities of process and modified only in during
Review and Backlog Editing.
Backlog Items define the structure and the changes to apply to the software.
We identified as instances of our workproduct class the entities Release com-
posed by a set of Packet that includes all the software components implemented.
Fig. 5 shows an excerpt of the Scrum model showing relation with our activity
and workproduct instances. It is important to note that each workproduct in-
stance is characterized by a list of measured attributes that are themselfes in-
stances of the measurableAttribute class of our measurement meta-model. During
the configuration of the data representation and storage environment, it is neces-
sary to point out which attributes to measure and which workproducts consider
in measuring these attributes.
82 E. Damiani et al.
Fig. 5. Relations with workproducts and activities
BACKLOGITEM(id, name, description, priority, category, version, state,
estimatedEffort)
BG-DEV(backlogItemID, developID)
DEVELOP(id, startDate, finishDate, sprintID)
SPRINT(id, startDate, finishDate)
PROJECT(id, name, description, startDate, finishDate)
Fig. 6. A database schema for Scrum data complying with our data model. The table
BG-DEV implements the many-to-many relation between the BACKLOGITEM and
DEVELOP tables.
5Conclusion
In this paper we have laid the basis for a framework to model a generic software
process meta-model and related measures, and we propose an instance of the
meta-model modeling the agile process Scrum, showing how the assessment of
such a process is possible without deranging the approach at the basis of this
methodology. It is important to remark that the data model we generated for
Scrum supports creating and maintaining Scrum process data, e.g. using a rela-
tional database. A sample set of tables complying to the model are shown in Fig. 6.
Having been generated from our standard meta-model, the Scrum model can
be easily connected to similar models generated for different agile processes
like XP, supporting enterprise-wide measurement campaigns in organizations
that adopt multiple agile methodologies. We shall explore this issue in a future
paper.
A Metamodel for Modeling and Measuring Scrum Development Process 83
Acknowledgments
This work was partly founded by the Italian Ministry of Research under FIRB
contracts n. RBNE05FKZ2
004 TEKNE and n. RBNE01JRK8 003 MAPS.
References
1. Basili, V.R.: Software Modeling and Measurement: The Goal Question Metric
Paradigm. Computer Science Technical Report Series, CS-TR-2956 (UMIACS-TR-
92-96), University of Maryland, College Park, MD (1992)
2. Beedle, M., Schwaber, K.: Agile Software Development with SCRUM. Prentice
Hall, Englewood Cliffs (2001)
3. Beedle, M., Devos, M., Sharon, Y., Schwaber, K., Sutherland, J.: SCRUM: An
Extension Pattern Language for Hyperproductive Software Development. In: Har-
rison, N., Foote, B., Rohnert, H. (eds.) Pattern Languages of Program Design 4,
pp. 637–651. Addison-Wesley, Reading, MA (2000)
4. Cockburn, A.: Agile Software Development. Addison-Wesley, London, UK (2001)
5. Colombo, A., Damiani, E., and Frati, F.: Processo di Sviluppo Software e Metriche
Correlate: Metamodello dei Dati e Architettura di Analisi. Nota del Polo - Ricerca
n. 101, Italy (available in italian only) (February 2007)
6. Florac, W.A., Carleton, A.D.: Measuring the Software Process: statistical process
control for software process improvement. Addison-Wesley Professional, Boston,
USA (1999)
7. Mi, P., Scacchi, W.: A Meta-Model for Formulating Knowledge-Based Models of
Software Development. Special issue: Decision Support Systems 17(4), 313–330
(1996)
8. OMG Meta Object Facility (MOF) Home Page (2006) www.omg.org/mof/
9. Ru´ız, F., Vizca´ıno, A., Garc´ıa, F., Piattini, M.: Using XMI and MOF for Repre-
sentation and Interchange of Software Processes. In: Proc. of 14th International
Workshop on Database and Expert Systems Applications (DEXA’03), Prague,
Czech Republic (2003)
10. Scacchi, W., Noll, J.: Process-Driven Intranets: Life-Cycle Support for Process
Reengineering. IEEE Internet Computing 1(5), 42–49 (1997)
11. Schwaber, K.: SCRUM Development Process. In: Proc. of OOPSLA’95 Workshop
on Business Object Design and Implementation, Austin, TX (1995)
12. SPEM Software Process Engineering Metamodel (2006)
www.omg.org/technology/documents/formal/spem.htm
13. P. Ventura Martins, A.R. da Silva.: PIT-P2M: ProjectIT Process and Project Meta-
model. In: Proc. of OTM Workshops, Cyprus, pp. 516–525 (October 31-November
4, 2005)
Tracking the Evolution of Object-Oriented
Quality Metrics on Agile Projects
Danilo Sato, Alfredo Goldman, and Fabio Kon
Department of Computer Science
University of S˜ao Paulo, Brazil
{dtsato,gold,kon}@ime.usp.br
Abstract. The automated collection of source code metrics can help ag-
ile teams to understand the software they are producing, allowing them
to adapt their daily practices towards an environment of continuous im-
provement. This paper describes the evolution of some object-oriented
metrics in several agile projects we conducted recently in both academic
and governmental environments. We analyze seven different projects,
some where agile methods were used since the beginning and others
where some agile practices were introduced later. We analyze and com-
pare the evolution of such metrics in these projects and evaluate how the
different project context factors have impacted the source code.
Keywords: Agile Methods, Extreme Programming, Object-Oriented
Metrics, Tracking.
1 Introduction
In recent years, the adoption of agile methods, such as Extreme Programming
(XP) [4], in the industry has increased. The approach proposed by agile methods
is based on a set of principles and practices that value the interactions among
people collaborating to deliver high-quality software that creates business value
on a frequent basis [5]. Many metrics have been proposed to evaluate the qual-
ity of object-oriented (OO) systems, claiming that they can aid developers in
understanding design complexity, in detecting design flaws, and in predicting
certain quality outcomes such as software defects, testing, and maintenance ef-
fort [8,11,14]. Many empirical studies evaluated those metrics in projects from
different contexts [3,6,7,10,13,17,18] but there are a few in agile projects [1,2].
This paper describes the evolution of OO metrics in seven agile projects. Our
goal is to analyze and compare the evolution of such metrics in those projects
and evaluate how the different project context factors have impacted the source
code.
The remainder of this paper is organized as follows. Section 2 describes the
projects and their adoption of agile practices. Section 3 presents the techniques
we used to collect data and the OO metrics chosen to be analyzed. Section 4
analyzes and discusses the evolution of such metrics. Finally, we conclude in
Sect. 5 providing guidelines for future work.
G. Concas et al. (Eds.): XP 2007, LNCS 4536, pp. 84–92, 2007.
c
Springer-Verlag Berlin Heidelberg 2007
Tracking the Evolution of Object-Oriented Quality Metrics on Agile Projects 85
2Projects
This paper analyzes five academic projects conducted in a full-semester course
on XP and two governmental projects conducted at the S˜ao Paulo State Leg-
islative Body (ALESP). Factors such as schedule, personnel experience, culture,
domain knowledge, and technical skills may differ between academic and real-
life projects. These and other factors were discussed more deeply in a recent
study [16] that classified the projects in terms of the Extreme Programming
Evaluation Framework [20]. This section will briefly describe each project, high-
lighting the relevant differences to this study as well as the different approaches
of adopting agile methods.
2.1 Academic Projects
We have been offering an XP course at the University of S˜ao Paulo since 2001 [9].
The schedule of the course demanded 6 to 8 hours of weekly work per student, on
average. All academic projects, except for projects 3 and 5, have started during
the XP class, in the first semester of 2006. The semester represents a release
and the projects were developed in 2 to 4 iterations. We recommended 1 month
iterations but the exact duration varied due to the team experience with the
technologies, holidays, and the amount of learning required by projects with a
legacy code base.
–Project1(Archimedes): An open source computer-aided design (CAD)
software focused on the needs of professional architects. We analyze the
initial 4 iterations.
–Project2(Grid Video Converter): A Web-based application that leverages
the processing power of a computational grid to convert video files among
several video encodings, qualities, and formats. We analyze the initial 3 it-
erations.
–Project3(Colm´eia): A library management system that has been devel-
oped during the last four offerings of the XP class. Here, we analyze 2 itera-
tions of the project. Other system modules were already deployed. Hence, the
team had to spend some time studying the existing system before starting
to develop the new module.
–Project4(Gin´astica Laboral ): A stand-alone application to assist in the
recovery and prevention of Repetitive Strain Injury (RSI), by frequently
alerting the user to take breaks and perform some pre-configured routines of
exercises. We analyze the initial 3 iterations.
–Project5(Borboleta): A mobile client-server system for hand-held devices
to assist in medical appointments provided at the patients’ home. The project
started in 2005 with three undergraduate students and new features were
implemented during the first semester of 2006. We analyze 3 iterations during
the second development phase in the XP class.
86 D. Sato, A. Goldman, and F. Kon
2.2 Governmental Projects
The governmental schedule demanded 30 hours of weekly work per employee. In
addition, some members of our team were working in the projects with partial-
time availability.
–Project6(Chinchilla): A human resources system to manage information
of all ALESP employees. This project started with initial support from our
team, by providing training and being responsible for the coach and tracker
roles. After some iterations, we started to hand over these roles to the ALESP
team and provided support through partial-time interns from our team. We
analyze the initial 8 iterations, developed from October/2005 to May/2006.
–Project7(SPL): A work-flow system to manage documents (bills, acts,
laws, amendments, etc.) through the legislative process. The initial develop-
ment of this system was outsourced and deployed after 2 years, when the
ALESP employees were trained and took over its maintenance. Due to the
lack of experience on the system’s technologies and to the large number of
production defects, they were struggling to provide support for end-users, to
fix defects, and to implement new features. When we were called to assist
them, we introduced some of the primary XP practices, such as Continuous
Integration, Testing (automated unit and acceptance tests), and Informa-
tive Workspace [4]. We analyze 3 iterations after the introduction of these
practices, from March/2006 to June/2006.
2.3 XP Radar Chart
To evaluate the level of adoption of the various agile practices, we conducted an
adapted version of Kreb’s survey [12]. We included questions about the adoption
of tracking, the team education, and level of experience
1
. The detailed results
of the survey were presented and analyzed in a recent study [16]. However, it is
important to describe the different aspects of agile adoption in each project. To
evaluate that, we chose Wake’s XP Radar Chart [19] as a good visual indicator.
Table 1 shows the XP radar chart for all projects. The value of each axis repre-
sents the average of the corresponding practices, retrieved from the survey and
rounded to the nearest integer to improve readability. Some practices overlap
multiple chart axis.
3 Metrics and Method
Chidamber and Kemerer proposed a suite of OO metrics, known as the CK
suite [8], that has been widely validated in the literature [3,6]. Our metrics were
collected by the Eclipse Metrics plug-in
2
. We chose to analyze a subset of the
available metrics collected by the plug-in, comprising four of six metrics from
1
Survey available at />2
Tracking the Evolution of Object-Oriented Quality Metrics on Agile Projects 87
Table 1. XP Radar Chart (some practices overlap multiple axis)
Radar Axis XP Practices
Programming Testing, Refactoring, and Simple
Design
Planning Small Releases, Planning Game,
Sustainable Pace, Lessons
Learned, and Tracking
Customer Testing, Planning Game, and On-
site Customer
Pair Pair Programming, Continuous
Integration, and Collective Code
Ownership
Team Continuous Integration, Testing,
Coding Standards, Metaphor,
and Lessons Learned
the CK suite (WMC, LCOM, DIT, and NOC) and two from Martin’s suite [14]
(AC and EC). We were also interested in controlling for size, so we analyzed
LOC and v(G).
The files were checked out from the code repository, retrieving the revisions
at the end of each iteration. The plug-in exported an XML file with raw data
about each metric that was post-processed by a Ruby script to filter production
data (ignoring test code) and generate the final statistics for each metric.
–LinesofCode(LOC ): the total number of non-blank, non-comment lines
of source code in a class of the system. Scope: class.
– McCabe’s Cyclomatic Complexity (v(G)): measures the amount of de-
cision logic in a single software module. It is defined for a module (class
method) as e − n +2,where e and n are the number of edges and nodes in
the module’s control flow graph [15]. Scope: method.
– Weighted Methods per Class (WMC): measures the complexity of classes.
It is defined as the weighted sum of all class’ methods [8]. We are using v(G)
as the weighting factor, so WMC can be calculated as
c
i
,wherec
i
is the
Cyclomatic Complexity of the class’ i
th
method. Scope: class.
–LackofCohesionofMethods(LCOM ): measures the cohesiveness of
a class and is calculated using the Henderson-Sellers method [11]. If m(F )
is the number of methods accessing a field F ,LCOMiscalculatedasthe
average of m(F ) for all fields, subtracting the number of methods m and
dividing the result by (1 − m). A low value indicates a cohesive class and a
value close to 1 indicates a lack of cohesion. Scope: class.
– Depth of Inheritance Tree (DIT ): the length of the longest path from a
given class to the root class (ignoring the base Object class in Java) in the
hierarchy. Scope: class.
– Number of Children (NOC): the total number of immediate child classes
inherited by a given class. Scope: class.
88 D. Sato, A. Goldman, and F. Kon
– Afferent Coupling (AC ): the total number of classes outside a package
that depend on classes inside the package. When calculated at the class
level, this metric is also known as the Fan-in of a class. Scope: package.
– Efferent Coupling (EC ): the total number of classes inside a package that
depend on classes outside the package. When calculated at the class level,
this metric is also known as the Fan-out of a class, or as the CBO (Coupling
Between Objects) metric in the CK suite. Scope: package.
4 Results and Discussion
4.1 Size and Complexity Metrics: LOC, v(G), and WMC
The mean value of LOC, v(G), and WMC for each iteration were plotted in
Fig. 1(a), Fig. 1(b), and Fig. 1(c) respectively. The shapes of these 3 graphs
display a similar evolution. In fact, the value of Spearman’s rank correlation
between these metrics (Table 2) shows that these metrics are highly dependent.
Several studies found that classes with higher LOC and WMC are more prone
to faults [3,10,17,18].
Project 7 had a significantly higher average LOC, v(G), and WMC than the
other projects. This was the project where just some agile practices were adopted.
20
40
60
80
100
120
140
160
180
200
1 2 3 4 5 6 7 8
Average Class Size
Iteration
Project 1
Project 2
Project 3
Project 4
Project 5
Project 6
Project 7
(a) LOC
1
1.5
2
2.5
3
3.5
4
1 2 3 4 5 6 7 8
Average Cyclomatic Complexity
Iteration
Project 1
Project 2
Project 3
Project 4
Project 5
Project 6
Project 7
(b) v(G)
5
10
15
20
25
30
35
40
45
50
1 2 3 4 5 6 7 8
Average WMC
Iteration
Project 1
Project 2
Project 3
Project 4
Project 5
Project 6
Project 7
(c) WMC
0
0.2
0.4
0.6
0.8
1
1 2 3 4 5 6 7 8
Average LCOM
Iteration
Project 1
Project 2
Project 3
Project 4
Project 5
Project 6
Project 7
(d) LCOM
Fig. 1. Evolution of mean values for LOC, v(G), WMC, and LCOM
Tracking the Evolution of Object-Oriented Quality Metrics on Agile Projects 89
Table 2. Spearman’s Rank Correlation test results
Metrics Correlation (ρ) p-value
LOC vs. v(G) 0.861 < 0.000001
LOC vs. WMC 0.936 < 0.000001
v(G)vs.WMC 0.774 < 0.00001
In fact, it had the most defective XP implementation, depicted in Tab. 1. This
suggests that Project 7 will be more prone to errors and will require more testing
and maintenance effort. By comparing Project 7 with data from the literature,
we found that projects with similar mean LOC (183.27 [10] and 135.95 [17])
have a significantly lower WMC (17.36 [10] and 12.15 [17]). Other studies show
similar WMC values, but without controlling for size: 13.40 [3], 11.85, 6.81, and
10.37 [18]. These values of WMC are more consistent with the other six agile
projects, although our projects have smaller classes (lower LOC).
We can also notice a growing trend through the iterations. This tendency is more
accentuated in the initial iterations of green field projects (such as Project 1), sup-
porting the results from Alshayeb and Li [1]. After some iterations the growing rate
seems to stabilize. The only exception was Project 5, showing a decrease in size
and complexity. This can be explained by the lack of focus on testing and refac-
toring during the first development phase. The team was not skillful on writing
automated tests in J2ME before the XP class. This suggests that testing and refac-
toring are good practices for controlling size and complexity and these metrics are
good indicators to be tracked by the team.
4.2 Cohesion Metric: LCOM
The mean value of LCOM for each iteration was plotted in Fig. 1(d), however
we could not draw any interesting result from this metric, due to the similar
values between all projects. In fact, the relationship between this metric and the
source code quality is controversial: while Basili et al. has shown that LCOM
was insignificant [3], Gyim´othy et al. found it to be significant [10].
4.3 Inheritance Metrics: DIT and NOC
The mean value of DIT and NOC for each iteration were plotted in Fig. 2(a) and
Fig. 2(b) respectively. The use of these metrics as predictors for fault-proness
of classes is also controversial in the literature [7,10]. Table 3 shows the average
DIT and NOC from several studies for comparison.
None of our projects show high values for DIT or NOC, showing that the use
of inheritance was not abused. Mean values of DIT around 1.0 can be explained
by the use of frameworks such as Struts and Swing, that provide functionality
through extension of their base classes. In particular, a large part of the code base
from Project 5 was a mobile application, and some of its base classes inherited
directly from the J2ME UI classes, resulting in a higher value of DIT. NOC was
usually lower for green field projects, and a growing trend can be observed in
90 D. Sato, A. Goldman, and F. Kon
0
0.5
1
1.5
2
1 2 3 4 5 6 7 8
Average DIT
Iteration
Project 1
Project 2
Project 3
Project 4
Project 5
Project 6
Project 7
(a) DIT
0
0.1
0.2
0.3
0.4
0.5
0.6
1 2 3 4 5 6 7 8
Average NOC
Iteration
Project 1
Project 2
Project 3
Project 4
Project 5
Project 6
Project 7
(b) NOC
Fig. 2. Evolution of mean values for DIT and NOC
Table 3. DIT and NOC mean values on the literature
Metric [3] [10] [18] A [18] B [18] C [17] [7]
DIT 1.32 3.13 1.25 1.54 0.89 1.02 0.44
NOC 0.23 0.92 0.20 0.70 0.24 N/A 0.31
most of the projects. This can be explained by the fact that a large part of the
evolution of a system involves extending and adapting existing behavior.
4.4 Coupling Metrics: AC and EC
The mean value of AC and EC for each iteration were plotted in Fig. 3(a) and
Fig. 3(b) respectively. The shapes of these 2 graphs display a similar evolution.
In fact, there is a high dependency between these metrics. Spearman’s rank
correlation of 0.971 was determined with statistical significance at a 95% con-
fidence level (p-value < 10
−14
). Unfortunately, we can not compare our results
with other studies because we used different coupling metrics at a different scope
0
10
20
30
40
50
60
1 2 3 4 5 6 7 8
Average AC
Iteration
Project 1
Project 2
Project 3
Project 4
Project 5
Project 6
Project 7
(a) AC
0
5
10
15
20
25
1 2 3 4 5 6 7 8
Average EC
Iteration
Project 1
Project 2
Project 3
Project 4
Project 5
Project 6
Project 7
(b) EC
Fig. 3. Evolution of mean values for AC and EC
Tracking the Evolution of Object-Oriented Quality Metrics on Agile Projects 91
level (package). The most usual metric in the literature is CBO, which is similar
to EC but calculated at the class level.
Project 7 have again a higher average AC and EC than the other projects.
Binkley and Schach found that coupling measures are good predictors for main-
tenance effort [6]. In this case, due to the outsourced development, the team
was already struggling with maintenance. There were also no automated tests to
act as a safety net for changing the source code. We had some improvements in
the adoption of Continuous Integration [16] by automating the build and deploy
process, but the adoption of automated testing was not very successful. Writing
unit tests for a large legacy code project is much harder and requires technical
skills. However, we had some success on the adoption of automated acceptance
tests with Selenium
3
and Selenium IDE
3
.
5 Conclusions
In this paper, we analyzed the evolution of eight OO metrics in seven projects
with different adoption approaches of agile methods. By comparing our results
with others in the literature, we found that the project with less agile practices
in place (Project 7) presented higher size, complexity, and coupling measures
(LOC, v(G), WMC, AC, and EC), suggesting that it would be more prone to
defects and would require more testing and maintenance efforts. We also found
that there is a high correlation between size and complexity metrics (LOC, v(G)
and WMC) and coupling metrics (AC and EC). We think that the automated
collection of these metrics can support the tracker of an agile team, acting as
good indicators of source code quality attributes, such as size (LOC), complexity
(WMC), and coupling (AC and EC). In our study we found that these curves are
smooth, and changes to the curves can indicate the progress, or lack of progress,
on practices such as testing and refactoring.
In future work, we plan to gather more data from different agile projects. We
are interested in measuring defects and bugs after deployment to analyze their
relationship with the collected metrics. We are also interested in studying similar
projects, adopting agile and non-agile methods, to understand the impact of the
development process on the evolution of the OO metrics.
References
1. Alshayeb, M., Li, W.: An empirical validation of object-oriented metrics in two
different iterative software processes. IEEE Transactions on Software Engineer-
ing 29(11), 1043–1049 (2003)
2. Ambu, W., Concas, G., Marchesi, M., Pinna, S.: Studying the evolution of quality
metrics in an agile/distributed project. In: 7th International Conference on Ex-
treme Programming and Agile Processes in Software Engineering (XP ’06), pp.
85–93 (2006)
3
and />92 D. Sato, A. Goldman, and F. Kon
3. Victor, R., Basili, L.C., Briand, W.L.: A validation of object-oriented design metrics
as quality indicators. IEEE Transactions on Software Engineering 22(10), 751–761
(1996)
4. Beck, K., Andres, C.: Extreme Programming Explained: Embrace Change, 2nd
edn. Addison-Wesley, Boston (2004)
5. Beck, K., et al.: Manifesto for agile software development (February 2001) (Last
Access: Janaury 2007)
6. Binkley, A.B., Schach, S.R.: Validation of the coupling dependency metric as a
predictor of run-time failures and maintenance measures. In: 20th International
Conference on Software Engineering, pp. 452–455 (1998)
7. Cartwright, M., Shepperd, M.: An empirical investigation of an object-oriented
software system. IEEE Transactions on Software Engineering 26(7), 786–796 (2000)
8. Chidamber, S.R., Kemerer, C.F.: A metrics suite for object oriented design. IEEE
Transactions on Software Engineering 20(6), 476–493 (1994)
9. Goldman, A., Kon, F., Silva, P.J.S., Yoder, J.: Being extreme in the classroom:
Experiences teaching XP. Journal of the Brazilian Computer Society 10(2), 1–17
(2004)
10. Gyim´othy, T., Ferenc, R., Siket, I.: Empirical validation of object-oriented met-
rics on open source software for fault prediction. IEEE Transactions on Software
Engineering 31(10), 897–910 (2005)
11. Henderson-Sellers, B.: Object-Oriented Metrics: Measures of Complexity. Prentice
Hall PTR, Upper Saddle River, NJ, USA (1996)
12. Krebs, W.: Turning the knobs: A coaching pattern for XP through agile metrics.
In: Extreme Programming and Agile Methods - XP/Agile Universe 2002, pp. 60–69
(2002)
13. Li, W., Henry, S.: Object oriented metrics that predict maintainability. J. Systems
and Software 23, 111–122 (1993)
14. Martin, R.C.: Agile Software Development: Principles, Patterns, and Practices.
Prentice Hall PTR, Upper Saddle River, NJ, USA (2002)
15. McCabe, T.J., Watson, A.H.: Software complexity. Crosstalk: Journal of Defense
Software Engineering 7, 5–9 (1994)
16. Sato, D., Bassi, D., Bravo, M., Goldman, A., Kon, F.: Experiences tracking agile
projects: an empirical study. To be published in: Journal of the Brazilian Computer
Society (2007) />17. Subramanyam, R., Krishnan, M.S.: Empirical analysis of CK metrics for object-
oriented design complexity: Implications for software defects. IEEE Transactions
on Software Engineering 29(4), 297–310 (2003)
18. Tang, M H., Kao, M H., Chen, M H.: An empirical study on object-oriented
metrics. In: 6th International Software Metrics Symposium, pp. 242–249 (1999)
19. Wake, W.: XP radar chart (January 2001) (Last Access: January 2007)
/>20. Williams, L., Layman, L., Krebs, W.: Extreme Programming evaluation framework
for object-oriented languages – version 1.4. Technical report, North Carolina State
University Department of Computer Science (2004)
G. Concas et al. (Eds.): XP 2007, LNCS 4536, pp. 93–100, 2007.
© Springer-Verlag Berlin Heidelberg 2007
FitClipse: A Fit-Based Eclipse Plug-In for Executable
Acceptance Test Driven Development
Chengyao Deng, Patrick Wilson, and Frank Maurer
University of Calgary
Department of Computer Science
2500 University Dr. NW
Calgary, Alberta T2N 1N4 Canada
{cdeng,piwilson,maurer}@cpsc.ucalgary.ca
Abstract. We conducted a survey on Executable Acceptance Test Driven De-
velopment (or: Story Test Driven Development). The results show that there is
often a substantial delay between defining an acceptance test and its first suc-
cessful pass. Therefore, it becomes important for teams to easily be able to dis-
tinguish between tasks that were never tackled before and tasks that were
already completed but whose tests are now failing again. We then describe our
FitClipse tool that extends Fit by maintaining a history of acceptance test re-
sults. Based on the history, FitClipse is able to generate reports that show when
an acceptance test is suddenly failing again.
Keywords: Executable Acceptance Test-Driven Development (EATDD), ex-
ecutable acceptance test, Fit.
1 Introduction
In Extreme Programming, two sets of test techniques are used for double checking the
performance of a system, unit testing and acceptance testing. [7] With unit testing,
detailed tests from the developer’s perspective are conducted to make sure all system
components are working well. Acceptance testing is the process of customers testing
the functionality of a system in order to determine whether the system meets the re-
quirements. Acceptance tests are defined by or with the customers and are the con-
crete examples of system features. Recent literature on agile methods suggests that
executable acceptance tests should be created for all stories and that a story should not
be considered to be completed until all the acceptance tests are passing successfully.
[3][10] Acceptance tests should be expressed in the customer language (i.e. customers
should be able to understand what they mean) and should be executable (i.e. auto-
mated) and be included in the continuous integration process.
Executable Acceptance Test Driven-Development (EATDD), which is also known
as Story Test-Driven Development (STDD) or Customer Test-Driven Development, is
an extension of Test-Driven Development (TDD). While TDD focuses on unit tests to
ensure the system is performing correctly from a developer’s perspective, EATDD
starts from business-facing tests to help developers better understand the requirements,
94 C. Deng, P. Wilson, and F. Maurer
to ensure that the system meets those requirements and to express development pro-
gress in a language that is understandable to the customers. [11]
From the customer’s perspective, EATDD provides the customer with an “execu-
table and readable contract that the programmers have to obey” if they want to declare
that the system meets the given requirements. [12] Observing acceptance tests also
gives the customers more confidence in the functionality of the system. From the per-
spective of programmers, EATDD helps the programmers to make sure they are de-
livering what the customers want. In addition, the results help the team to understand
if they are on track with the expected development progress. Further, as EATDD
propagates automated acceptance test, these tests can play the role of regression tests
in later development.
This paper is organized as follows: section 2 discusses a survey and the motiva-
tions for building such a tool; section 3 presents the related work and Eclipse plug-ins
based on Fit; section 4 describes the overall design of FitClipse; section 5 talks about
how FitClipse works for EATDD; section 6 demonstrates our initial evaluation of
FitClipse.
2 Survey Results and Motivation
We conducted a survey to find out how EATDD is being used in industry by sending
questionnaires to mailing lists and discussion groups of Agile communities. The com-
prehensive findings of this study will be published in the future. One specific part of
that study is relevant for this paper: We asked about the time frame between defining
an acceptance test and its fist successful passing. The findings of this questionnaire
are a core motivation underlying the development of FitClipse.
2.1 Timeframe of EATDD
A major difference between TDD using unit tests and EATDD is the timeframe
between the definition of a test and its first successful pass. Usually, in TDD the ex-
pectation is that all unit tests pass all the time and that it only takes a few minutes
between defining a new test and making it pass [8]. As a result, any failed test is seen
as a problem that needs to be resolved immediately. Unit tests cover very fine grained
details which makes this expectation reasonable in a TDD context.
Acceptance tests, on the other hand, cover larger pieces of functionality. Therefore,
we expected that it may often take developers several hours or days, sometimes even
more than one iteration, to make them pass.
For validating our hypothesis, we conducted a survey by sending a questionnaire to
email groups of Agile Communities (such as the Yahoo agile-usability group and the
Yahoo agile-testing group etc.). One goal of the survey was to find out the timeframe
between the definition of an acceptance test and making it pass successfully. We were
expecting the following results:
• The average timeframe between defining one acceptance test and making it
pass successfully, following EATDD, is more than 4 hours (half a day).
• The maximum timeframe between defining one acceptance test and making it
pass successfully, following EATDD, may be the majority of an iteration or
even more than one iteration.
FitClipse: A Fit-Based Eclipse Plug-In for EATDD 95
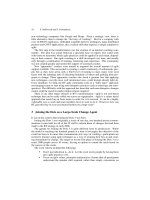
Overall, we received 33 responses, among which 31 were valid. Fig. 1 shows the
detailed findings of the survey according to the above expectations.
The result of the survey strongly supports our first expectation. About 87.1%
(27/31) of the participants reported the average timeframe to be more than 4 hours for
defining an acceptance test and making it pass and the number increased to 100%
when they reported the maximum time.
Our second expectation is also supported by the survey result. 41.4% (12/29, two
participants did not answer) of the participants spent most of an iteration to finish one
acceptance test, and about 24.1% (7/29) of the participants reported the time frame to
be several iterations. One of the participants even spent several months working on
making a single acceptance test pass.
Therefore, both of our expectations were substantiated by the evidence gathered in
this survey. We can also draw the conclusion that the time frame between the defini-
tion of an acceptance test and its first successful pass is much longer than that of unit
test.
2.2 Motivation of FitClipse
Due to the substantial delay between the definition and the first successful pass of an
acceptance test, a development team can NOT expect that all acceptance tests pass all
the time. A failing acceptance test can actually mean one of two things:
• The development team has not yet finished working on the story with the
failing acceptance test (including the developer has not even started working
on it).
• The test has passed in the past and is suddenly failing – i.e. a change to the
system has triggered unwanted side effects and the team has lost some of the
existing functionalities.
Fig. 1. This Chart shows the survey results of the time frame between the definition of an ac-
ceptance and making it pass successfully
Survey Results: Time Frame of Running Acceptance Tests
0
4
3
8
5
8
3
00
2
3
5
12
7
0
2
4
6
8
10
12
14
< 1 ho
ur
< 4 ho
ur
s
< 1 day
2-3
day
s
< 1
w
eek
1 iteration
S
ev
it
er
a
tions
Average Time
Maximum Time
Num of Answers
Time Frames
96 C. Deng, P. Wilson, and F. Maurer
The first case is simply a part of the normal test-driven development process: It is
expected that a test that has never passed before should fail if no change has been
made to the system code. The later case should be raising flags and should be high-
lighted in progress reports to the team. Otherwise the users have to rely on their recol-
lection of past test results to determine the meaning of a failing test. For anything but
very small projects, this recollection will not be reliable.
FitClipse raises a flag for the condition that a test that is failing but was passing in
the past. It identifies this condition by storing the results of previous test executions
and is, thus, able to distinguish these two cases and splits up the “failed” state of Fit
into two states: “still failing” and “now failing after passing earlier”.
3 Related Work
There are several open source frameworks and tools that support EATDD, with Fit
[4], FitLibrary and FitNesse [5] being three of the most relevant to our work.
Fit is a framework for integrated testing. “It is well suited to testing from a busi-
ness perspective, using tables to represent tests and automatically reporting the results
of those tests.”[9] Fixtures, made by the programmers to execute the business logic
tables, map the table contents to calls into the software system. Test results are dis-
played using three different colors for different states of the test: green for passing
tests; yellow for tests that can not be executed and red for failing tests. FitLibrary is a
collection of extensions for the fixtures in Fit. Other than test styles that Fit provides,
it also supports testing grids and images. FitNesse is a Wiki front-end testing tool
which supports team collaboration for creating and editing acceptance tests. FitNesse
uses the Fit framework to enable running acceptance tests via a web browser. It also
integrates FitLibrary fixtures for writing and running acceptance tests.
Our FitClipse tool is an Eclipse plug-in that uses the Fit framework for writing and
running the acceptance tests. There are several other Eclipse plug-ins which also use
Fit or FitNesse, including FitRunner [6], conFIT [
2] and AutAT [1]. FitRunner con-
tributes to Eclipse a Fit launch configuration that enables people to run automated
acceptance tests. ConFIT uses a FitNesse server, which can run either locally or re-
motely, to perform acceptance tests. AutAT enables non-technical users to write and
execute automated acceptance tests for web applications using a user-friendly graphi-
cal editor. [1]
Compared to the above tools and in addition to running acceptance tests with the
Fit frame work, FitClipse extends the Fit tests result schema with historical result in-
formation for the users. In FitClipse, instead of one single test failure state, two kinds
of acceptance test failure states are distinguished automatically: unimplemented fail-
ure and regression failure.
4 FitClipse
FitClipse [13] is an Eclipse plug-in supporting the creation, modification and execu-
tion of acceptance tests using the FIT/FitNesse frame work.
FitClipse: A Fit-Based Eclipse Plug-In for EATDD 97
FitClipse works as a client side application and communicates with a Wiki reposi-
tory, which works as the server. The repository has been implemented with FitNesse.
The FitClipse tool consists of (multiple) FitClipse clients for editing and running ac-
ceptance tests, the Wiki repository for storing acceptance test definitions and the Da-
tabase for storing the test execution history (See Fig. 2). Using FitClipse, acceptance
tests are written, on the client side, in the form of executable tables with Wiki syntax
and then saved on the server side as Wiki pages. FitClipse uses the Fit engine to run
the acceptance tests.
Fig. 2. Overview of FitClipse framework with FitNesse as the backend. We extend FitNesse
server by adding a FitClipse Responder to handle the requests from FitClipse clients and to talk
with the database for saving and retrieving the test results.
In order to distinguish two test failure states, FitClipse, coupled with a Wiki reposi-
tory server, stores the results of each test run and can retrieve the result histories for
each test and each test suite. The algorithm for distinguishing two test result failures is
as follows:
for (each test t){
t.run();
PersistTestResult (t.result);
if (t.isFailing){
getResultHistory(t);
If (hasPassedBefore(t)){
displayRegressionFeature();
}else
displayUnimplementedFailure(t);
}}}
FitClipse splits up the test failure state in Fit or FitNesse into two: Unimplemented
failure and Regression failure. Table 1 shows the four test result states in FitClipse
comparing them to the three states of Fit or FitNesse.
98 C. Deng, P. Wilson, and F. Maurer
Table 1. Comparison of test result states of FitClipse and Fit or FitNesse
Test Result States Fit or FitNesse FitClipse
Regression Failure – failure as a result of
a recent change losing previously working
functionality (color red)
Failure
(the tests fail)
Color Red
Unimplemented Feature – not really a
failure as it might simply mean that the
development team hasn’t started to work on
this feature (color orange)
Passing
(the tests pass)
Color Green
test page with green bar – no difference
to Fit/FitNesse (color green)
Exception
(the tests can not be
executed)
Color Yellow
test page with yellow bar – no difference
to Fit/FitNesse (color yellow)
5 FitClipse and EATDD
FitClipse provides the following core functionalities for EATDD:
1) Create and modify Acceptance Tests: In the FitClipse environment (as shown in
Fig. 3), customer representatives, testers and developers collaborate on creating
acceptance tests for each story. Users can create, delete and restructure acceptance
tests in FitClipse.
2) Creating Fixtures: The programmers create fixtures that translate Fit tables into
calls to the system under development. Based on a given acceptance test, FitClipse
can generate the fixture code stubs automatically. Fig. 3 shows sample Fit tests
and corresponding fixture code in FitClipse.
Fig. 3. Fit tests and fixture code in FitClipse environment
Fit Test Hierarchy View
Fit Test Editor
FitClipse: A Fit-Based Eclipse Plug-In for EATDD 99
3) Implementation: In this step, unit test-driven development is utilized in conjunc-
tion with EATDD. Programmers follow TDD to implement features of the system.
After several unit tests are passing, one acceptance test will pass, too. All through
the implementation of acceptance tests, FitClipse provides two kinds of test failure
states and maintains the test result history. Fig. 4 shows all test states and a sample
test result history in FitClipse.
6 Initial Evaluation
We ran an initial self-evaluation on FitClipse by using it for two iterations. The
evaluation lasted for 6 weeks and had several findings.
We followed EATDD process in our development process. In all, we spent about
150 programming hours and created 14 acceptance tests with 40 assertions.
Our first observation confirms our expectations. The distinction between two test
failure states was helpful when the number of acceptance tests increased. When we
broke the system by adding new code, the second failure state warned us at once by
showing the special flag. We did not have to trace in a test history record or rely on
our memory to recognize which test was passing before and broken by ourselves.
Second, the test result history provided helpful information for us to understand the
development progress. In FitClipse, we can generate a test result history chart for a
suite which includes all the acceptance tests in the iteration. From the number of pass-
ing and failing acceptance test we could see how our development was progressing.
Even though we only have limited time to evaluate FitClipse, we find that it was
worth the effort as the distinction between two test failure states is useful. We believe
that if we had spent a longer time for the evaluation with more acceptance tests, we
would find the tool even more helpful.
To address the self-confirmation bias of the initial self evaluation, we will conduct
a controlled experiment using outsiders in February and March 2007.
Fig. 4. Test result states and test result history for an acceptance test
FIT Test Result
Test Result View
100 C. Deng, P. Wilson, and F. Maurer
7 Conclusion and Future Work
This paper presents FitClipse, a Fit-based tool for automated acceptance testing and a
self-evaluation of the tool.
Existing tools are limited in supporting Acceptance Test Driven Development as
they do not provide enough information to distinguish two different kinds of test fail-
ures. FitClipse distinguishes these failure states by maintaining a test result history on
the server, which is valuable for analyzing the existing progress and making im-
provements.
From the self-evaluation, we can see that FitClipse can provide useful support for
EATDD. However, this self-evaluation is limited in time and the number of accep-
tance tests. Therefore, the next research step is to conduct a more formal evaluation of
the approach to assess if FitClipse as a whole is useful for development teams to prac-
tice Executable Acceptance Test Driven Development. In the future, FitClipse will
also provide a WYGIWYS editor for supporting the users to edit the Fit test docu-
ments.
References
1. Schwarz, C., Skytteren, S.K., Øvstetun, T.M.: AutAT – An Eclipse Plugin for Automatic
Acceptance Testing of Web applications. OOPSLA’05. October 16–20, 2005, San Diego,
California, USA (2005) ACM 1-59593-193-7/05/0010 (See also:
autat/)
2. conFIT: A FitNesse for Eclipse Plugin (
3. Extreme Programmin: Acceptance Tests, (
functionaltests.html)
4. Fit: Framework for Integrated Test (
5. FitNesse Web site (
6. FitRunner: an Eclipse plug-in for Fit ()
7. Beck, K.: Extreme Programming Explained: Embrace Change. Addison Wesley, Boston
(2000)
8. Beck, K.: Test-Driven Development: By example, p. 11. Addison –Wesley, London
(2003)
9. Mugridge, R., Cunningham, W.: Fit for Developing Software: Framework for Integrated
Tests, p. 1. Prentice Hall, Englewood Cliffs (2005)
10. Miller, R.W., Collins, C.T.: Acceptance Testing, 2001 XP Universe Conference, Raleigh,
NC, USA (July 23–25, 2001)
11. Story Test Driven Development (
12. Tracy Reppert, Do’t Just Break Software, Make Software, Better Software Magazine
(July/August 2004) available on line:
13. University of Calgary, EBE website: FitClipse, (
Wiki.jsp?page=.FitClipse)
G. Concas et al. (Eds.): XP 2007, LNCS 4536, pp. 101–104, 2007.
© Springer-Verlag Berlin Heidelberg 2007
EZUNIT: A Framework for Associating Failed Unit Tests
with Potential Programming Errors
Philipp Bouillon, Jens Krinke, Nils Meyer, and Friedrich Steimann
Schwerpunkt Software Engineering
Fakultät für Mathematik und Informatik
Fernuniversität in Hagen
D-58084 Hagen
, ,
,
Abstract. Unit testing is essential in the agile context. A unit test case written
long ago may uncover an error introduced only recently, at a time at which
awareness of the test and the requirement it expresses may have long vanished.
Popular unit testing frameworks such as JU
NIT may then detect the error at little
more cost than the run of a static program checker (compiler). However, unlike
such checkers current unit testing frameworks can only detect the presence of
errors, they cannot locate them. With E
ZUNIT, we present an extension to the
JU
NIT ECLIPSE plug-in that serves to narrow down error locations, and that
marks these locations in the source code in very much the same way syntactic
and typing errors are displayed. Because E
ZUNIT is itself designed as a frame-
work, it can be extended by algorithms further narrowing down error locations.
1 Introduction
All contemporary integrated development environments (IDEs) mark syntax errors in
the source code, in close proximity of where they occur. In addition, static type-
checking lets the compiler find certain logical errors (sometimes called semantic er-
rors) and assign them to locations in the source in much the same way as syntax
errors. Today, remaining errors in a program are mostly found by code reviews and
by testing, in the context of XP and other agile approaches especially by pair pro-
gramming and by executing unit tests.
JU
NIT is a popular unit testing framework. It is based on the automatic execution of
methods designated as test cases. A test case usually sets up a known object structure,
called test fixture, executes one or more methods to be tested on the fixture, and com-
pares the obtained result with the expected one (including the possible throwing of
exceptions). Because the expected result must be determined by some other way than
executing the method(s) under test (the test oracle), test cases are usually rather sim-
ple. However, there is no theoretic limitation on the complexity of test cases, other
than that they must run without user interaction and that the result must be repeatable.
JU
NIT as currently designed reports errors in the form of failed tests. Contemporary
IDE integration of JU
NIT lets the developer navigate from the test report to the failed
102 P. Bouillon et al.
test case, that is, to the test method that discovered an unexpected result. However,
the test method only detects the presence of a programming error — it does not con-
tain it. The developer must infer the location of the error from the failed test case,
which is not necessarily trivial. But even if it is, navigating from the error report to
the source of the error currently requires a detour via the test case. Transferred to
syntax and type checking, this would correspond to navigating from an error report to
the error source via the syntax or typing rule violated, which would clearly be consid-
ered impractical.
Our ultimate goal is to lift unit testing to the level of syntactic and semantic check-
ing: a logical error detected by a unit test should be flagged in the source code as
close as possible to the location where it occurred. As a first step in this direction, we
present here for the first time an extension of the JU
NIT integration in ECLIPSE, named
E
ZUNIT, that provides basic reporting and navigation facilities, and that accommo-
dates for algorithms and procedures serving to narrow an error location.
2 The Framework
In JUNIT 4, test cases are tagged with the @Test annotation. When adding a test case
through E
CLIPSE’s New > JUnit Test Case… menu and selecting a method to be tested,
the test method is automatically annotated with a Javadoc tag saying that this method
is a test method for the method for which it was created. We raise this comment to the
level of an annotation, named @MUT (for method under test), and allow more than one
method under test to be listed. This accommodates for the fact that the tested method
may call other methods, which may also be tested by the test case, and that the ini-
tially called method may be known to be correct, while other methods it calls are not.
To help the programmer with generating the annotations, a static call graph analysis
of the test method is provided, listing all methods the test method potentially calls.
From this the developer can select the methods intended to be tested by this test case.
The generated list can be automatically filtered by an exclusion/inclusion of packages
expression (e.g., excluding all calls to the JU
NIT framework).
The @MUT annotations are exploited in various ways. Firstly, they aid with the
navigation between test methods and methods under test: via a new context menu in
the Outline view of an editor, the developer can switch from a method under test to
the methods testing it and vice versa, without knowing or looking at the implementa-
tion of a method. Secondly, and more importantly, whenever a test case fails during a
test run, corresponding markers are set in the gutter of the editor, in the Package Ex-
plorer, and in the Problems view. Fig. 1 shows a test method (from the well-known
Money example distributed with JU
NIT) with a corresponding @MUT annotation, and
the hints provided by a test run after an error has been seeded in the add() method
of Money.
Surely, in the given example associating the failed testSimpleAdd() with
add() in Money is not a big deal, but then spotting the error in add() without
knowledge of the test method isn’t either, so that the developer saves one step in pin-
ning down and navigating to the error. In more complex cases, especially where there
is more than one method to which blame could be assigned, checking all methods that
may have contributed to the failure requires more intimate knowledge of the test case.