SCIENCE REASONING TEST (35 Minutes - 40 Questions) pdf
Bạn đang xem bản rút gọn của tài liệu. Xem và tải ngay bản đầy đủ của tài liệu tại đây (47.54 KB, 13 trang )
4 6 6 6 6 6 6 6 6 6 6 4
SCIENCE REASONING TEST
35 Minutes—40 Questions
DIRECTIONS: Each of the following seven passages is followed by several questions. After reading each passage, decide on the best
answer to each question and fill in the corresponding oval on your answer sheet. You are allowed to refer to the passages while
answering the questions.
Passage I
Medical researchers and technicians can track the characteristic
radiation patterns emitted by certain inherently unstable
isotopes as they spontaneously decay into other elements. The
half-life of a radioactive isotope is the amount of time
necessary for one-half of the initial amount of its nuclei to
decay. The decay curves of isotopes 39Y90 and 39Y91 are
graphed below as functions of the ratio of N, the number of
nuclei remaining after a given period, to N 0, the initial number
of nuclei.
N/N 0
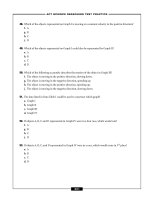
1.
A.
B.
C.
D.
2.7 days.
5.4 days.
27 days.
58 days.
90
39 Y
1.0
0.9
0.8
0.7
0.6
0.5
0.4
0.3
0.2
0.1
2.
What will the approximate ratio of 39Y90 to 39Y91 be
after 2.7 days if the initial samples of the two isotopes
contain equal numbers of nuclei?
F.
G.
H.
J.
1
2
3
4
5
time (days)
91
39 Y
1.0
0.9
0.8
0.7
0.6
0.5
0.4
0.3
0.2
0.1
30
60
90
1:1
1:2
2:1
10:1
6
3.
N/N 0
The half-life of 39Y90 is approximately:
When inhaled by humans, 39Y90 accumulates in the
gastrointestinal tract, whereas 39Y91 accumulates in the
bones. If the total amount of each isotope inhaled goes
to the specified area, which of the following situations
will exist three days after a patient inhales these
substances, assuming none of the isotopes leave the
specified areas due to physiological factors?
A. The amount of 39Y91 in the gastrointestinal tract
will be approximately equal to the total amount
inhaled.
B. The amount of 39Y90 in the bones will be
approximately one-half of the total amount inhaled.
C. The amount of 39Y90 in the gastrointestinal tract
will be approximately one-half of the total amount
inhaled.
D. None of the 39Y91 inhaled will be left in the bones.
120 150 180
time (days)
264
GO ON TO THE NEXT PAGE.
4 6 6 6 6 6 6 6 6 6 6 4
4.
Approximately how many 39Y91 nuclei will exist after
three half-lives have passed, if there are 1,000 nuclei to
begin with?
5.
Which of the following conclusions is(are) supported by
the information given in the passage?
I. 39Y90 is less stable than 39Y91
II. Only one-quarter of the original amount of
will remain after 116 days.
III. 39Y90 and 39Y91 are both radioactive.
F. 50
G. 125
H. 250
J. 500
A.
B.
C.
D.
265
90
39Y
I only
III only
I and II only
I and III only
GO ON TO THE NEXT PAGE.
4 6 6 6 6 6 6 6 6 6 6 4
Passage II
Experiment 3
Recently, college teams from all over the country sent tennis
players to participate in a series of experiments conducted by
the Physical Education Department of a major university. A
variety of coaching methods was used to improve the players'
serves, as described below.
For two weeks, a third group of 100 right-handed tennis
players worked on their basic serves. 50 players received no
verbal instruction; they watched the same video of the righthanded tennis coach, who also physically guided them through
the motions of the serve. The other 50 players did not observe
the video but received verbal instruction from the coach, who
then physically guided them through the motions of the serve.
The results are shown in Table 3.
Experiment 1
Two groups of 50 tennis players worked on the speed of their
basic serves for two weeks. One group consisted solely of
right-handed players; the other consisted solely of left-handed
players. Half of each group watched videos of a right-handed
tennis coach, while the other half watched videos of a lefthanded coach. Each player was told to pattern his or her serve
on that of the coach in the video. The players received no
verbal or physical guidance. The average speed of each player's
serve was measured at the beginning and end of the two-week
period, and changes were recorded in Table 1.
Table 3
Guidance
plus
Average change in
speed (mph)
Verbal
Video coaching
+7
+10
Table 1
Players’
handedness
Coach’s
handedness
Average change in
speed (mph)
Right
Right
Left
Left
Right
Left
Right
Left
+5
+2
–1
+8
6.
F. The average service accuracy of all the players would
increase by at least 30%.
G. The average service speed of all the players would
decrease slightly.
H. Verbal coaching would improve average service
speed less than would watching the video.
J. The average service speed of the players who
watched the video would increase by at least 8 mph.
Experiment 2
For two weeks, a second group of 100 right-handed tennis
players watched the same videos of the right-handed tennis
coach. The coach also physically guided 50 of those players
through the motions of the serve. Again, no verbal instruction
was given during the experiment. The average speed and
accuracy of each player's serves were recorded at the beginning
and end of this two-week period. The results are recorded in
Table 2.
7.
Table 2
Guided
Average change in
speed (mph)
+5
+9
Which of the following conclusions could NOT be
supported by the results of Experiment 1?
A. Imitating someone whose handedness is the opposite
of one's own will cause one's skills to deteriorate.
B. Left-handed people are better than right-handed
people at imitating the movement of someone with
similar handedness.
C. People learn more easily by observing someone
with similar handedness than by observing someone
with handedness opposite their own.
D. Right-handed people are better than left-handed
people at imitating the movement of someone
whose handedness is opposite their own.
Average change in
accuracy
No
Yes
Which of the following results would be expected if
Experiment 3 were repeated using left-handed tennis
players and a left-handed coach?
+15%
+25%
266
GO ON TO THE NEXT PAGE.
4 6 6 6 6 6 6 6 6 6 6 4
8.
Which of the following hypotheses is best supported by
the results of Experiment 2?
F. Instructional videos are more helpful for right-handed
tennis players than verbal instruction.
G. Instructional videos are more helpful for left-handed
tennis players than for right-handed tennis players.
H. Physical guidance by a coach improves both speed
and accuracy of service for right-handed tennis
players.
J. Physical guidance by a coach improves service
accuracy for right-handed tennis players more than
for left-handed players.
9.
10.
Which of the following hypotheses is best supported by
the results of Experiment 1 alone?
F. Tennis players improve less by observing coaches
whose handedness is the opposite of their own than
by observing those with similar handedness.
G. Right-handed tennis players are coached by lefthanded coaches more frequently than left-handed
players are coached by right-handed coaches.
H. Right-handed coaches are better models for all tennis
players than are left-handed coaches.
J. People learn much better from physical contact plus
a visual stimulus than from the visual stimulus
alone.
Suppose 50 left-handed tennis players watch a video of a
left-handed coach and are also physically guided by that
coach. The results of the experiments suggest that the
players' average change in service speed will most
closely approximate:
11.
A. –1 mph.
B. +5 mph.
C. +8 mph.
D. +12 mph.
What change in procedure would allow a researcher to
best determine the effects of verbal instruction on the
average service speed of tennis players?
A. Repeating Experiment 3 with left-handed players
B. Repeating Experiment 2 with an instructional audio
tape instead of a video
C. Measuring the service speed of 100 tennis players
before and after they listened to an instructional
audio tape
D. Verbally coaching 50 left-handed and 50 right-handed
tennis players and then measuring their service speed
267
GO ON TO THE NEXT PAGE.
4 6 6 6 6 6 6 6 6 6 6 4
Passage III
14.
The temperature of any stellar body causes it to emit a
characteristic spectrum of radiation. The apparent color of the
star corresponds to the wavelength at which most of its
radiation is emitted. Stars are assigned to spectral classes
according to these characteristic wavelengths, with O as the
bluest/warmest and M as the reddest/coolest. The HertzsprungRussell (H–R) diagram below plots each known star within 5
parsecs of the Sun by spectral class and absolute magnitude.
Absolute magnitude is a measure of luminosity as viewed
from a distance of 10 parsecs. An absolute magnitude of +1.0
indicates maximum brightness. (1 parsec = 3.23 light years.)
+1.0
+2.0
+3.0
+4.0
+5.0
+6.0
+7.0
+8.0
+9.0
+10.0
+11.0
+12.0
+13.0
+14.0
+15.0
+16.0
+17.0
Sirius
Altair
F. The majority of stars within 5 parsecs of the
Sun are visible from a distance of 10 parsecs.
G. The majority of stars within 5 parsecs of the Sun are
not visible from a distance of 10 parsecs.
H. Stars in spectral classes K and M are visible from a
distance of 10 parsecs.
J. Stars in spectral class B are visible from a distance
of 10 parsecs.
Procyon
Sun
α-Centauri
15.
III.
B
A
F
G
K
M
A.
B.
C.
D.
x-axis: spectral class
y-axis: absolute magnitude
α -Centauri is redder in color than Sirius.
The Sun has a higher surface temperature than does
Altair.
If both the Sun and Procyon were viewed at a
distance of 10 parsecs, the Sun would appear
brighter.
I only
III only
I and II only
II and III only
According to the data shown, most stars within 5
parsecs of the Sun have:
F.
G.
H.
J.
13.
The data given in the passage support which of the
following conclusions?
I.
II.
O
12.
The faintest stars that are visible to the naked eye are of
the 6th magnitude. On the basis of this information and
the data given, which of the following conclusions is
most likely to be valid?
a spectral class of M.
an absolute magnitude of +11.0.
a mass similar to that of the Sun.
a bluish color.
16.
F. The number of points on the graph would
approximately double, while the shape would remain
the same.
G. Most of the additional stars would fall in the
portion of the graph between Sirius and α Centauri.
H. Most of the additional stars would be in spectral
class M with an absolute magnitude of less
than +16.0.
According to the information given, which of the
following stars — Sirius, Altair, α -Centauri —
are likely to be hotter than the Sun?
A. Sirius, Altair, and
B. Sirius and Altair
C. Sirius
D. α -Centauri
In which of the following ways would a HertzsprungRussell diagram that included all of the known stars
within 10 parsecs of the Sun differ from the one shown
here?
α -Centauri
268
GO ON TO THE NEXT PAGE.
4 6 6 6 6 6 6 6 6 6 6 4
J.
It cannot be determined from the information given.
269
GO ON TO THE NEXT PAGE.
4 6 6 6 6 6 6 6 6 6 6 4
Passage IV
The reaction of a certain cobalt complex with sodium nitrite
(NaNO2) can yield two different products. Product A is a light
orange solid with a melting point measured at approximately
90.5° C; Product B is a dark pink solid with a melting point
of 68° C. A series of experiments was performed to determine
the reaction conditions that favor each product.
19.
Which of the following additional experiments would
yield the most useful data concerning the reaction
conditions that favor each product?
A.
B.
C.
D.
Experiment 1
Two separate solutions of the cobalt complex were prepared as
follows. Solution 1 was acidified to pH 5.5; Solution 2 was
made basic to pH 8.5. All other conditions were identical for
the two solutions. When NaNO2 was added to Solution 1, a
dark pink solid with a melting point of 68° C was formed.
Adding NaNO2 to Solution 2 produced a white solid with a
melting point of 81°C.
20.
Varying the concentration of the solutions
Testing with pH levels of 7.0
Heating the solutions to 175° C
Freezing the solutions
Experiment 2
Which of the following hypotheses is supported by the
results of Experiment 2 only?
Two separate solutions of the cobalt complex were prepared as
above. After addition of NaNO2, the solutions were heated to
110° C for 20 minutes. Solution 1 produced a dark pink solid
with a melting point of 68° C. Solution 2 produced a light
orange solid which melted at 91° C.
F. Products A and B can both be formed in solutions
heated to 110° C.
G. Solution 1 must be heated to yield any product.
H. Citrate ion prevents the formation of Product A.
J. Product B forms more readily at lower temperatures.
Experiment 3
Two separate solutions were prepared as in the previous
experiments. After the addition of NaNO2, each solution was
treated with a small amount of citrate ion and then heated as in
Experiment 2. Solution 1 remained a clear purple liquid.
Solution 2 produced a light orange solid which melted at
90° C.
17.
Which of the following conditions remain(s) constant in
all three experiments?
A. The temperature of the solutions during the
experiments
B. The initial amount of cobalt complex present
C. The amount of citrate ion present
D. The amount of cobalt complex and the amount of
citrate ion present
The experimental results indicate that Product B is most
likely to form when one heats:
A.
B.
C.
D.
18.
21.
a basic solution with added citrate ion.
an acidic solution with added citrate ion.
an acidic solution with no added citrate ion.
a basic solution with no added citrate ion.
Which of the following conclusions is NOT supported
by the experimental results?
F. The formation of Product B is not affected by the
presence of citrate ion.
G. The formation of Product B is not affected by the
heating of the solution.
H. Products A and B form under different conditions.
J. The formation of Product A is affected by the
heating of the solution.
22.
270
It is suggested that Product B may react to form other,
more readily dissolved compounds in the presence of
certain ions. Such a hypothesis is best supported by the
fact that:
F. Product A forms at a different pH than Product B.
G. Solution 2 yields a different color solid when heated.
H. Product B is unstable in the presence of Product A.
GO ON TO THE NEXT PAGE.
4 6 6 6 6 6 6 6 6 6 6 4
J.
No solid forms in Solution 1 when citrate ion is
added prior to heating.
271
GO ON TO THE NEXT PAGE.
4 6 6 6 6 6 6 6 6 6 6 4
Passage V
Two scientists present various grounds for classifying the
giant panda (Ailuropoda melanoleuca) as a raccoon or as a
bear.
24.
Scientist 1
F. Giant pandas should be classified in a separate
family.
G. The giant panda should not be classified as a
raccoon.
H. Raccoons and bears are physically and behaviorally
very similar.
J. Animals should be classified into families based on
their physical, behavioral, and genetic c
characteristics.
Although the giant panda superficially resembles a bear
(Ursidae), many of its anatomical, behavioral, and genetic
characteristics are closer to those of raccoons (Procyonidae).
The bones and teeth of Ailuropoda melanoleuca, for example,
are very similar in structure to those of the raccoon. While
male bears can be up to 100% larger than females of the same
species, male giant pandas and raccoons differ very little in size
from females of their species. Like the raccoon, the giant
panda has a friendly greeting which consists of bleating and
barking. When intimidated, both animals cover their eyes with
their front paws. Most bears do not exhibit these behaviors.
Finally, Ailuropoda melanoleuca and the Procyonidae have
21 and 19 pairs of chromosomes, respectively, while the
Ursidae have 36 pairs.
25.
Which of the following characteristics would support
the classification of a mammal as a member of the
Ursidae?
I. 36 pairs of chromosomes and DNA similar to that
of many bear species
II. Raccoon-like markings and 19
pairs of
chromosomes
III. 62% greater average size among males than among
females
Scientist 2
Giant pandas should be classified as Ursidae. Research studies
have shown that the ancestors of Ailuropoda melanoleuca had
about 40 chromosomal pairs, and geneticists theorize that the
reduction occurred when the chromosomes underwent head-tohead fusion. Other research has shown that the DNA of the
giant panda is far more similar to that of the Ursidae than to
that of any other family. Furthermore, giant pandas and other
bears are not only of similar size, but also have very similar
body proportions and walk with the same pigeon-toed gait.
Giant pandas display aggressive behavior in the same manner
as do other bears, by swatting and trying to grab adversaries
with their forepaws.
A.
B.
C.
D.
26.
23.
Scientist 1 and Scientist 2 would agree on which of the
following points?
Which of the following, if true, would provide
additional support for the hypothesis of Scientist 2?
According to Scientist 1, which of the following is the
giant panda most likely to do when frightened?
F.
G.
H.
J.
A. The blood proteins of giant pandas are very
similar to those of several bear species.
B. Giant pandas and raccoons have similar markings,
including dark rings around their eyes.
C. Giant pandas have 21 pairs of chromosomes while
raccoons have only 19 pairs.
D. There is little difference in size between male and
female giant pandas.
27.
I only
II only
I and III only
II and III only
Bleat and bark
Cover its eyes with its paws
Swat and grab with its forepaws
Walk away pigeon-toed
According to Scientist 2, the giant panda should be
classified as a bear because:
A. there is little disparity in the size of male and
female giant pandas.
272
GO ON TO THE NEXT PAGE.
4 6 6 6 6 6 6 6 6 6 6 4
B. the greeting rituals of the giant panda resemble
those of bears.
C. both bears and giant pandas are herbivorous.
D. the DNA of giant pandas is similar to that of bears.
28.
Suppose that giant pandas have glandular scent areas.
This fact could be used to support the viewpoint of:
29.
F. Scientist 1, if it were also shown that raccoons also
have glandular scent areas.
G. Scientist 2, if it were also shown that bears do not
have glandular scent areas.
H. Scientist 1, if it were also shown that raccoons
have a very poor sense of smell.
J. Scientist 2, if it were also shown that bears urinate
to lay down their scent.
Which of the following arguments could Scientist 1 use
to counter Scientist 2's claim about the behavior of
giant pandas and bears?
A. The giant panda walks with a pigeon-toed gait.
B. Unlike most bears, but like raccoons, an aggressive
giant panda bobs its head up and down.
C. The giant panda swats and grabs at its adversaries.
D. Unlike most bears, the giant panda has only 19
pairs of chromosomes.
273
GO ON TO THE NEXT PAGE.
4 6 6 6 6 6 6 6 6 6 6 4
Passage VI
30.
The graph below shows different primary energy sources as
percentages of energy consumption in the United States during
selected years from 1850 to 1985.
As the relative importance of petroleum as a
primary energy source increased, the use of coal:
F.
G.
H.
J.
ENERGY SOURCES OVER THE
LAST 150 YEARS
also increased.
decreased.
remained constant.
stopped completely.
x-axis: Year
y-axis: Total % of primary energy use
31.
100
The data shown support the hypothesis that the
ability to utilize coal as an energy source:
A. was developed during the 1900's.
B. was dependent on the development of
mechanized mining techniques.
C. predated the ability to utilize natural gas.
D. was predated by the ability to utilize natural
gas.
80
60
32.
As the consumption of alternate energy sources
increased, the use of farm animals:
F.
G.
H.
J.
40
decreased to below 1% of the total.
increased to over 30% of the total.
increased, then decreased.
remained the same.
20
33.
1850
1900
1950
Which of the following conclusions concerning
energy consumption from 1900 to 1950 is
supported by the information given in the graph?
A.
B.
C.
D.
1985
Animals, direct wind, and water power
Fuel wood
Energy sources became more diverse.
Work animals became more important.
Natural gas became the major energy source.
Coal remained the largest single source of
energy.
Coal
34.
Petroleum
The data on the graph support which of the
following conclusions?
Natural gas
I. Energy consumption in 1985 relied in part on
technologies that did not exist in 1850.
II. The largest source of energy in the United States
has always been coal.
III. The short supply of available petroleum will lead
to a decrease in its use.
Hydropower
Nuclear
F.
G.
H.
J.
274
I only
III only
I and II only
II and III only
GO ON TO THE NEXT PAGE.
4 6 6 6 6 6 6 6 6 6 6 4
† cumulative total
Passage VII
35.
The regenerative powers of Asterias rubens, a common
starfish, were investigated in the following experiments.
Experiment 1
A. 25%
B. 50%
C. 75%
D. 100%
Randomly selected starfish were divided into five groups of 25
each. The individuals in one group were left intact. Members
of the other four groups were subjected to selective
amputation, as indicated in the table below. The starfish were
kept in laboratory tanks simulating the natural environment of
Asterias rubens for nine months. The results of periodic
observations are recorded in Table 1.
Table 1
Removed
body
portion
None
Outer arm
Whole
arm
Arm
+
1/5 body
2 arms +
1/3 body
36.
# of starfish fully
regenerated after†:
3 mos.
6 mos.
9 mos.
—
23
22
—
23
22
6
21
23
2
5
12
24
Which of the following conclusions is supported by the
results of Experiment 2 only?
F. Starfish are only capable of regenerating arms.
G. Starfish with larger portions removed regenerate at
faster rates.
H. Some starfish die as a result of confinement in
laboratory tanks.
J. Regeneration is dependent upon the existence of a
portion of the central body.
# of starfish
dead after 9
mos.
3
2
3
—
20
15
According to the experimental results, approximately
what percentage of Asterias rubens specimens can
regenerate two entire arms and part of the central body
within six months?
1
37.
† cumulative total
The information given supports which of the following
conclusions?
Experiment 2
I.
II.
The regenerative powers of portions of Asterias rubens were
investigated next. Five groups of pieces of Asterias rubens
were selected at random, placed in separate laboratory tanks
under the same conditions as in Experiment 1, and observed for
one year. The combined results from all five tanks are
presented in Table 2.
III.
A.
B.
C.
D.
Table 2
# of starfish fully
regenerated after†:
6 mos.
9 mos.
Removed
body
portion
3 mos.
1 yr.
Outer arm
Arm +
1/5 body
2 arms +
1/3 body
0
0
0
0
0
8
0
20
# of
starfish
dead after
9 mos.
25
3
0
2
13
22
2
38.
Asterias rubens are often found in very deep water.
Asterias rubens can regenerate limbs lost due to
attack by other marine animals.
The population of Asterias rubens would probably
increase if body parts were broken off.
I only
III only
II and III only
I, II, and III
The first group of starfish was used in Experiment 1:
F. as a control to see how many starfish were likely to
die under the conditions of the experiment.
G. as a control for the second experiment.
275
GO ON TO THE NEXT PAGE.
4 6 6 6 6 6 6 6 6 6 6 4
H. to test the natural recuperative powers of Asterias
rubens.
J. to determine the effect of a fresh water environment
on Asterias rubens.
D. some of the starfish were alive but not fully
regenerated.
40.
39.
In Experiment 2, the sum of fully regrown and dead
starfish after one year did not always equal 25. The
hypothesis which best explains this is that:
Starfish prey on abalone. At one time it was common
practice for abalone fishermen to chop starfish into
pieces and throw them back into the ocean. What was
the most probable result of this practice?
F. The starfish population immediately skyrocketed.
G. The starfish population increased over a period of
time as some pieces underwent regeneration.
H. The starfish population decreased drastically.
J. Every piece that was returned to the ocean
eventually became a complete starfish again.
A. some of the starfish were lost during the
experiment.
B. the researchers miscalculated somewhere during
the course of the experiment.
C. some body parts fused together to form single
starfish.
276
STOP! END OF SECTION 4!
DO NOT TURN TO ANY OTHER SECTION!