SCIENCE REASONING TEST 18 Minutes — 18 Questions pps
Bạn đang xem bản rút gọn của tài liệu. Xem và tải ngay bản đầy đủ của tài liệu tại đây (23.73 KB, 7 trang )
4 ● ● ● ● ● ● 4
210 GO ON TO THE NEXT PAGE.
SCIENCE REASONING TEST
18 Minutes — 18 Questions
Directions: There are three passages in this test. Each
passage is followed by several questions. After reading a
passage, choose the best answer to each question and fill in the
corresponding oval on your answer sheet. You may refer to the
passages as often as necessary.
Passage I
A series of experiments was performed to study the
environmental factors affecting the size and number of
leaves on the Cyas plant.
Experiment 1
Five groups of 25 Cyas seedlings, all from 2–3 cm
tall, were allowed to grow for 3 months, each group at a
different humidity level. All of the groups were kept at 75°
F and received 9 hours of sunlight a day. The average leaf
lengths, widths, and densities are given in Table 1.
Table 1
%
Humidity
Average
length
(cm)
Average
width
(cm)
Average
density*
(leaves/cm)
15
35
55
75
95
5.6
7.1
9.8
14.6
7.5
1.6
1.8
2.0
2.6
1.7
0.13
0.25
0.56
0.61
0.52
*Number of leaves per 1 cm of plant stalk
Experiment 2
Five new groups of 25 seedlings, all from 2–3 cm tall,
were allowed to grow for 3 months, each group receiving
different amounts of sunlight at a constant humidity of
55%. All other conditions were the same as in Experiment
1. The results are listed in Table 2.
Table 2
Sunlight
(hrs./day)
Average
length
(cm)
Average
width
(cm)
Average
density*
(leaves/cm)
0
3
6
9
12
5.3
12.4
11.2
8.4
7.7
1.5
2.4
2.0
1.8
1.7
0.32
0.59
0.56
0.26
0.19
*Number of leaves per 1 cm of plant stalk
Experiment 3
Five new groups of 25 seedlings, as above, were
allowed to grow at a constant humidity of 55% for 3
months at different daytime and nighttime temperatures.
All other conditions were the same as in Experiment 1.
The results are shown in the following table.
Table 3
Day/Night
Temperature
(˚F)
Average
length
(cm)
Average
width
(cm)
Average
density*
(leaves/cm)
85/85
85/65
65/85
75/75
65/65
6.8
12.3
8.1
7.1
8.3
1.5
2.1
1.7
1.9
1.7
0.28
0.53
0.33
0.45
0.39
*Number of leaves per 1 cm of plant stalk
4 ● ● ● ● ● ● 4
211 GO ON TO THE NEXT PAGE.
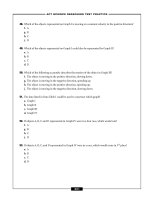
1. Which of the following conclusions can be made
based on the results of Experiment 2 alone?
A. The seedlings do not require long daily periods of
sunlight.
B. The average leaf density is independent of the
humidity the seedlings receive.
C. The seedlings need more water at night than during
the day.
D. The average length of the leaves increases as the
amount of sunlight increases.
2. Seedlings grown at a 40% humidity level under the
same conditions as in Experiment 1 would have
average leaf widths closest to:
F. 1.6 cm.
G. 1.9 cm.
H. 2.2 cm.
J. 2.5 cm.
3. According to the experimental results, under which
set of conditions would a Cyas seedling be most
likely to produce the largest leaves?
A. 95% humidity and 3 hours of sunlight
B. 75% humidity and 3 hours of sunlight
C. 95% humidity and 6 hours of sunlight
D. 75% humidity and 6 hours of sunlight
4. According to the results given, Cyas plants are
LEAST likely to flourish:
F. in deserts.
G. in temperate grasslands.
H. in tropical jungles.
J. at high altitudes.
5. It was assumed in the design of the 3 experiments
that all of the Cyas seedlings were:
A. more than 5 cm tall.
B. equally capable of germinating.
C. equally capable of producing flowers.
D. equally capable of further growth.
6. As a continuation of the 3 experiments listed, it would
be appropriate to next investigate:
F. how many leaves over 6.0 cm long there are on
each plant.
G. which animals consume Cyas seedlings.
H. how the mineral content of the soil affects the leaf
size and density.
J. what time of year the seedlings have the darkest
coloring.
4 ● ● ● ● ● ● 4
212 GO ON TO THE NEXT PAGE.
Passage II
While the focus (point of origin) of most earthquakes
lies less than 20 km below the Earth’s surface, certain
unusual seismographic readings indicate that some activity
originates at considerably greater depths. Below, two
scientists discuss the possible causes of deep-focus
earthquakes.
Scientist 1
Surface earthquakes occur when rock in the Earth’s
crust fractures to relieve stress. However, below 50 km,
rock is under too much pressure to fracture normally.
Deep-focus earthquakes are caused by the pressure of fluids
trapped in the Earth’s tectonic plates. As a plate is forced
down into the mantle by convection, increases in
temperature and pressure cause changes in the crystalline
structure of minerals such as serpentine. In adopting a
denser configuration, the crystals dehydrate, releasing water.
Other sources of fluid include water trapped in pockets of
deep sea trenches and carried down with the plates.
Laboratory work has shown that fluids trapped in rock pores
can cause rock to fail at lower shear stresses. In fact, at the
Rocky Mountain Arsenal, the injection of fluid wastes into
the Earth accidentally induced a series of shallow-focus
earthquakes.
Scientist 2
Deep-focus earthquakes cannot result from normal
fractures, because rock becomes ductile at the temperatures
and pressures that exist at depths greater than 50 km.
Furthermore, mantle rock below 300 km is probably totally
dehydrated because of the extreme pressure. Therefore,
trapped fluids could not cause quakes below that depth. A
better explanation is that deep-focus quakes result from the
slippage that occurs when rock in a descending tectonic
plate undergoes a phase change in its crystalline structure
along a thin plane parallel to a stress. Just such a phase
change and resultant slippage can be produced in the
laboratory by compressing a slab of calcium magnesium
silicate. The pattern of deep-quake activity supports this
theory. In most seismic zones, the recorded incidence of
deep-focus earthquakes corresponds to the depths at which
phase changes are predicted to occur in mantle rock. For
example, little or no phase change is thought to occur at
400 km, and indeed, earthquake activity at this level is
negligible. Between 400 and 680 km, activity once again
increases. Although seismologists initially believed that
earthquakes could be generated at depths as low as 1,080 or
1,200 km, no foci have been confirmed below 700 km. No
phase changes are predicted for mantle rock below 680 km.
7. Scientists 1 and 2 agree on which point?
A. Deep-earthquake activity does not occur below 400
km.
B. Fluid allows tectonic plates to slip past one
another.
C. Water can penetrate mantle rock.
D. Rock below 50 km will not fracture normally.
8. The graph below shows the pressures that exist at
various depths below the Earth’s surface. According
to Scientist 2, which point might represent the focus
of a deep earthquake?
0.0 0.1 0.2 0.430.
pressure (10 dynes/cm )
12
2
transition
zone to
lower
mantle
upper
mantle
crust
M
N
O
P
1000
200
900
800
700
600
500
400
300
100
0
F. M
G. N
H. O
J. P
4 ● ● ● ● ● ● 4
213 GO ON TO THE NEXT PAGE.
9. Which of the following is evidence that would
support Scientist 1’s hypothesis?
A. The discovery that water can be extracted from
mantle-like rock at temperatures and pressures
similar to those found below 300 km.
B. Seismographic indications that earthquakes occur
300 km below the surface of the Earth.
C. The discovery that phase changes occur in the
mantle rock at depths of 1,080 km.
D. An earthquake underneath Los Angeles that was
shown to have been caused by water trapped in
sewer lines.
10. Both scientists assume that:
F. deep-focus earthquakes are more common than
surface earthquakes.
G. trapped fluids cause surface earthquakes.
H. the Earth’s crust is composed of mobile tectonic
plates.
J. deep-focus earthquakes cannot be felt on the
Earth’s crust without special recording devices.
11. To best refute Scientist 2’s hypothesis, Scientist 1
might:
A. find evidence of other sources of underground
water.
B. record a deep-focus earthquake below 680 km.
C. find a substance that doesn’t undergo phase
changes even at depths equivalent to 680 km.
D. show that rock becomes ductile at depths of less
than 50 km.
12. According to Scientist 1, the earthquake at Rocky
Mountain Arsenal occurred because:
F. serpentine or other minerals dehydrated and released
water.
G. fluid wastes injected into the Earth compressed a
thin slab of calcium magnesium silicate.
H. fluid wastes injected into the Earth flooded the
remains of a deep-sea trench.
J. fluid wastes injected into the Earth lowered the
shear stress failure point of the rock.
13. Scientist 2’s hypothesis would be strengthened by
evidence showing that:
A. water evaporates at high temperatures and
pressures.
B. deep-focus earthquakes can occur at 680 km.
C. stress has the same effect on mantle rock that it
has on calcium magnesium silicate.
D. water pockets exist at depths below 300 km.
4 ● ● ● ● ● ● 4
214 GO ON TO THE NEXT PAGE.
Passage III
The resistance (R) of a conductor is the extent to which
it opposes the flow of electricity. Resistance depends not
only on the conductor’s resistivity (r), but also on the
conductor’s length (L) and cross-sectional area (A). The
resistivity of a conductor is a physical property of the
material which varies with temperature.
A research team designing a new appliance had to
decide what type of wire to use in a particular circuit. The
most important consideration was the wire’s resistance.
The team studied the resistance of wires made from four
metals — gold (Au), aluminum (Al), tungsten (W), and
iron (Fe). Two lengths and two gauges (diameters) of each
type of wire were tested at 20° C. The results are recorded
in the table below.
10-gauge wire
A=5.26mm
2
16-gauge wire
A=1.31mm
2
2.59mm 1.29mm
Note
: Area of a circle = πr
2
Material Resistivity Length Cross- Resistance
(mW ◊ cm) (cm) sectional (mW)
area
(mm
2
)
Au 2.44 1.0 5.26 46.4
Au 2.44 1.0 1.31 186.0
Au 2.44 2.0 5.26 92.8
Au 2.44 2.0 1.31 372.0
Al 2.83 1.0 5.26 53.8
Al 2.83 1.0 1.31 216.0
Al 2.83 2.0 5.26 107.6
Al 2.83 2.0 1.31 432.0
W 5.51 1.0 5.26 105.0
W 5.51 1.0 1.31 421.0
W 5.51 2.0 5.26 210.0
W 5.51 2.0 1.31 842.0
Fe 10.00 1.0 5.26 190.0
Fe 10.00 1.0 1.31 764.0
Fe 10.00 2.0 5.26 380.0
Fe 10.00 2.0 1.31 1,528.0
14. Of the wires tested, resistance increases for any given
material as which parameter is decreased?
F. Length
G. Cross-sectional area
H. Resistivity
J. Gauge
15. Given the data in the table, which of the following
best expresses resistance in terms of resistivity, cross-
sectional area, and length?
A.
A
L
B.
L
A
C.
AL
D.
AL
16. Which of the following wires would have the highest
resistance?
F. A 1-cm aluminum wire with a cross-sectional area
of 3.31 mm
2
G. A 2-cm aluminum wire with a cross-sectional area
of 3.31 mm
2
H. A 1-cm tungsten wire with a cross-sectional area
of 0.33 mm
2
J. A 2-cm tungsten wire with a cross-sectional area
of 0.33 mm
2
17. According to the information given, which of the
following statements is (are) correct?
I. 10-gauge wire has a larger diameter than 16-gauge
wire.
II. Gold has a higher resistivity than tungsten.
III. Aluminum conducts electricity better than iron.
A. I only
B. II only
C. III only
D. I and III only
4 ● ● ● ● ● ● 4
215 GO ON TO THE NEXT PAGE.
4 ● ● ● ● ● ● 4
STOP! END OF SECTION 4
DO NOT TURN TO ANY OTHER SECTION.
216
18. Which of the following graphs best represents the
relationship between the resistivity ( ) of a tungsten
wire and its length?
F.
L
G.
L
H.
L
J.
L