Springer Old Growth Forests - Chapter 4 ppt
Bạn đang xem bản rút gọn của tài liệu. Xem và tải ngay bản đầy đủ của tài liệu tại đây (409.9 KB, 23 trang )
Chapter 4
Ecophysiological Characteristics
of Mature Trees and Stands – Consequences
for Old-Growth Forest Productivity
Werner L. Kutsch, Christian Wirth, Jens Kattge, Stefanie Nollert,
Matthias Herbst, and Ludger Kappen
4.1 Introduction
Trees increase their relative fitness to competing trees or to other life forms both
directly and indirectly, by growing tall, as increased light interception increases
photosynthesis (direct) and simultaneous ly making this resource u navailable to
competitors (indirect). Consequently, trees that grow taller, larger, or have
greater shading power may domi nate smaller trees with less shading power.
However, as trees become older and grow taller they face constraints that differ
drastically from those experienced by smaller species or early ontogenetic
stages. Falster and Westoby (2003), who used game-theoretic models to learn
about the evolutionary background of tree height, summarised thus: ‘height
increases costs as past investment in stems for support, as continuing maintenance
costs for the ste ms and vasculature, as disadvantages in the transport of water to
height and as increased risk of breakage’. No wonder that trees do not grow
infinitely high. In general, absolute and relative growth rates tend to decrease
with age and height. This decline in productivity observed at both the tree and
stand level has been attributed to a range of processes, e.g., increasing
respiratory demand and limitation of photosynthesis on the tree level, and, on
the stand level, increasing sequestration of nutrients in slow-decomposing litter
and ecophysiological differences between early-, mid- and late-successional
canopies. This chapter will review these current hypotheses, first on the tree
level, then the stand level, as well as in the context of successional changes of
community composition.
4.2 Increased Respiratory Demand
A widespread hypothesis about the decrease in growth with tree age is based on the
idea that higher respiratory demand limits resources for wood growth. Kira and
Shidei (1967) first developed this hypothesis from empirical data over 10 years. It
C. Wirth et al. (eds.), Old‐Growth Forests, Ecological Studies, 207 57
DOI: 10.1007/978‐3‐540‐92706‐8 4,
#
Springer‐Verlag Berlin Heidelberg 2009
became well accepted that forest produc tion declines with age because woody
respiration increases while gross primary productivity (GPP) remains constant or
even decreases slightly. This idea was adopted by Odum (1969) in his well-known
theory of ecosystem succession, which predicts that ecosystem respiration increases
with community age and balances a slightly decreasing GPP until the difference
approaches zero at steady state.
The net carbon yield of a tree depends on the ratio of assimilating organs to
that of respiring tissues. Old and tall trees usually have a leaf-to-mass ratio
(LMR = leaf mass per total tree biomass) of between 5% and 20%, with the
remaining biomass in the stem, branches, and roots (Bernoulli and Ko
¨
rner 1999).
The cost for maintaining these non-productive tissues may increase when trees
grow taller. Especially for trees growing at high elevation, Wieser et al. (2005) have
argued that, besides low temperatures and a short vegetation period, an imbalance
in carbon-accumulating foliage versus respiring tissues might upset the carbon
balance (see also Ha
¨
ttenschwiler et al. 2002). However, even though integrative
studies have shown that the fraction of net photosynthetic production consumed
by autotrophic respiration can vary between 30% and 70% (Sprugel et al. 1995;
Luyssaert et al. 2007), no significant age effects on this ratio were reve aled. The
reason for this might be a decrease in activity (bioma ss-specific respiration rate) of
accumulated woody tissue. Such observations oppose the traditional view that tree
production decreases with age due to increasing respiratory demand. Moreover,
several more studies have shown that a decrease in net primary productivity in
old-growth forests if it occurs is related more to decreasing photosynthesis in
old and tall trees (as well as in old-growth forest canopies) than to increasing
respiratory demand (Ryan and Yoder 1997).
4.3 Limitations of Photosynthesis
The mechanisms that could lead to decreased photosynthetic income in high trees
and old-growth forests are still unclear. The widespread hypothesis of hydraulic
limitation will be discusse d in the first part of this chapter. This more source-related
mechanism will then be compared to the more sink-related mechanisms that have
been introduced recently. At the end of the chapter we will return to the reduction of
photosynthesis in the context of community composition, as late-successional
species may show an imperfect acclimatisation to full sunlight.
4.3.1 Hydraulic Limitation
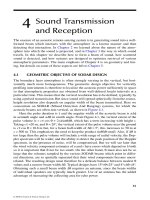
The basic assumption of the hydraulic limitation hypothesis (HLH) is that, as
trees grow taller, gravitational potential, which increases by 0.01 MPa per metre of
height (Fig. 4.1), and increased path length decrease leaf water pote ntial (Fig. 4.2a)
58 W.L. Kutsch et al.
Fig. 4.1 The hydraulic
limitation hypothesis (HLH)
proposes decreased leaf
specific hydraulic
conductance as trees grow in
height. The figure shows the
increase in gravitational
potential with tree height.
Trees have to overcome this
potential to transport water to
the leaves.
Fig. 4.2 a Xylem pressure of small branches measured at predawn (upper group) and midday
(lower group) of redwood trees at Humboldt Redwoods State Park, California during September
and October 2000. b Foliar carbon isotope composition (d
13
C) of redwood trees at Humboldt
Redwoods State Park, California increases with height within the crowns of 5 trees over 110 m tall,
and among the tops (filled circles) of 16 trees from 85 to 113 m tall. Different symbol types denote
different trees and are consistent in a and b (from Koch et al. 2004, with permission).
4 Ecophysiological Characteristics of Mature Trees 59
and, consequently, stomatal conductance. Promoters of the HLH usually employ a
simplified Ohm’s law analogy (Tyree and Ewers 1991) to provide a mathematical
description of differences in stomatal conductance with height:
G
C
¼
K
L
Á DC
D
4:1
where G
C
= canopy conductance for water vapour, K
L
= hydraulic conductance
from soil to leaf, DC = soil-to-leaf water potential difference, and D=leaf to air
saturation deficit. Since decreased stomatal conductance reduces photosynthetic
uptake, Ryan and Yoder (1997) proposed the HLH as a mechanism to explain the
slowing of height growth with tree size and the maximum limits to tree height.
Barnard (2003) and Ryan et al. (2004) refined the HLH and stated that five
necessary components have to be fulfilled: ‘(1) stomata must close to maintain
C
LEAF
above a minimum, critical threshold and this threshold must be the same for
all tree heights; (2) stomata must close in response to decreased hydraulic conduc-
tance; (3) hydraulic conductance must decrease with tree height; (4) stomatal
closure promoted by reduced hydraulic conductance must cause lower photo syn-
thesis; and (5) reduction in photosynthesis in older, taller trees must be sufficient to
account for reduced growth.’ The HLH has been widely discussed and has insp ired
a huge number of studies on tall trees during the past decade.
4.3.1.1 Empirical Evidence for the Hydraulic Limitation Hypothesis
4.3.1.1.1 Calculation of Hydraulic Conductance
The hydraulic conductance can be calculated either for a single leaf in a certain
position in a tree or for the whole tree. In the first case , the hydraulic conductance is
related to the insertion height of the leaf, in the second to the total height of the tree.
In both cases the hydraulic conductance is related to the leaf area.
For a single leaf, the specific hydraulic conductance can be calculated from the
following equation:
k
I
¼
E
I
C
soil
À pgh À C
leaf
4:2
where E
l
is the transpiration ; C
leaf
and C
soil
are leaf and soil water potential,
respectively; r is the water density; g the acceleration due to gravity (9.81 ms
2
);
and h the insertion height of the leaf (m). E
l
can be regulated by stomatal aperture.
In order to compensate for the gravitational component, the leaf has to decrease its
potential by the value of rgh. Gradients of leaf water potential with tree height were
indeed found in several studies (Waring and McDowell 2002; Koch et al. 2004).
60 W.L. Kutsch et al.
Predawn measurements of C
leaf
during periods with high soil moisture reflect
the gravitational potential very well (Koch et al. 2004), and therefore can be used to
partition total water potential into ‘gravitational’ and ‘non-gravitational’ fractions
(Waring and McDowell 2002; McDowell et al. 2002a, 2002b, 2005; Delzon et al.
2004). Correcting C
leaf
for the gravitational component (C
e
leaf
, according to Delzon
et al. 2004) allows direct calculation of DC between soil and leaf and in
combination with transpiration measurements of k
l
. Whole tree hydraulic con-
ductance (K
L
) is usually estimated by relating sap flow measurements to water
potential (e.g. Hubbard et al. 1999). Delzon et al. (2004) measured sap flow about 1 m
below the live crown, and C
leaf
on leaves in the upper crown. Several studies have
shown that K
L
decreases as trees grow taller and age (Hubbard et al. 1999; Delzon
et al. 2004).
4.3.1.1.2 Gas Exchange
Direct measurements of leaf gas exchange by means of infrared gas analysers with
leaf-scale cuvettes may support the HLH if lower values of leaf net photosynthesis
(A) and stomatal conductance (g
s
) are associated with lower values of k
l
. In most
cases, neither photosynthetic capacity (A
max
) nor leaf or needle nitrogen was
reduced but increased stomatal closure caused a more sensitive response of A to
reduced air humidity at greater heights in at least some studies (Yoder et al. 1994;
Hubbard et al. 1999; McDowell et al. 2005). A decrease in stomatal conductance or
increased stomatal sensitivity with height, which was also observed by Delzon et al.
(2004), is commonly interpreted as a result of reduced hydraulic conductance.
4.3.1.1.3 Stable Isotopes
Another approach utilises the stable carbon isotope ratio (d
13
C) of foliage, which is
closely related to leaf gas exchange (Farquhar et al. 1989; Ehleringer et al. 2002).
The discrimination against
13
CO
2
by the CO
2
-fixing enzyme increases with the
leaf-internal CO
2
concentration. In conditions of low stomatal conductance the
leaf-internal CO
2
concentration is reduced and, consequently, the d
13
C of assim-
ilates is enhanced (Meinzer 1993; Flanagan and Ehleringer 1998). Accordingly, an
increase in foliage d
13
C with tree size for indi viduals of the same species grown in
similar environments (Fig. 4.2b) can be related to hydraulic constraints to gas
exchange, and has been observed in many studies (Yoder et al. 1994; Hubbard
et al. 1999; Waring and McDowell 2002; Phillips et al. 2003; Koch et al. 2004;
McDowell et al. 2005; Schoettle 1994).
Overall, the results from these approaches indicates that height, and the resulting
gravimetrical and hydraulic strain can burden photosynthetic uptake and possibly
further growth of old and tall trees. However, it remains unclear whether hydraulic
limitation is exclusively the reason for growth cessation in trees, in particular in trees
that remain shorter than the theoretically calculated maximum tree height of about 120
m (Koch et al. 2004). Therefore, several reservations about the HLH have been
formulated.
4 Ecophysiological Characteristics of Mature Trees 61
4.3.1.2 Reservations Against the Hydraulic Limitation Hypothesis
The most important argument against the HLH is the fact that trees can compensate
for increased path length by changes in xylem structure, such as the production of
xylem vessels with increased conductivity (Pothier et al. 1989). Xylem architecture
varies betwee n species and is very plastic within species or even within a single
tree. Weitz et al. (2006) claimed that there is a general trend of tapering of conduit
dimensions that might be regulated by a hormonal signal originating in the apices
of tree branches. However, they described single vessel dimensions, whereas
Mencuccini and Grace (1996) , who worked on whole trees, reported a proportional
increase of branch over stem wood sapflow area with age in Scots Pine, which can
also be seen at least partially as hydraulic compensation. The formal hydraulic
model of Whitehead et al. (1984) predicts compensation by a homeostatic balance
between transport capacity and transpiration demand. Consequently, it was argued
by Becker et al. (2000), that ‘any path-length effects on water transport could be
fully compensated if this was advantageous to the plant’.
Another way of compensation is to decrease transpiring leaf area relative to
xylem conductive area with height (Vanninen et al. 1996). Cochard et al. (1997)
found for Fraxinus excelsior L., that the xylem resistance of single branches was
correlated to their leaf area, thus keeping the leaf-area-specific conductivity con-
stant. Several other studies showed adaptations in the leaf area to sapwood area
ratio (A
L
:A
S
) in order to compensate for hydraulic or gravitational limitation
(Waring and McDowell 2002; Delzon et al. 2004; McDowell et al. 2005) which
results in a decrease in productivity, but on a whole plant or stand level.
Furthermore, trees can compensate by increasing the fine-root:foliage ratio
(Sperry et al. 1998; Magnani et al. 2000) or by decreasing the minimum leaf
water potential and consequently increasing the water potential gradient between
soil and leaf (Hacke et al. 2000). In addition, a role in increased water storage in the
stem for compensation is discussed (Phillips et al. 2003). Nevertheless, all these
compensating reactions of tall trees are not ‘for free’ but are paid for by increased
respiration costs.
4.3.2 Reduced Sink Strength
An alternative to the HLH and other theori es that support source regulation, reduc-
tion of photosynthesis may also be induced by product inhibition of photosynthates.
This kind of sink regulation can be explained by at least two mechanisms:
(1) Phloem transport may be reduced in tall trees because the resistance between
source and sink also increases with distance. In-vivo whole-plant measurements
have demonstrated that carbon flow rates are dependent not only on the proper-
ties of the sink, but also on the properties of the whole transport system (Gould
et al. 2004; Minchin and Lacointe 2005).
62 W.L. Kutsch et al.
(2) There is some evidence that old and tall trees cease later growth genetically.
Given the fact that genetic programs were generated ov er thousands of genera-
tions, the cessation of height growth in old trees may be explained by the
development of several mechanisms inducing a high risk/advantage-ratio
when trees grow taller. The advantage is high-light supply for the highest
trees, whereas the risks comprise mechanical damage due to windthrow or
snowbreak, or climat ic damage by frost or desiccation. As soon as a tree has
grown taller than its neighbours, these risks will excee d the advantages of
growing even taller. Understanding the evolution of height growth of trees in
terms of risk (or cost)-to-advantage assessment in an uncooperative game
(Falster and Westoby 2003), results in a high probability of genetic cessation
of height growth and resulting sink reduction.
It is well known from leaf-level measurements that a reduction in sink strength
results in an increase in starch and soluble sugars within the leaves followed by
down-regulation of photosynthetic capacity (Equiza et al. 2006). Hoch et al. (2003)
and Ko
¨
rner et al. (2005) showed that whole trees also exhibit high concentrations of
storage carbohydrates, which suggests that growth is limited by the availability of
sinks but not carbon supply (Day et al. 2001, 2002). Whether this lack of growth
stimulus is related to an intrinsic genetic programme or progressive nutrient
limitation is not known. The strong growth response of mature forests towards
atmospheric nitrogen deposition in Europe may indicate the latter (Schulze 2000;
Mund et al. 2002; Magnani et al. 2007).
4.4 Stand-Level Controls
Irrespective of the underlying mechanism, old and tall trees eventually reach a point
where they become less efficient in assimilating carbon for growth per unit leaf
area. To what extent this physiological response translates into individual-level
growth performanc e, and eventually into stand-level decline in productivity, is still
subject to debate (Gower et al. 1996; Ryan et al. 1997; Magnani et al. 2000; Weiner
and Thomas 2001; Binkley et al. 2002). As pointed out in a seminal review by Ryan
et al. (1997), stand-level net primary production could theoretically decline because
of (1) a decline in assimilation rate at a given leaf area, or (2) a decline in total leaf
area at a given assimilation rate. In the first case, the decline is driven purely by
physiological changes (see above); in the latter purely by structural changes of the
canopy, e.g. resulting from leaf abrasion or tree mortality. The 13 chronosequences
presented by Ryan et al. (1997) clearly exhibited age-related decline of productivity
at the stand-level. Stem growth peaked at the time of maximum leaf area, which, in
this case, was after 29 Æ 22 (SD) years. It is important to note that this very early
onset of observed growth reduction rules out the notion that a physiological reaction
to ‘majestic’ size or high age is the major driver of the stand-level decline in
productivity sensu Ryan et al. (1997). In at least some chronosequences there was
a post-peak decline in growth efficiency (i.e. stem-growth per unit leaf area), which
4 Ecophysiological Characteristics of Mature Trees 63
is why the authors argued that age-related decline results from both structural and
physiological changes. However, the chosen chronosequences were by no means
representative of the world’s forests; all were even-aged monocultures, most of
them were managed, and there was a strong bias towards shade-intolerant conifer-
ous pioneers. These grow up quickly in a monolayer and respond strongly to
crowding by down-regulating the sta nd-level leaf area. With productivity being
closely related to leaf area index (LAI), the productivity peak may thus merely
reflect the ‘over-shooting’ leaf area prior to the onset of self-thinning.
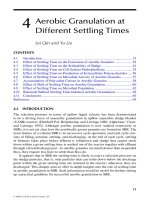
Recently, a new global database of forest productivity that comprises data from
both chron osequences and individual stands has become available (Luyssaert et al.
2007). In addition to stand-level estimates of net primary productivity, the database
contains details on the methodology, and a wide range of site descriptors that can be
used as covariates or to filter and stratify the data. We used the database to model
the aboveground and total net primary productivity (abbreviated ANPP and total
NPP, respectively) as a linear function of LAI and stand age per se, thus separating
physiological and structural eff ects. Because productivity and age are often
confounded with site variables (stands become older on sites with more adverse
growing conditions), we included two climate variables, mean annual temperature
and annual precipitation, as additional predictors. All predictor variables were
standardised to a mean of zero and a standard deviation of one. With this transfor-
mation, the intercept of the models is the productivity at the means of all predictors,
and the absolute values of the coefficients reflect the explanatory strength of the
respective predictors. For model simplification, we applied backward selection
based on the Akaike Information Criterion. The best candidate models are pre-
sented in Table 4.1. The analysis was done separately for coniferous and broad-
leaved forests of the northern hemisphere. Mixed stands and stands subject to
fertilisation or irrigation were excluded.
All four variables were significant predictors of ANPP in conifers. ANPP at the
covariate means was 324 g C m
2
year
1
. Temperature had the strongest influence,
followed by LAI (Fig. 4.3a) and precipitation. The negative effect of stand age,
which was significant (at a = 0.05) but relatively weak, indicated a slight
decline in aboveground growth efficiency with age. In original units, this translates
to 30 g C m
2
year
1
in 100 years. In comparison with ANPP, the total NPP was 1.6
times higher (intercepts 324 and 510 g C m
2
year
1
, respectively) and the four
variables explained a higher fraction of the variance in total NPP (adjusted R
2
=
0.50 and 0.74, respectively). The importance of predictors decreased in the same
order (temperature > LAI > precipitation > age, Fig. 4.3b again shows LAI as an
indicator of ANPP). The similarity of the models for ANPP and NPP suggest that
shifts in allocation from above- to below-ground NPP are of little relevance. For
broadleaved forests, stand age was not a significant predictor of ANPP. The overall
level of ANPP as reflected by the intercept was 506 g C m
2
year
1
and thus higher
than in coniferous forests. The ‘minim um model’ contained only LAI and precipi-
tation as predictors; the latter was not significant. The minimum model for total
NPP was structurally similar, but the influence of precipitation was significant and
the intercept was 1.35 times higher. The lower ratio of total to aboveground NPP
64 W.L. Kutsch et al.
illustrates that broadleaved forests allocate less carbon to belowground productivity
than coniferous forests, which dominate under harsher (drier, colder) growing
conditions. In summary, differences in ANPP and NPP when controlled for
climate were driven mostly by leaf area. This result suggests that structural
changes leading to reduced displays of leaf area are more important than a deterio-
ration in photosynthetic performance.
4.5 Community and Ecosystem Constraints
on Age/Size-Productivity Relationships
Thus far we have been discussing the ecophysiological consequence s of tree stature
and age. Besides these two aspects of being a tall tree, major drivers of productivity,
such as light, nutrient and water availability, may change significantly and predict-
ably throughout the development of a single tree. Another aspect is that secondary
successions usually involve species turnover, which in turn introduces a shift in the
spectrum of relevant ecophysiological and morphological traits. In the following,
we discuss these two aspects in more detail.
Table 4.1 Coefficients, significance level and indicators of model performance for the statistical
analysis of aboveground and total net primary productivity (ANPP and NPP, respectively).
Because all predictors were z transformed prior to analysis, the absolute magnitude of the
coefficients is indicative of their relative importance. df Degrees of freedom, Std.err standard
error, p probability that coefficient equals zero, LAI leaf area index, P precipitation sum, T mean
annual temperature, Age stand age
Parameter Std.err t Value p Parameter Std.err t Value p
ANPP Coniferous forests Deciduous forests
Intercept 324.8 11.7 27.63 <0.001 506.8 21.2 23.9 <0.001
LAI 99.7 13.8 7.25 <0.001 93.1 21.6 4.3 <0.001
P 81.9 17.1 4.79 <0.001 32.9 21.6 1.5 0.131
T 137.4 16.5 8.33 <0.001
Age 35.5 12.0 2.96 0.0035
df 168 76
Residual 154.6 188.2
Adjusted
R
2
0.510 0.216
NPP Coniferous forests Deciduous forests
Intercept 510.94 15.30 33.38 <0.001 697.9 25.2 27.7 <0.001
LAI 176.26 18.28 9.64 <0.001 97.7 25.7 3.8 <0.001
P 55.39 25.92 2.14 0.0348 93.0 25.7 3.5 <0.001
T 198.80 23.87 8.33 <0.001
Age 43.68 16.00 2.73 0.0075
df 109 75
Residual 163.4 222.4
Adjusted
R
2
0.7385 0.287
4 Ecophysiological Characteristics of Mature Trees 65
Fig. 4.3 Relationship between aboveground primary productivity (ANPP; g C m
À2
year
À1
) and
leaf area index (LAI; m
2
m
À2
) for coniferous (a) and deciduous (b) forests of the temperate and
boreal biome. The symbols denote stand age classes: open circles 1 100 years, open triangles
101 200 years, filled circles 201 400 years, filled triangles >400 years. The size of the symbols is
proportional to the mean annual temperature (without scale)
66 W.L. Kutsch et al.
4.5.1 Light, Water and Nutrient Availability
In the struggle for light, trees have developed different strategies. Light-demanding
pioneer species arrive early after stand-replacing disturbances, establish well, and
grow fast. They dominate the early stages of succession, but are then gradually
overgrown by more shade-tolerant species. Shade-tolerant species usually start
their development in the understorey and reach the canopy after a long period of
suppression. Shade-avoiding gap-phase species take an intermediate position. As a
rule of thumb, size and age at the population level are negatively correlated with
light availability in pione ers and positively correlated in shade-tolerant species. The
sign of the correlation tends to aggravate size-/age-related decline in pioneers, but
mitigates it in shade-tolerant species.
Water availability may also change with size, and the sign of the response varies
with site conditions and root architecture in a predictable fashion. A positive
correlation between individual tree structure and water availability is expected to
emerge when trees protrude through a dry topsoil into subsoi l aquifers by means of
long tap roots (Irvine et al. 2004). A negative correlation usually occurs during
stand development on shallow soils where root competition intensifies with stand
age and biomass, often inducing stagnation of growth (Oliver and Larson 1996).
Post-fire regeneration on permafrost soils represents an extreme example where the
available unfrozen soil volume, the active layer, even shrinks during the course
of stand development. This usually induces a cessation of tree growth after about
60 years in boreal larch and black spruce stands irrespective of tree size (Abaimov
et al. 1997; Abaimov and Sofronov 1996). There are often pronounced changes in
nutrient availability with succession. Most disturbances leave behind soils that are
temporarily enriched in nutrients due to the decomposition of the newly available
dead plant material and also, in the case of fire, thermal mineralisation (Neary et al.
1999). In secondary succession forest, re-growth progressively locks up nutrients
(Vitousek and White 1981; see Chap. 9 by Wardle, this volume). Furthermore, litter
quality, and thus remobilisation of nutrients, decreases as the proportion of woody
litter increases over time. This led Gower et al. (1996) to hypothesise that the so-
called ‘age-related’ decline in forest productivity can be explained by the temporal
dynamics of nutrient availability (cf. Sect. 4.3.2 above). Wardle (Chap. 9, this
volume) discusses additional mechani sms evoking the phenomenon of reduced
nutrient availability in old versus young forests.
4.5.2 Shifts in Ecophysiological Traits with Changes
in Community Composition
Secondary forest succession usually involves species turnover (see Chap. 5 by
Wirth and Lichstein, this volume). In other words, tree species constituting old-
growth stands are not likely to be the same as those that founded the community a
4 Ecophysiological Characteristics of Mature Trees 67
few hundred years ago, and they exhibit a different set of functional traits. Here, we
will concentrate on the ecophysiological and morphological traits known to govern
productivity (shift in demographic traits are discussed in Wirth and Lichstein,
Chap. 5, this volume). Analysis of growth has identified four key traits with
major relevance for productivity (Lambers and Poorter 1992): area-based maximum
photosynthesis rates (A
max,a
), mass-based dark respiration rates (R
d,m
), specific leaf
area (SLA), and relative biomass allocation to leaves (leaf-mass-ratio, LMR). In the
following, we attempt to demonstrate how three of these quantities (A
max,a
, R
d,m
and
SLA) vary with shade-tolerance for temperate and boreal tree species. In this
context, we use shade-tolerance as a proxy for a species’ successional niche.
According to Niinemets and Valladares (2006), a ranking of shade-tolerance (t)
ranges from 1 (=shade intolerant) to 5 (=highly shade tolerant). These rankings
were used to form three guilds: early-successionals (t = 1 or 2), mid-successional
(t = 3), and late-successionals (t = 4 or 5).
The trait data were assembled as part of the FET (functional ecology of trees)
database project (Kattge et al. 2008). The sources for the physiological data are the
same as those used in Kattge et al. (2009) for temperate and boreal tree species. Due
to space limitations, references for the extensive specific leaf area database are not
listed here. We applied the following filter criteria for all variables: Only sun-
exposed leaves under ambient CO
2
concentration from mature trees or saplings, but
not from seedlings, were used; data from measurements in conditioned chambers
were excluded; for one-s ided specific leaf area only data from natural vegetation or
outside sample plots were used. To avoid pseudo-replication, we used the mean
species values per study as the basic observation unit. The statistical analysis
was done in a hierarchical Bayesian framework using the software WinBUGS
(Spiegelhalter et al. 2003). The generic model had the following structure:
log y
ij
e
Nðb
j½i
þ
X
k¼p
k¼1
a
k½i
C
k½i
; s
2
Þ 4:3
where y is the trait variable of observation i from tree species j. The natural
logarithm of y is normally distributed around a mean prediction - defined by the
first term inside the brackets - and vari ance s
2
. Vector C denotes the covariates that
were standardised to a mean of zero and a standard deviation of one prior to the
analysis. Then, the bs become the species -specific (across-study) intercepts at the
means of the k = 1, , p covariates C with their respective coefficients b, which we
assume to be constant across species. This controls for the variability induced by the
numerous covariates, which were light levels and temperature at the time of measure-
ment for A
max,a
, growth temperature prior to and during the measurement for R
d,m
and potential evapotranspiration of the site for SLA. On the next higher level, the
bs per shade-tolerance group are modelled simulta neously in an ANOVA design as
b
j
e
Nðg
ST½j
; s
2
ST
Þ 4:4
68 W.L. Kutsch et al.
where g is the mean value of the three shade-tolerance groups ST. The variance is
allowed to vary between these groups. The posterior distributions of the parameters
b and g were monitored, as well as the pair-wise differences between the g-values.
Two groups are referred to as significantly different when the credible interval of
the monitored differences excludes 0. Unlike a simple step-wise calculation, this
multi-level modelling approach ensures proper error propagation and thus realistic
credible intervals of the differences. The individual data po ints in Fig. 4.4 represent
the back-transformed posterior means of the b-values, and the error bars indicate
the mean and 95% credible interval of the respective g-values. Posterior means,
credible intervals and pair-wise comparisons were calculated only if the number of
species per shade-tolerance group was at least three. In general, the combina tion of
the aggregation strategy (one species per study = one observation in the lower level
model) and the hierarchical statistical approach (one species = one observation in
the higher level model) represents a conservative approach.
For the 41 broad-leaved deciduous tree species (‘broad-leaved’ for short) in our
database we observed a significant decline in the predicted A
max,a
with increasing
shade tolerance, from 11.4 mol CO
2
m
2
s
1
in early-successional to 7.5 mmol
CO
2
m
2
s
1
in late-successional species (Fig. 4.4b). The majority of species
belonged to the early- and mid-successional groups, only five were late-successional,
with Acer saccharum, Acer pensylva nicum, and Fagus sylvatica as dominants and
Cornus florida and Cornus racemosa as typical understorey species. A similar trend
was observed for the 24 conifers, but the picture was less clear (Fig. 4.4a). No
significant differences in A
max,a
between the successional guilds were found. The
data for early-successi onal species were confined to a narrow range between 8 and
10 mmol CO
2
m
2
s
1
, but varied widely in the late-successionals; some studies
revealed rates higher than 11 mol CO
2
m
2
s
1
(Picea abies and Taxus baccata)
while others exhibited rates below 5 mmol CO
2
m
2
s
1
(Abies lasiocarpa and
Picea engelmanni ). Here, we would like to note that the high uncertainty in
estimating the one-sided leaf area of conifers may contribute substantially to the
observed high scatter of A
max,a
data. In general, we observed slightly higher values
of A
max,a
in broad-leaved species than in conifers. Less data are available for
mass-based dark respiration. We observed a non-significant trend of decreasing
respiration rates with increasing shade tolerance from 0.005 to 0.0035 mmol CO
2
g
1
s
1
in conifers (Fig. 4.4c), and from 0.011 to about 0.005 mmol CO
2
g
1
s
1
in
broad-leaved species (Fig. 4.4d). The respiration rates of the latter were twice as
high as those of the conifer species, which is most likely related to differences in
SLA (see below). As expected, SLA was generally higher in broad-leaved species
(Fig. 4.4f). There was no difference between successional guilds within conifers
(Fig. 4.4e); the overall mean of SLA for conifer needles was close to 100 cm
2
g
1
.
The high scatter within the early-successional conifers is due to the presence of the
deciduous genus Larix, with SLA values of around 150 cm
2
g
1
. The broad-leaved
late-successional species had an SLA (230 cm
2
g
1
) that was significantly higher
than both early- and mid-successional species (152 and 163 cm
2
g
1
, respectively).
To summarise, all three traits, A
max,a
, R
d,m
and SLA were higher in broad-leaved
species than in conifers. Broad-leaved species revealed sign ificant differences
4 Ecophysiological Characteristics of Mature Trees 69
Fig. 4.4 Differences in maximum photosynthetic capacity (A
max
), dark respiration rate (R
d
) and
specific leaf area (SLA) for conifers (a, c, e) and broad leaved deciduous tree species (b, d, f). The
species are further grouped into successional guilds according to their shade tolerance scores:
E early successional, M mid successional, L late successional. The individual data points (open
circles) represent posterior means per species and study. A slight random scatter was added to
increase the visibility. The adjacent filled circles represent the posterior mean across species and
studies and the corresponding 95% confidence intervals
70 W.L. Kutsch et al.
between successional guilds because late-successional species had lower A
max,a
and
higher SLA than early-successional species. The data for R
d,m
were insuffici ent, but
suggest lower rates in late-successional species. Similar, but non-significant trends
for A
max,a
and R
d,m
were found for conifers. At this point, we can state that there are
differences between successional guilds, and that typical old-growth species are
likely to have lower A
max,a
and R
d,m
, but higher SLA. Pronounced shifts in mean
trait values are expected if the succession involves a succession from broad-leaved
deciduous to conifers and vice versa. It is difficult to say, however, how these
successional trends translate into differences in growth performance. This compar-
ison is justified if we assume a fixed carbon allocation to leaf biomass. Accordingly,
late-successional broad-leaved trees would be able to produce a higher leaf area
than their early-successional counterparts (higher SLA), but this could be compen-
sated for by lower assimilation rates per unit area. However, if the mass-based dark
respiration rates were taken to be lower, the net carbon gain would be higher in late
successional species. Our findings contradict a similar study on seedlings by
Walters and Reich (1999), who report for broad-leaved winter deciduous trees a
decrease in SLA, no differences in A
max,a
and similar to our findings a decrease
in R
d,m
with increasing shade tolerance. In the latter study, the trait shifts compen-
sated each other such that relative growth rates were similar across the shade-
tolerance gradient, while our results suggest higher growth rates for late-succes-
sional shade-tolerant species of both broad-leaved and coniferous tree species. The
comparison between conifers and broad-leaved deciduous trees needs to take into
account the fact that, due to differences in leaf longevity, foliage biomass is at least
three time s higher in conifers. With the relative differences in SLA (conifer to
broad-leaved ratio 1:1.7), A
max,a
(1:1.25) and foliage biomass (3:1) this translates into
a relative difference in net carbon gain of 1:0.7. This simple calculation suggests that a
successional change from broad-leaved to conifer would therefore induce 40% higher
productivity. This confirms data reported by Schulze et al. (2005) showing that both
GPP and NPP of a spruce forest are higher than in an otherwise comparable beech
forest, although A
max,a
was two times lower in the conifer.
By and large, we may state that species shifts from early- to late-successional
within conifers and broad-leaved species operate against an ‘age-related’ decline
in productivity, as does a change in composition from broad-leaved species to
conifers. This was well illustrated by Carey et al. (2001), who showed for a long-
term chronosequence in the Rocky Mountains that the contribution of
Abies lasiocarpa undergrowth below the pioneering Pinus albicaulis is even
able to increase the overall productivity when the productivity of the pine trees
declines beyond a stand age of 250 years. A succession from coniferous to broad-
leaved trees, however , may result in a combination of ecophysiological traits likely
to exert a lower net productivity. In addition, the common tendency in many
(but not all!) forest successions that species composition shifts towards tree species
with a taller stature and a higher longevity, as discussed in Wirth and Lichtstein
(Chap. 5, this volume), allows the community to progr essively explore more
growing space a phenomenon that, again, operates against a stand-level decline
in productivity.
4 Ecophysiological Characteristics of Mature Trees 71
4.5.3 Imperfect Acclimatisation of Late-Successional to Full
Sunlight: A Case Study on European Beech
(Fagus sylvatica)
Studies on leaf traits of early- and late-successional can describe only general trends
that do not include specific site properties (e.g. nutrient availability) or the changes
in physiology required in order to adapt to changing constraints throughout the
lifetime of a tree. European Beech (Fagus sylvatica), being a typical late-succes-
sional, is an appropriate example to demonstrate these mechanisms. Beech has a
high competitive performance in old-growth forests due to the extremely high
shade tolerance of its seedlings and saplings (Burschel and Huss 1964; Schulze
1970, 1972; Saxe and Kerstiens 2005). Under optimum conditions, beech is able to
out-compete every other tree species during undisturbed succession in many parts
of Europe. Niinemets (2006) emphasises the importance of under standing temporal
changes in leaf traits beyond the seedling stage, because young trees sometimes
have to grow in the deep shade for decades before gap formation occurs. As it is
well known that beech seedlings are sensitive to full sunl ight (e.g. Valladares et al.
2002), the question arises of how old and tall beech trees cope with full sunlight
once they have become the dominating tree species in a forest. Schulze (1970)
found that sun-exposed leaves decrease their chlo rophyll content during sunny
periods and start to senesce as early as the end of July or beginning of August.
More detailed vertical observations of leaf traits through a beech canopy in
northern Germany by Kutsch et al. (2001) indicate the existence of at least three
physiologically different layers in beech canopies. The sun layer according to
Schulze (1970), one homogeneous layer is actually composed of two sub-layers:
the most peripheral part of the crown called Sun-1-layer in this study and a Sun-
2-layer with leaves more inserted into the inner part of the canopy but still receiving
40 60% of the incoming radiation. These leaves of the Sun-2-layer are temporarily
receiving high irradiance but are sheltered from direct sunlight for most of the day. It is
noteworthy that Sun-2-layer leaves have higher photosynthetic capacities and nitro-
gen contents than those of the Sun-1-layer. In contrast, specific leaf weights and
chlorophyll-a/b-ratios are slightly lower than in the Sun-1-layer. A third layer consists
of inner leaves, which receive low light levels. These shaded leaves have, according
to Schulze (1970), typically very low specific leaf weights, chlorophyll-a/b-ratios,
A
max
, and nitrogen contents. Figure 4.5 shows gradients of some leaf properties
through the canopy.
The fact that the leaves of the Sun-2-layer have a fairly high nitrogen content
and high photosynthetic capacity is contrary to the common hypothesis that nitrogen
within single plants and within plant canopies is regulated by relative light
supply, with leaves of highest light supply showing the highest nitrogen content
(Field 1983; Werger and Hirose 1991). Model calculations showed that this pattern
maximises the total photosynthetic income of the canopy (Anten et al. 1995, 1998).
The question arises why beech trees do not allocate the highest amounts of
nitrogen to the most peripheral leaves of the Sun-1-layer. The following observa-
tions may explain this: besides the already discussed early senescence, Sun-1-layer
leaves showed that the stomatal conductance of these leaves was low and gradually
72 W.L. Kutsch et al.
decreasing during the growing season (Kutsch et al. 2001). Since the layers do
not differ very much in height, hydra ulic limitation can be excluded as the reason
for the observed reduction in stomatal conductance in the Sun-1-layer; their
performance must be due to specific microclimatic conditions. It may be inferred
here that the energy budget of a fully sun-exposed leaf results in a higher demand
for transpiration compared to a shaded leaf at the same vapour pressure deficit of the
air (Jarvis 1976). However, when stomata are closed during periods of high irradi-
ance, the incoming energy has to be otherwise dissipated in order to avoid damage
to the foliage. The xanthophyll content is an indicator of the ability of leaves to
dissipate excessive light and protect the photosystems from damage (Bjoerkmann
and Demming-Adams 1995). Xanthophyll (violaxanthin þ antheraxanthin þ zea-
xanthin, henceforth ‘‘VAZ’’) content per unit chlorophyll was lower in Sun-1-
leaves of beech than those of ash or oak leaves of a nearby forest containing two-
to-three times the amount of VAZ per chlorophyll (Fig. 4.5). Consequently, the
low VAZ per chlorophyll of the Sun-1-layer indicates their lower physiological
adaptability to high sun irradiance and also explains their early senescence.
Respecting the decreased acclimation potential to full sun irradiance and the
resulting multiple stress situation of the beech leaves, a high allocation of nitrogen
to the Sun-1-layer could be considered a misinvestment. This hypothesis was tested
by a model study. The goal of this model study was to find out whether the dynamics
of eco-physiological properties throughout the growing season explain the pattern of
nitrogen distribution in European beech. The temporal dynamic of A
max,a
in the
model runs was followed according to field measurements that show ed that Sun-
1-layer leaves lost their photosynthetic capacity due to senescence much earlier
than those of the Sun-2-layer (Figs. 4.6, 4.7a). Also, the increase in sensit ivity of the
Fig. 4.5 Vertical distribution of leaf properties in a Beech canopy in the Bornho
¨
ved Lake district
in northern Germany. Left panel Leaf nitrogen content, area related photosynthetic capacity
(A
max,a
) and chlorophyll per nitrogen content for three layers. Data are mean values of four leaf
samples per layer that were taken during a sunny period in July 1999. The right part shows the
continuous decrease of the xantophyll content (violaxanthin + antheraxanthin + zeaxanthin, VAZ)
from the top inside the canopy. Data are mean values of three leaf samples per layer taken
following a sunny period on 4 August 1999
4 Ecophysiological Characteristics of Mature Trees 73
Fig. 4.6 Annual courses for the years 1999 and 2000 of photosynthetic capacity (A
max,a
) for
different layers within a Beech canopy in the Bornho
¨
ved Lake district in northern Germany. Data
points were derived weekly from continuous field measurements
Fig. 4.7 Annual courses of photosynthetic capacity, A
max,a
, and coefficient c describing stomatal
sensitivity to leaf air vapour pressure deficit (VPD) (Kutsch et al. 2001) used in the model study
for the two uppermost layers in a beech canopy. An early senescence of the Sun 1 layer results in
an earlier decline of A
max,a
and an earlier increase in c, which means that the stomatal conductance
decreases more with increasing VPD
74 W.L. Kutsch et al.
stomata to low air humidity in the Sun-1-layer as a consequence of strong irradiance
(symbolized by the coefficient c according to Kutsch et al. 2001; Fig. 4.7b) was
incorporated into the model.
During several model runs the foliage nitrogen concentration was constantly
increased. We used two scenarios: nitrogen was either distributed equally through-
out the whole canopy or optimised to gain highest canopy photosynthetic produc-
tion. Both scena rios showed that the photosynthetic income was increased with
increasing nitrogen content, but to a higher extent when the nitrogen distribution
was optimised (Fig. 4.8). The distribution of foliage nitrogen in the tree crown
according to the modelled optimisation was equal to that found in the field (Kutsch
et al. 2001): highest overall production was gained when more nitrogen was
allocated to the Sun-2-layer than to the Sun-1-layer.
The results can be summarised with the hypothesis that even the tall and
dominating beech tree maintains its character of a shade-ada pted plant as it needs
to shelter the highly productive inner parts of the crown against full sun irradiance
by means of peripherically inserted leaves.
4.6 Conclusions
Tall and old trees face unique environmental challenges. Height, and the resulting
gravimetrical and hydraulic strain, can burden, but not completely limit, further
growth of tall trees in most cases. The slowing of height growth with tree size
and the levelling off or decrease of GPP and NPP in old forests seems rather to be
a consequence of the complex interaction between environmental constraints, physi-
ological compensation, evolutionary adaptation, population- and community-level
Fig. 4.8 Modelled annual gross primary production (GPP) of a Beech forest in relation to the
nitrogen content of the whole canopy. Open circles GPP of a canopy with equally distributed
nitrogen, black circles canopy with optimised nitrogen distribution, triangles relative increase due
to nitrogen optimisation
4 Ecophysiological Characteristics of Mature Trees 75
processes and ecosystem development. Therefore the development of a single
hypothesis by reducing this complex fabric of interaction to a single mechanism
is inappropriate. In the debate about ‘age-related decline’ the pitfalls of mono-
causality are manifold:
l
Confounding the effects of ‘height’ and ‘age’: These variables are highly
correlated and their effects are thus difficult to separate. Clearly, ‘height’ plays
a dominant role in the context of hydraulic limitation of photosynthesis. How-
ever, the idea of genetically induced reduction in either source capacity or sink
strength as well as shifts between different sinks may shift the perspective rather
towards age than towards height effects (Day et al. 2001; Bond et al. 2007).
l
Direct scaling from the tree- to the stand-level: Tree-level responses to either
height or age can be fully compensated, partly buffered or exaggerated at the
population-level by processes acting on the amount of displayed leaf area,
the most important of which are changes in stand density and canopy architec-
ture. Our reanalysis of the Luyssaert dataset suggested that structure is more
important than physiology.
l
Negligence of temporal covariates: Both the environmental drivers and the
actors (the tree species themselves) may change substantially with secondary
succession. As shown, these changes may work in the direction of an ‘age-
related decline’ of productivity, but also against it.
Acknowledgement We would like to thank Michaela Knauer for helping with acquisition of
trait data.
References
Abaimov AP, Sofronov MA (1996) The main trends of post fire succession in near tundra forests
of Central Siberia. In: Goldammer JG, Furyaev VV (eds) Fire in ecosystems of Boreal Eurasia.
Kluwer, Dordrecht, pp 372 386
Abaimov AP, Prokushkin SG, Zyryanova OA, Kaverzina LN (1997) Peculiarities of forming and
functioning larch forests on frozen soils (in Russian). Lesovedenie 5:13 23
Anten NPR, Schieving F, Werger MJA (1995) Patterns of light and nitrogen distribution in relation
to whole canopy carbon gain in C
3
and C
4
monocotyledonous and dicotyledonous species.
Oecologia 101:504 513
Anten NPR, Werger MJA, Medina E (1998) Nitrogen distribution and leaf area indices in relation
to photosynthetic nitrogen use efficiency in savanna grasses. Plant Ecol 138:63 75
Barnard HR, Ryan MG (2003) A test of the hydraulic limitation hypothesis in fast growing
Eucalyptus saligna. Plant Cell Environ 26:1235 1245
Bazzaz FA (1979) The physiological ecology of plant succession. Annu Rev Ecol Systematics
10:351 371
Becker P, Meinzer FC, Wullschleger SD (2000) Hydraulic limitation of tree height: a critique.
Funct Ecol 14:4 11
Bernoulli M, Ko
¨
rner C (1999) Dry matter allocation in treeline trees. Phyton 39:7 12
76 W.L. Kutsch et al.
Binkley D, Stape J, Ryan MG, Barnard HR, Fownes J (2002) Age related decline in forest
ecosystem growth: an individual tree, stand structure hypothesis. Ecosystems 5:58 67
Bjoerkmann O, Demming Adams B (1995) Regulation of photosynthetic light energy capture,
conversion, and dissipation in leaves of higher plants. In: Schulze ED, Caldwell MM (eds)
Ecophysiology of photosynthesis. Springer, Berlin, pp 17 47
Bond BJ, Czarnomski NM, Cooper C, Day ME, Greenwood MS (2007) Developmental decline in
height growth in Douglas fir. Tree Physiol 27:441 453
Burschel P, Huss J (1964) The reaction of beech seedlings to shade. Forstarchiv 35:225 233
Carey EV, Sala A, Keane R, Callaway RM (2001) Are old forests underestimated as global carbon
sinks? Global Change Biol 7:339 344
Cochard H, Peiffer M, LeGall K, Granier A (1997) Developmental control of xylem hydraulic
resistances and vulnerability to embolism in Fraxinus excelsior L: impacts on water relations.
J Exp Bot 48:655 663
Day ME, Greenwood MS, White AS (2001) Age related changes in foliar morphology and
physiology in red spruce and their influence on declining photosynthetic rates and productivity
with tree age. Tree Physiol 21:1195 1204
Day ME, Greenwood MS, Diaz Sala C (2002) Age and size related trends in woody plant
shoot development: regulatory pathways and evidence for genetic control. Tree Physiol
22:507 513
Delzon S, Sartore M, Burlett R, Dewar R, Loustau D (2004) Hydraulic responses to height growth
in maritime pine trees. Plant Cell Environ 27:1077 1087
Ehleringer JR, Bowling DR, Flanagan LB, Fessenden J, Helliker B, Martinelli LA, Ometto JP (2002)
Stable isotopes and carbon cycle processes in forests and grasslands. Plant Biol 4:181 189
Equiza MA, Day ME, Jagels R, Li XC (2006) Photosynthetic downregulation in the conifer
Metasequoia glyptostroboides growing under continuous light: the significance of carbohy
drate sinks and paleoecophysiological implications. Can J Bot Rev Can Bot 84:1453 1461
Falster DS, Westoby M (2003) Plant height and evolutionary games. Trends Ecol Evol
18:337 343
Farquhar GD, Ehleringer JR, Hubick KT (1989) Carbon isotope discrimination and photosynthe
sis. Annu Rev Plant Physiol Plant Mol Biol 40:503 537
Field C (1983) Allocating leaf nitrogen for the maximization of carbon gain leaf age as a control
on the allocation program. Oecologia 56:341 347
Flanagan LB, Ehleringer JR (1998) Ecosystem atmosphere CO
2
exchange: interpreting signals of
change using stable isotope ratios. Trends Ecol Evol 13:10 14
Gould N, Minchin PEH, Thorpe MR (2004) Direct measurements of sieve element hydrostatic
pressure reveal strong regulation after pathway blockage. Funct Plant Biol 31:987 993
Gower ST, McMurtrie RE, Murty D (1996) Aboveground net primary production decline with
stand age: potential causes. Trends Ecol Evol 11:378 382
Hacke UG, Sperry JS, Ewers BE, Ellsworth DS, Scha
¨
fer KVR, Oren R (2000) Influence of soil
porosity on water use in Pinus taeda. Oecologia 124:495 505
Ha
¨
ttenschwiler S, Handa IT, Egli L, Asshoff R, Ammann W, Ko
¨
rner C (2002) Atmospheric CO
2
enrichment of alpine treeline conifers. New Phytol 156:363 375
Hoch G, Richter A, Ko
¨
rner C (2003) Non structural carbon compounds in temperate forest trees.
Plant Cell Environ 26:1067 1081
Hubbard RM, Bond BJ, Ryan MG (1999) Evidence that hydraulic conductance limits photosyn
thesis in old Pinus ponderosa trees. Tree Physiol 19:165 172
Irvine J, Law BE, Kurpius MR, Anthoni PM, Moore D, Schwarz PA (2004) Age related changes in
ecosystem structure and function and effects on water and carbon exchange in ponderosa pine.
Tree Physiol 24:753 763
Jarvis PG (1976) The interpretation of the variations in leaf water potential and stomatal conduc
tance found in canopies in the field. Philos Trans R Soc Lond B 273:593 610
Kattge J, Wirth C, No
¨
llert S, Bo
¨
nisch G (2008) Functional ecology of trees database. URL: http://
www.bgc jena.mpg.de/bgc organisms/pmwiki.php/Research/FET
4 Ecophysiological Characteristics of Mature Trees 77
Kattge J, Knorr W, Raddatz T, Wirth C (2009) Quantifying photosynthetic capacity and its
relationship to leaf nitrogen content for global scale terrestrial biosphere models. Global Change
Biol (in press) doi: 10.1111/j.1365 2486.2008.01744.x
Kira T, Shidei T (1967) Primary production and turnover of organic matter in different forest
ecosystems of the Western Pacific. Jpn J Ecol 17:70 87
Koch GW, Sillett SC, Jennings GM, Davis SD (2004) The limits to tree height. Nature
428:851 854
Ko
¨
rner C, Asshoff R, Bignucolo O, Ha
¨
ttenschwiler S, Keel SG, Pelaez Riedl S, Pepin S, Siegwolf
RTW, Zotz G (2005) Carbon flux and growth in mature deciduous forest trees exposed to
elevated CO
2
. Science 309:1360 1362
Kutsch WL, Herbst M, Vanselow R, Hummelshoj P, Jensen NO, Kappen L (2001) Stomatal
acclimation influences water and carbon fluxes of a beech canopy in northern Germany. Basic
Appl Ecol 2:265 281
Lambers H, Poorter H (1992) Inherent variation in growth rate between higher plants: a search for
physiological causes and ecological consequences. Adv Ecol Res 23:187 261
Luyssaert S, Inglima I, Jung M, Richardson AD, Reichstein M, Papale D, Piao SL, Schulze ED,
Wingate L, Matteucci G, Aragao L, Aubinet M, Beers C, Bernhofer C, Black KG, Bonal D,
Bonnefond JM, Chambers J, Ciais P, Cook B, Davis KJ, Dolman AJ, Gielen B, Goulden M,
Grace J, Granier A, Grelle A, Griffis T, Gru
¨
nwald T, Guidolotti G, Hanson PJ, Harding R,
Hollinger DY, Hutyra LR, Kolari P, Kruijt B, Kutsch W, Lagergren F, Laurila T, Law BE, Le
Maire G, Lindroth A, Loustau D, Malhi Y, Mateus J, Migliavacca M, Misson L, Montagnani L,
Moncrieff J, Moors E, Munger JW, Nikinmaa E, Ollinger SV, Pita G, Rebmann C, Roupsard O,
Saigusa N, Sanz MJ, Seufert G, Sierra C, Smith ML, Tang J, Valentini R, Vesala T, Janssens IA
(2007) CO
2
balance of boreal, temperate, and tropical forests derived from a global database.
Global Change Biol 13:2509 2537
Magnani F, Mencuccini M, Grace J (2000) Age related decline in stand productivity: the role of
structural acclimation under hydraulic constraints. Plant Cell Environ 23:251 263
Magnani F, Mencuccini M, Borghetti M, Berbigier P, Berninger F, Delzon S, Grelle A, Hari P,
Jarvis PG, Kolari P, Kowalski AS, Lankreijer H, Law BE, Lindroth A, Loustau D, Manca G,
Moncrieff JB, Rayment M, Tedeschi V, Valentini R, Grace J (2007) The human footprint in the
carbon cycle of temperate and boreal forests. Nature 447:848 850
McDowell N, Barnard H, Bond BJ, Hinckley T, Hubbard RM, Ishii H, Ko
¨
stner B, Magnani F,
Marshall JD, Meinzer FC, Phillips N, Ryan MG, Whitehead D (2002a) The relationship
between tree height and leaf area: sapwood area ratio. Oecologia 132:12 20
McDowell NG, Phillips N, Lunch C, Bond BJ, Ryan MG (2002b) An investigation of hydraulic
limitation and compensation in large, old Douglas fir trees. Tree Physiol 22:763 774
McDowell NG, Licata J, Bond BJ (2005) Environmental sensitivity of gas exchange in different
sized trees. Oecologia 145:9 20
Meinzer FC (1993) Stomatal control of transpiration. Trends Ecol Evol 289 294
Mencuccini M, Grace J (1996) Developmental patterns of above ground hydraulic conductance in
a Scots pine (Pinus sylvestris L.) age sequence. Plant Cell Environ 19:939 948
Minchin PEH, Lacointe A (2005) New understanding on phloem physiology and possible
consequences for modelling long distance carbon transport. New Phytol 166:771 779
Monteith JL (1965) Radiation and crops. Exp Agric 1:241 251
Mund M, Kummetz E, Hein M, Bauer GA, Schulze ED (2002) Growth and carbon stocks of a
spruce forest chronosequence in central Europe. For Ecol Manage 171:275 296
Neary DG, Klopatek CC, DeBano LF, Ffolliott PF (1999) Fire effects on belowground sustain
ability: a review and synthesis. For Ecol Manage 122:51 71
Niinemets U (2006) The controversy over traits conferring shade tolerance in trees: ontogenetic
changes revisited. J Ecol 94:464 470
Niinemets U, Valladares F (2006) Tolerance to shade, drought, and waterlogging of temperate
Northern Hemisphere trees and shrubs. Ecol Monogr 76:521 547
Odum EP (1969) The strategy of ecosystem development. Science 164:262 270
78 W.L. Kutsch et al.
Oliver CD, Larson BC (1996) Forest stand dynamics. Update edn. Wiley, New York
Phillips NG, Ryan MG, Bond BJ, McDowell NG, Hinckley TM, Cermak J (2003) Reliance on
stored water increases with tree size in three species in the Pacific Northwest. Tree Physiol
23:237 245
Pothier D, Margolis HA, Poliquin J, Waring RH (1989) Relation between the permeability and the
anatomy of Jack pine sapwood with stand development. Can J For Res 19:1564 1570
Ryan MG, Yoder BJ (1997) Hydraulic limits to tree height and tree growth. Bioscience 47:235 242
Ryan MG, Binkley D, Fownes JH (1997) Age related decline in forest productivity: pattern and
process. Adv Ecol Res 27:213 262
Ryan MG, Binkley D, Fownes JH, Giardina CP, Senock RS (2004) An experimental test of the
causes of forest growth decline with stand age. Ecol Monogr 74:393 414
Saxe H, Kerstiens G (2005) Climate change reverses the competitive balance of ash and beech
seedlings under simulated forest conditions. Plant Biol (Stuttg) 7:375 386
Schoettle AW (1994) Influence of tree size on shoot structure and physiology of Pinus contorta
and Pinus aristata. Tree Physiol 14:1055 1068
Schulze ED (1970) The CO
2
gas exchange of Fagus sylvatica in relation to climatic factors in the
field. Flora 159:172 232
Schulze ED (1972) The effect of light and temperature on the CO
2
exchange of different growth forms
in the ground flora of a montane Beech forest (in German). Oecologia 9:235 258
Schulze ED (2000) Carbon and nitrogen cycling in European forest ecosystems. Springer, Berlin
Schulze ED, Wirth C, Mollicone D, Ziegler W (2005) Succession after stand replacing disturbances
by fire, wind throw, and insects in the dark Taiga of Central Siberia. Oecologia 146:77 88
Sperry JS, Adler FR, Campbell GS, Comstock JP (1998) Limitation of plant water use by
rhizosphere and xylem conductance: results from a model. Plant Cell Environ 21:347 359
Spiegelhalter D, Thomas A, Best N, Lunn D (2003) WinBUGS User Manual, ver 1.4. http://www.
mrc bsu.cam.ac.uk/bugs/winbugs/manual14.pdf
Sprugel DG, Ryan M, Brooks JR, Vogt KA, Martin TA (1995) Respiration from the organ level to
the stand. In: Smith WJ, Hinckley TM (eds) Resource physiology of conifers: acquisition,
allocation and utilisation. Academic, San Diego, pp 255 299
Tyree MT, Ewers FW (1991) The hydraulic architecture of trees and other woody plants. New
Phytol 119:345 360
Valladares F, Chico JM, Aranda I, Balaguer L, Dizengremel P, Manrique E, Dreyer E (2002) The
greater seedling high light tolerance of Quercus robur over Fagus sylvatica is linked to a
greater physiological plasticity. Trees 16:395 403
Vanninen P, Ylitalo H, Sievanen R, Makela A (1996) Effects of age and site quality on the
distribution of biomass in Scots pine (Pinus sylvestris L). Trees Struct Funct 10:231 238
Vitousek PM, White PS (1981) Process studies in succession. In: West DC, Shugart HH, Botkin
DB (eds) Forest succession: concepts and application. Springer, New York, pp 267 276
Walters MB, Reich PB (1999) Low light carbon balance and shade tolerance in the seedlings of
woody plants: do winter deciduous and broad leaved evergreen species differ? New Phytol
143:143 154
Weiner J, Thomas SC (2001) The nature of tree growth and the ‘‘age related decline in forest
productivity’’. Oikos 92:374 376
Weitz JS, Ogle K, Horn HS (2006) Ontogenetically stable hydraulic design in woody plants. Funct
Ecol 20:191 199
Werger MJA, Hirose T (1991) Leaf nitrogen distribution and whole canopy photosynthetic carbon
gain in herbaceous stands. Vegetatio 97:11 20
Whitehead D, Edwards WR, Jarvis PG (1984) Conducting sapwood area, foliage area, and
permeability in mature trees of Picea sitchensis and Pinus contorta. Can J For Res 14:940 947
Wieser G, Gigele T, Pausch H (2005) The carbon budget of an adult Pinus cembra tree at the
alpine timberline in the Central Austrian Alps. Eur J For Res 124:1 8
Yoder BJ, Ryan MG, Waring RH, Schoettle AW, Kaufmann MR (1994) Evidence of reduced
photosynthetic rates in old trees. For Sci 40:513 527
4 Ecophysiological Characteristics of Mature Trees 79