- Trang chủ >>
- Đại cương >>
- Kinh tế vĩ mô
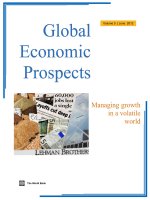
global economic prospects volume 7 june 2013 less volatile but slower growth
Bạn đang xem bản rút gọn của tài liệu. Xem và tải ngay bản đầy đủ của tài liệu tại đây (10.69 MB, 226 trang )
A World Bank Group Flagship Report
Global Global Global
Economic Economic Economic
ProspectsProspectsProspects
Volume 7Volume 7Volume 7 | June 2013| June 2013| June 2013
The World Bank
Less volatile,
but slower growth
Less volatile,
but slower growth
Less volatile,
but slower growth
Volume
7
GLOBAL
ECONOMIC
PROSPECTS
June
2013
© 2013 International Bank for Reconstruction and Development / The World Bank
1818 H Street NW, Washington DC 20433
Telephone: 202-473-1000; Internet: www.worldbank.org
Some rights reserved
1 2 3 4 15 14 13
This work is a product of the staff of The World Bank with external contributions. Note that The World Bank does not necessarily
own each component of the content included in the work. The World Bank therefore does not warrant that the use of the content
contained in the work will not infringe on the rights of third parties. The risk of claims resulting from such infringement rests solely
with you.
The findings, interpretations, and conclusions expressed in this work do not necessarily reflect the views of The World Bank, its
Board of Executive Directors, or the governments they represent. The World Bank does not guarantee the accuracy of the data
included in this work. The boundaries, colors, denominations, and other information shown on any map in this work do not imply any
judgment on the part of The World Bank concerning the legal status of any territory or the endorsement or acceptance of such
boundaries.
Nothing herein shall constitute or be considered to be a limitation upon or waiver of the privileges and immunities of The World
Bank, all of which are specifically reserved.
Rights and Permissions
This work is available under the Creative Commons Attribution 3.0 Unported license (CC BY 3.0) />licenses/by/3.0. Under the Creative Commons Attribution license, you are free to copy, distribute, transmit, and adapt this work,
including for commercial purposes, under the following conditions:
Attribution—Please cite the work as follows: The World Bank. 2013. Global Economic Prospects, Volume 7, June 2013, World Bank,
Washington, DC. doi:10.1596/978-1-4648-0036-8 License: Creative Commons Attribution CC BY 3.0
Translations—If you create a translation of this work, please add the following disclaimer along with the attribution: This translation
was not created by The World Bank and should not be considered an official World Bank translation. The World Bank shall not be
liable for any content or error in this translation.
All queries on rights and licenses should be addressed to the Office of the Publisher, The World Bank, 1818 H Street NW, Washing-
ton, DC 20433, USA; fax: 202-522-2625; e-mail:
ISBN (electronic): 978-1-4648-0036-8
DOI: 10.1596/978-1-4648-0036-8
Cover photo: Neil Thomas
Cover design: Roula Yargizi
The cutoff date for the data used in the report was June 7, 2013.
ACKNOWLEDGMENTS
This report is a product of the Prospects Group in the Development Economics Vice Presidency of
the World Bank. Its principal authors were Andrew Burns and Theo Janse van Rensburg.
The project was managed by Andrew Burns, under the direction of Hans Timmer and the guidance
of Kaushik Basu.
Several people contributed substantively to the report.
The modeling and data team was led by Theo Janse
van Rensburg, assisted by Trung Thanh Bui, Muham-
mad Adil Islam and Irina Magyer. The projections, re-
gional write-ups and subject annexes were produced
by Dilek Aykut (Finance, Europe & Central Asia), John
Baffes (Commodities), Damir Ćosić (Commodities),
Allen Dennis (Sub-Saharan Africa and International
Trade), Tehmina Shaukat Khan (Middle East & North
Africa), Eung Ju Kim (Finance), Sanket Mohapatra
(South Asia and Exchange Rates), Theo Janse van
Rensburg (High-Income Countries), Cristina Savescu
(Latin America & Caribbean and Industrial Production)
and Ekaterine Vashakmadze (East Asia & the Pacific
and Inflation).
Regional projections and annexes were produced in
coordination with country teams, country directors, and
the offices of the regional chief economists and PREM
directors. The short-term commodity price forecasts
were produced by John Baffes and Damir Ćosić. The
remittances forecasts were produced by Gemechu
Ayana Aga, Christian Eigen-Zucchi and Dilip K. Ratha.
Simulations were performed by Trung Thanh Bui and
Theo Janse van Rensburg.
The accompanying online publication, Prospects for
the Global Economy, was produced by a team com-
prised of Marie-Anne Chambonnier, Muhammad Adil
Islam, Vamsee Krishna Kanchi, Katherine Rollins, and
Dana Vorisek, with technical support from David Horo-
witz, Ugendran Machakkalai, and Malarvishi Veerap-
pan.
Cynthia Case-McMahon, Indira Chand, and Merrell
Tuck-Primdahl managed media relations and the dis-
semination. Kristina Cathrine Mercado managed the
publication process.
Several reviewers offered extensive advice and com-
ments. These included Abdul de Guia Abiad, Ahmad
Ahsan, Sara B. Alnashar, Jorge Araujo, Merli Baroudi,
Roshan D. Bajracharya, Andrew Beath, Kirida
Bhaopichitr, Parminder P.S. Brar, Penelope J. Brook,
Timothy John Bulman, Kevin Carey, Young Hwan Cha,
Shubham Chaudhuri, Rodrigo A. Chaves, Nada
Choueri, Karl Kendrick Tiu Chua, Punam Chuhan-
Pole, Francoise Clottes, Tito Cordella, Augusto de la
Torre, Shantayanan Devarajan, Tatiana Didier, Hinh
Truong Dinh, Sebastian Eckardt, Khalid El Massnaoui,
Philip English, Pablo Fajnzylber, Manuela V. Ferro,
Daminda Eynard Fonseka, Bernard G. Funck, Marcelo
Giugale, Chorching Goh, Susan G. Goldmark, David
Michael Gould, Gloria M. Grandolini, Kiryl Haiduk, Bert
Hofman, Zahid Hussain, Elena Ianchovichina, Fernan-
do Gabriel Im, Roumeen Islam, Ivailo V. Izvorski, Car-
los Felipe Jaramillo, Markus Kitzmuller, Auguste Tano
Kouame, Thomas Blatt Laursen, Xiaofan Liu, Sandeep
Mahajan, Ernesto May, Deepak Mishra, Denis
Medvedev, Lars Christian Moller, Lalita M. Moorty,
Claudia Nassif, Antonio Nucifora, Antonio M. Ollero,
Kwang Park, Catalin Pauna, Keomanivone Phimmaha-
say, Miria Pigato, Mohammad Zia Qureshi, Martin
Raiser, Susan R. Razzaz, Christine M. Richaud, David
Rosenblatt, Frederico Gil Sander, Philip Schuler,
Sudhir Shetty, Maryna Sidarenka, Alexis Sienaert,
Carlos Silva-Jauregui, Karlis Smits, Vinaya Swaroop,
Mark Roland Thomas, Volker Treichel, Nattaporn Tri-
ratanasirikul, Cevdet Cagdas Unal, M. Willem van Ee-
ghen, Axel van Tortsenberg, R. Gregory Toulmin, Ser-
gei Ulatov, Aristomene Varoudakis, Mathew A.
Verghis, Gallina Andronova Vincelette, Ekaterina
Vostroknutova, Muhammad Waheed, Marina Wes,
Deborah L. Wetzel, Kirthisri Rajatha Wijeweera,
Hernan Jorge Winkler, Soonhwa Yi, Salman Zaidi, and
Albert Zeufack.
ACRONYMS
ASEAN Association of South East Asian Nations
BRICS Brazil, Russian Federation, India, China, and South Africa
CDS Credit Default Swap
ECB European Central Bank
FDI Foreign Direct Investment
GDP Gross Domestic Product
IMF International Monetary Fund
ODA Official Development Assistance
OECD Organization for Economic Cooperation and Development
OMT Outright Monetary Transactions
OPEC Organization of Petroleum Exporting Countries
PMI Purchasing Manager’s Index
QE Quantitative Easing
SAAR Seasonally adjusted annualized rate
TFP Total Factor Productivity
TABLE OF CONTENTS
Main Text ………………………………………………………………………… … … 1
Topical Annexes
Industrial production …………………. ………………………………………………… 31
Inflation. ………………………………………………………………… …………… 41
Financial markets …………………………………………… ………… …………… 53
Trade …………………………………………………………………… ……….…… 67
Exchange rates ……………………………………………………………… …… …… … 77
Commodity markets …………………….…………………………………… ….….………. 91
Regional Annexes
East Asia & the Pacific ……………………………………………… … … ……….…… 117
Europe & Central Asia ………………………………………………… …… … ….……. 133
Latin America & the Caribbean …………………………………… ………………….… 149
Middle East & North Africa …………………………………………………………… … 163
South Asia ………………………………………………………….……………… 181
Sub-Saharan Africa ……………………………………………….………………… …… 199
GLOBAL ECONOMIC PROSPECTS | June 2013
1
Overview and
main messages
The global economy appears to be transitioning
toward a period of more stable, but slower growth.
Global gross domestic product (GDP), which
slowed in mid-2012 is recovering, and a modest
acceleration in quarterly GDP is expected during
the course of 2013. That progress will be masked in
the annual data, however, with whole-year growth
for 2013 projected at 2.2 percent, a touch slower
than in 2012. The strengthening of quarterly
growth will show up in whole-year global GDP
growth of 3.0 percent for 2014 and 3.3 percent in 2015
(table 1).
Financial conditions in high-income countries
have improved and risks are down, but growth
remains subdued, especially in Europe
High-income countries continue to face challenges
to restore financial sector health, reform
institutions, and get fiscal policy onto a sustainable
path. However, the likelihood that these challenges
provoke a major crisis has declined.
Although acute risks have diminished, real-side
activity remains sluggish. Among high-income
countries, the challenges are especially difficult in
high-income Europe, where growth is being held
back by weak confidence and continued banking-
sector and fiscal restructuring. The recovery is on
more solid ground in the United States, where a
fairly robust private sector recovery is being held
back, but not extinguished, by fiscal tightening.
Meanwhile, in Japan, a dramatic relaxation of
macroeconomic policy has sparked an uptick in
activity, at least over the short term. Overall,
growth in high-income countries is projected to
accelerate slowly, with GDP expanding a modest
1.2 percent this year, but firming to 2.0 and 2.3
percent in 2014 and 2015, respectively.
Growth is firming in developing countries, but
conditions vary widely across economies
In developing countries, GDP is expected to firm
somewhat. Less volatile external conditions, a
recovery of capital flows to levels that support
growth, the relaxation of capacity constraints in
some middle-income countries, and stronger
growth in high-income countries are expected to
yield a gradual acceleration of developing-country
growth to 5.1 percent this year, and to 5.6 and 5.7
percent in 2014 and 2015, respectively.
Most developing countries have recovered from
the crisis, so room for additional acceleration is
limited
The overall acceleration is not stronger because the
majority of developing countries have more-or-less
fully recovered from the 2008 financial crisis. For
many of these countries, current and projected
growth is broadly in line with underlying potential
growth—leaving little room for acceleration. Thus,
GDP in the East Asia & Pacific region is projected
to increase 7.3 percent in 2013, but then expand at
a broadly stable 7½ percent rate in each of 2014,
and 2015. In Latin America, growth is expected to
pick up in 2013 to about 3.3 percent, but then to
stabilize at just below 4 percent in each of 2014 and
2015. Already, growth in several countries in both
regions is being held back by supply-side
constraints that are manifesting themselves in
inflation, asset-price bubbles, and deteriorating current
account balances.
Many countries in Sub-Saharan Africa are also
running at, close to, or above potential output, and
risk building up inflationary pressures. Growth in
the region is projected to firm over the projection
period to 4.9, 5.2, and 5.4 percent in 2013, 2014,
and 2015, respectively. Growth in South Asia is
projected to pick up to 5.2 percent this year,
following a very weak 2012 and then to firm only
gradually to 6.0 and 6.4 percent in 2014 and 2015
as spare capacity is reabsorbed.
In developing Europe and the Middle East &
North Africa, output gaps remain and growth
is projected to strengthen
Many countries in developing Europe have still not
recovered from the crisis. Unemployment and
spare capacity remain high, because activity has
been weighed down by banking-sector, household,
and fiscal restructuring (much like high-income
Europe). As adjustments are completed, growth in
the region is projected to strengthen progressively
from 2.7 percent last year to 4.2 percent by 2015.
Growth in the Middle East & North Africa has
GLOBAL ECONOMIC PROSPECTS | June 2013
2
The global outlook in summary
(percentage change from previous year, except interest rates and oil price)
Table 1.
2011 2012 2013e 2014f 2015f
Global Conditions
World Trade Volume (GNFS) 6.2 2.7 4.0 5.0 5.4
Consumer Prices
G-7 Countries
1,2
5.3 -0.6 -0.1 0.9 1.0
United States 2.4 2.1 2.4 2.5 2.5
Commodity Prices (USD terms)
Non-oil commodities 20.7 -9.5 -4.7 -1.1 -1.5
Oil Price (US$ per barrel)
3
104.0 105.0 102.4 101.0 101.0
Oil price (percent change) 31.6 1.0 -2.5 -1.3 -0.1
Manufactures unit export value
4
8.5 -2.1 2.4 2.2 1.9
Interest Rates
$, 6-month (percent) 0.8 0.5 0.7 1.1 1.4
€, 6-month (percent) 1.6 0.2 0.5 1.2 1.5
International capital flows to developing countries (% of GDP)
Developing countries
Net private and official inflows 5.2 5.0 4.7 4.4 4.3
Net private inflows (equity + debt) 5.0 4.9 4.7 4.4 4.3
East Asia and Pacific 5.7 4.6 4.2 3.9 3.8
Europe and Central Asia 5.5 5.7 6.5 6.1 6.0
Latin America and Caribbean 5.4 6.4 5.9 5.5 5.3
Middle East and N. Africa 1.3 1.4 1.1 1.4 1.7
South Asia 3.3 4.0 3.6 3.4 3.3
Sub-Saharan Africa 4.2 3.5 3.8 3.9 4.2
Real GDP growth
5
World 2.8 2.3 2.2 3.0 3.3
Memo item: World (PPP weights) 3.8 2.9 3.1 3.8 4.1
High income 1.7 1.3 1.2 2.0 2.3
OECD Countries 1.5 1.2 1.1 1.9 2.2
Euro Area 1.5 -0.5 -0.6 0.9 1.5
Japan -0.5 2.0 1.4 1.4 1.3
United States 1.8 2.2 2.0 2.8 3.0
Non-OECD countries 4.9 2.8 3.1 3.7 3.9
Developing countries 6.0 5.0 5.1 5.6 5.7
East Asia and Pacific 8.3 7.5 7.3 7.5 7.5
China 9.3 7.8 7.7 8.0 7.9
Indonesia 6.5 6.2 6.2 6.5 6.2
Thailand 0.1 6.5 5.0 5.0 5.5
Europe and Central Asia 5.7 2.7 2.8 3.8 4.2
Russia 4.3 3.4 2.3 3.5 3.9
Turkey 8.8 2.2 3.6 4.5 4.7
Romania 2.5 0.7 1.7 2.2 2.7
Latin America and Caribbean 4.4 3.0 3.3 3.9 3.8
Brazil 2.7 0.9 2.9 4.0 3.8
Mexico 3.9 3.9 3.3 3.9 3.8
Argentina 8.9 1.9 3.1 3.0 3.0
Middle East and N. Africa -2.2 3.5 2.5 3.5 4.2
Egypt
6
1.8 2.2 1.6 3.0 4.8
Iran 1.7 -1.9 -1.1 0.7 1.9
Algeria 2.4 2.5 2.8 3.2 3.5
South Asia 7.3 4.8 5.2 6.0 6.4
India
6, 7
6.2 5.0 5.7 6.5 6.7
Pakistan
6, 7
3.0 3.7 3.4 3.5 3.7
Bangladesh
6
6.7 6.2 5.8 6.1 6.3
Sub-Saharan Africa 4.7 4.4 4.9 5.2 5.4
South Africa 3.1 2.5 2.5 3.2 3.3
Nigeria 7.4 6.5 6.7 6.7 7.0
Angola 3.4 8.1 7.2 7.5 7.8
Memorandum items
Developing countries
excluding transition countries 6.5 5.0 5.3 5.8 5.9
excluding China and India 4.5 3.3 3.5 4.2 4.4
6.
7.
Real GDP at factor cost, consistent with reporting practice in Pakistan and India. See Table SAR.2, South Asia Regional Annex for details.
In keeping with national practice, data for Bangladesh, Egypt, India, and Pakistan are reported on a fiscal year basis in table 1.1. Aggregates that
depend on these countries are calculated using data compiled on a calendar year basis.
Source: World Bank.
Notes: PPP = purchasing power parity; e = estimate; f = forecast.
1. Canada, France, Germany, Italy, Japan, the United Kingdom, and the United States.
2. In local currency, aggregated using 2005 GDP weights.
3. Simple average of Dubai, Brent, and West Texas Intermediate.
4. Unit value index of manufactured exports from major economies, expressed in USD.
5. Aggregate growth rates calculated using constant 2005 dollars GDP weights.
GLOBAL ECONOMIC PROSPECTS | June 2013
3
been disrupted by political and social tensions and
Euro Area weakness. Assuming that tensions in the
region gradually ease, growth is projected to slowly
strengthen from 2.5 percent in 2013 to 3.5 percent
in 2014 and 4.2 percent in 2015.
Risks are less pronounced and more balanced than a
year ago, with new risks gaining prominence
Although acute risks in high-income countries are
down, more modest downside risks linger as these
economies continue to adjust. Importantly, downside
risks are now balanced by the possibility of
stronger growth should confidence improve more
quickly than anticipated in the baseline.
For developing countries that have already
recovered from the crisis, or that are expected to in
2013, macroeconomic policy may need to be
tightened to contain or prevent inflation, asset-
price bubbles, and deteriorating current accounts.
Tightening would have the further advantage of
restoring depleted policy buffers. In countries
where unemployment remains high and spare
capacity is ample, notably in developing Europe, a
loosening of policy may be in order where policy
space exists. The rebalancing effort in China, and its
unsustainably high investment rate are ongoing
challenges.
Most countries need to prioritize structural
reforms to expand their growth potential
While projected growth rates are satisfactory and
well above the growth rates of the 1990s, they are 1
–2 percentage points slower than in the pre-crisis
boom period. To achieve higher growth on a
sustained basis, developing countries will need to
focus on domestic challenges. These differ across
countries, but share common themes. In general,
policymakers will need to redouble efforts to
restore and preserve macroeconomic stability and
reduce bottlenecks by streamlining regulations;
improving their enforcement; and investing in
infrastructure, education, and health.
New risks include a faster decline in commodity
prices,
Over the past year, energy and metals prices have
been easing in response to supply and demand-side
substitution induced by high prices (metal prices
are down 30 percent since their February 2011
peak). If prices decline to their longer-term
equilibrium more quickly than assumed in the
baseline, GDP growth among Sub-Saharan African
metal exporters could decline by as much as 0.7
percentage points, while current account and fiscal
balances could deteriorate by 1.2 and 0.9 percent of
GDP, respectively. Lower oil prices would have
similar impacts for oil exporters (-0.4 percent of
GDP), but would tend to benefit developing
countries as a whole (+0.3 percent of GDP).
… and the potential impacts of a withdrawal of
quantitative easing
Quantitative easing has benefited developing
countries by stimulating high-income-country
GDP, lowering borrowing costs, and avoiding a
financial-sector meltdown. On balance, the
increased liquidity has not generated excessive
capital flows to developing countries. Net capital
flows to developing countries have recovered to
4.2 percent of developing-country GDP, but
remain well below the 2007 level of 7.2 percent of
GDP. However, flows have been more volatile.
Based on this experience, the recent intensification
of monetary easing in Japan should not prove too
disruptive for developing countries over the
medium term, but it could generate large
fluctuations in flows over the short run that are
difficult to manage.
Once high-income countries begin to pursue
quantitative easing less actively or begin to unwind
long-term positions, interest rates are likely to rise.
Higher interest rates will increase debt-servicing
costs, and could increase default rates on existing
loans. Banks in countries that have enjoyed very
strong growth and asset-price inflation, together
with high levels of government or private sector
debt, may be at particular risk. In the longer term,
higher interest rates will raise the cost of capital in
developing countries and can be expected to
reduce the level of investment that firms wish to
maintain. As investment rates adjust to these higher
capital costs, developing-country investment
spending and growth can be expected to decline by
as much as 0.6 percentage points per annum after
three years.
GLOBAL ECONOMIC PROSPECTS | June 2013
4
Recent Developments
The global economy is transitioning into what is
likely to be a smoother and less volatile period.
Financial market risk indicators, such as credit
default swap rates, sovereign debt spreads, and
stock market volatility indicators have all improved
significantly since June 2012 (figure 1).
Financial market conditions have
improved over the past year
The improvement reflects progress toward fiscal
sustainability in the Euro Area, reinforced
assurances that the European Central Bank (ECB)
will do whatever it takes to save the Euro Area, and
concrete steps toward reinforcing those aspects of
institutional weakness that contributed to Euro
Area difficulties (box 1).
These improved financial market conditions have
persisted for almost a whole year, despite being
subjected to stresses, including elections in several
economies, concerns about a potential banking
crisis in Slovenia, the Cyprus rescue package, and
an extended period of very slow or negative
growth. The durability of the improved indicators
attests to the improvement in conditions.
Nevertheless, concerns remain, particularly among
banks in high-spread countries, which continue to
be burdened by relatively large quantities of
underperforming loans and relatively weak levels of
capitalization (IMF 2013b).
The better financial conditions in the Euro Area, in
tandem with the extraordinary monetary policy
steps undertaken by the Federal Reserve Bank in
the United States, the Bank of England, the ECB,
and most recently the Bank of Japan, have flooded
markets with liquidity. This in turn has reduced
yields on long-term debt and the price of riskier
assets—including developing-country equities,
bonds, and bank loans. As a result, by May gross
capital flows to developing countries, which were
weak for most of the post-crisis period, have
recovered to close-to-peak levels. Bank lending and
equity issuance has doubled relative to the same
period a year ago (figure 2). Nevertheless, as a
percent of developing-country GDP, capital flows
remain well below pre-crisis levels.
The recovery in bank flows is especially important,
because it suggests that the most acute effects on
developing countries of the deleveraging among
high-income banks have passed. Most of the recent
recovery in banking flows has benefitted
developing Europe and Central Asia, which was
the developing region hardest-hit by the crisis and
by the Euro Area deleveraging process. Flows in
most regions, except the Middle East & North
Africa
FN1
, were significantly higher than in 2012,
with Europe & Central Asia (mainly banking and
bond), and East Asia & Pacific (mainly bond and
equity) recording the biggest increases.
Despite the improvement in gross flows and
in financial indicators among high-income
countries, developing-country financial-
market prices have been weak. Thus, while
stock markets in high-income countries
surged in the post–June 2012 period (the
Gross capital flows to developing countries
have recovered in nominal terms
Source: World Bank; Dealogic.
Figure 2.
0
20
40
60
80
2009Q1 2009Q4 2010Q3 2011Q2 2012Q1 2012Q4
New equity issuance Bond issuance Bank Loans
Gross capital flows to developing countries, 3month ma, $billions
Financial indicators worldwide have
improved since June 2012
Source: World Bank; Bloomberg.
Figure 1.
-40
-30
-20
-10
0
10
20
30
-400
-300
-200
-100
0
100
200
300
High-spread
Euro Area
Commercial banks
Euro Area
High-spread
Euro Area
Developing-country
VIX
U.S. (S&P 500)
Europe (STOXX
600)
CDS Rates
Bond Yields
Equity market valuations
Volatility
Change since June 2012, basis points
Change since June 2012, percent

