WebSphere Studio Application Developer Version 5 Programming Guide part 10 pps
Bạn đang xem bản rút gọn của tài liệu. Xem và tải ngay bản đầy đủ của tài liệu tại đây (298.5 KB, 10 trang )
64 WebSphere Studio Application Developer Version 5 Programming Guide
Java Type Hierarchy perspective
This perspective also addresses Java developers and allows them to explore a
type hierarchy. It can be opened on types, compilation units, packages, projects
or source folders and consists of the Hierarchy view and an editor (Figure 3-12).
Figure 3-12 Java Type Hierarchy perspective
By default this perspective displays the Hierarchy view and the Editor pane. The
Hierarchy view does not display a hierarchy until you select a type (Figure 3-13).
Figure 3-13 Hierarchy view - initial
Java Editor
Chapter 3. Perspectives, views, and editors 65
To open a type in the Hierarchy view, open the context menu from a type in the
Package Explorer, the Editor, the Navigator or the Outline view and select
Open
Type Hierarchy
.
Once you have selected a type and opened it to the type hierarchy, the type
hierarchy is displayed in the Hierarchy view. Figure 3-14 shows the Hierarchy
view of the Java Swing class JList.
Figure 3-14 Hierarchy view
Icons are provided at the top of the Hierarchy view to display the type hierarchy
, the supertype hierarchy (bottom-up) , or the subtype hierarchy
(top-down) . The supertype hierarchy also shows interfaces that are
implemented for each class in the hierarchy.
66 WebSphere Studio Application Developer Version 5 Programming Guide
Server perspective
The Server perspective (Figure 3-15) is used to manage the server test
environments you use when testing, debugging, and profiling your applications.
Figure 3-15 Server perspective
The perspective has the following views:
Server Configuration view—Shows the servers and server configurations
created. By clicking the down arrow and selecting
Standard
or
Advanced
the
view can be slightly customized.
Servers view—Provides another view of the servers and also displays the
console which shows the stdout output from each server.
Servers can be controlled (start, stop, restart) either using the Server
Configuration view or the Servers view. Select the server and choose the
appropriate action from its context menu. If a server configuration is opened (by
double-clicking it) it opens up in the upper right pane and allows for editing of its
properties.
Chapter 3. Perspectives, views, and editors 67
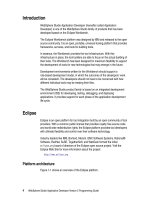
XML perspective
The XML perspective (Figure 3-16) contains several editors and views that can
help a developer in building XML files, XML schemas, DTDs, style sheets, and
integrating between data extracted from relational databases and XML.
Figure 3-16 XML perspective
The XML perspective contains four sections:
Outline view—Shows the Outline view for the active editor; in this case the
XML editor is active.
Navigator view—Displays the folders, and files of the project.
Tasks view—Shows the problems and errors to be fixed.
Editor pane—Active editors.
68 WebSphere Studio Application Developer Version 5 Programming Guide
XSL Debug perspective
The XSL Debug perspective is used when you transform XML files. This
perspective and its capabilities are described in the section “Debugging XSL” on
page 369.
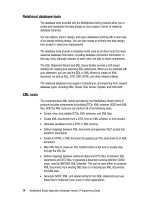
Data perspective
The Data perspective lets you access relational databases tools and you can
create and manipulate the data definitions for your project. This perspective also
lets you browse or import database schemas in the DB Servers view, create and
work with database schemas in the Data Definition view, and change database
schemas in the table editor. You can also export data definitions to another
database installed either locally or remotely. The Data perspective is shown in
Figure 3-17.
Figure 3-17 Data perspective
Chapter 3. Perspectives, views, and editors 69
These views characterize the Data perspective:
Data Definition view—This view of lets you work directly with data
definitions, defining relational data objects. It can hold local copies of existing
data definitions imported from the DB Servers view, designs created by
running DDL scripts, or new designs that you have created directly in the
Workbench. Using the Data Definition view, you can also rename logical
objects.
DB Servers view—Using this view, you can:
– Create a new database connection.
– Connect to existing databases and view their designs.
– Reconnect to a database if your database connection was disconnected.
– Disconnect from a database connection if you are connected.
– Import the designs to another folder in the Data Definition view, where you
can extend or modify the designs.
– Refresh the database objects defined to a database connection.
– Delete a database connection.
Debug perspective
Application Developer provides a Debug perspective that supports testing and
debugging of your applications.
The Debug perspective, shown in Figure 3-18, contains five panes:
Top left—Shows Debug and Servers views.
Top right—Shows Breakpoints, Expressions, Variables and Display views.
Middle left—Shows the Source, the Design view, or the Web browser. In the
Source view, the line with the current error or breakpoint is displayed (where
the process stopped).
Middle right—Shows the Outline view of the currently displayed source.
Bottom—Shows the Console and the Tasks view.
70 WebSphere Studio Application Developer Version 5 Programming Guide
Figure 3-18 Debug perspective
Debug view—Displays the stack frame for the suspended threads for each
target you are debugging. Each thread in your program appears as a node in
the tree. If the thread is suspended, its stack frames are shown as child
elements.
If the resource containing a selected thread is not open and/or active, the file
opens in the editor and becomes active, focusing on the source with which
the thread is associated.
The Debug view enables you to perform various start, step, and terminate
debug actions as well as enable or disable step-by-step debugging
Variables view—Displays information about the variables in the
currently-selected stack frame.
Breakpoints view—Lists all the breakpoints you have set in the Workbench
projects. You can double-click a breakpoint to display its location in the editor.
In this view, you can also enable or disable breakpoints, delete them, or add
Chapter 3. Perspectives, views, and editors 71
new ones. This view also lists Java exception breakpoints, which suspend
execution at the point where the exception is thrown. You can add or remove
exceptions.
Expressions view—Data can be inspected in the Expressions view. You can
inspect data from a scrapbook page, a stack frame of a suspended thread,
and other places. The Expressions view opens automatically when the
Inspect command is activated.
Display view—Shows the result of evaluating an expression in the context of
the current stack frame. You can evaluate and display a selection either from
the editor or directly from the Display view.
More information about the Debug perspective can be found in “Testing and
debugging” on page 553.
Profiling perspective
Profiling is controlled from the Profiling perspective (Figure 3-19). To open the
perspective, select
Window -> Open Perspective -> Other -> Profiling
.
Figure 3-19 Profiling perspective
72 WebSphere Studio Application Developer Version 5 Programming Guide
The Profiling perspective contains all the views used in a profiling session. Once
you open the Profiling perspective, the Profiling Monitor view is visible on the top,
left side of the Workbench.
The Profiling Monitor view displays profiling objects such as project folders,
monitors, hosts, processes, and agents that get created during a profiling
session.
On the right of the Workbench, the Profiling perspective offers the following
views, which display data that is collected from a profiling session:
Statistical profiling views:
– Package Statistics view
– Class Method Statistics view
– Method Statistics view
– Class Instance Statistics view
– Instance Statistics view
Graphical profiling views:
– Execution Flow view
– Object References view
– Method Execution view
– Method Invocation view
– Heap view
More details about these views can be found in “Performance analysis” on
page 666.
Component Test perspective
The Component Test perspective (Figure 3-20) provides a framework for defining
and executing test cases.
Definition view—Used to define test cases. This is also where you define the
hosts on which the test cases will run. Once you define the test case element
in the Definition pane, its contents appear in the Outline pane.
Outline view—Displays the contents of a test case currently being edited.
Here you add elements to the test case's main block, and once your definition
is complete you prepare it to run and create a test case instance.
Execution view—Once you prepare a test case definition to run, a test case
instance is generated in the Execution pane. You can then review the
instance and edit any associated generated code before running the test
case.
Chapter 3. Perspectives, views, and editors 73
Figure 3-20 Component Test perspective
More information about Component Testing is located in “Component testing” on
page 588.
CVS Repository Exploring perspective
The CVS Repository Exploring perspective (Figure 3-21) lets you connect to
CVS repositories. It allows you to add and synchronize projects with the
workspace and to inspect the revision history of resources:
CVS Repositories view—Shows the CVS repository locations that you have
added to your Workbench. Expanding a location reveals the main trunk
(HEAD), project versions and branches in that repository. You can further
expand the project versions and branches to reveal the folders and files
contained within them.
The context menu for this view also allows you to specify new repository
locations. Use the CVS Repositories view to checkout resources from the
repository to the Workbench, configure the branches and versions shown by
the view, view resource history, and compare resource versions.