WebSphere Studio Application Developer Version 5 Programming Guide part 60 pptx
Bạn đang xem bản rút gọn của tài liệu. Xem và tải ngay bản đầy đủ của tài liệu tại đây (332.09 KB, 10 trang )
564 WebSphere Studio Application Developer Version 5 Programming Guide
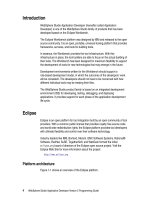
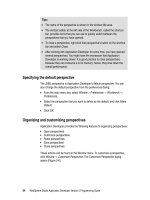
Figure 16-14 Inspection of Java expression
Select
Remove
from the context menu to remove expressions or variables from
the Expressions views. In the Display view just select the text and delete it.
Now step over the next statement:
Account[] accounts = banking.getAccounts(customerNumber);
Watch the array of accounts in the Variables view. You can expand accounts and
see their attributes (Figure 16-15).
Figure 16-15 Watching an array in the Variables view
Debugging a JSP
Step through the servlet code or click the
Resume
icon to progress to the
breakpoint in the JSP.
Figure 16-16 shows the Debug view with the JSP opened.
Note: If you have two JSPs in different Web applications, the wrong JSP
source may be displayed. Open the correct JSP to see its source code.
Chapter 16. Testing and debugging 565
Figure 16-16 Debugging a JSP
Watch the JSP variables in the Variables view. The same functions as for servlets
are available for JSP debugging. A JSP is compiled into a servlet. The difference
is that the debugger shows the JSP source code and not the generated Java
code.
When you step through JSP code, the debugger only stops at Java code; HTML
statements are skipped.
Resume execution to see the next Web page, then close the Debug perspective
and stop the server.
566 WebSphere Studio Application Developer Version 5 Programming Guide
Debugging on a remote WebSphere Application Server
It is possible to connect to and debug a Java program that has been launched in
debug mode on a remote application server, and the application server has been
configured to accept remote connections. Debugging a remote program is similar
to debugging a local Java program, except that the program has already been
launched and could be running on a remote host.
Configuring the remote server
The following steps explain how to configure WebSphere Application Server
version 5.0 to start in debug mode:
Start the application server.
Launch and log in to the Administrative Console.
In the left-hand frame, expand the
Servers
node and then select
Manage
Application Servers
. (Without Network Deployment installed, the link is simply
called
Application Servers.
) This opens the Application Servers page.
In the Application Servers page, all application servers are listed by Name
and Node. In the Name column, each server name appears as a link which,
when selected, takes you to configuration pages for the server. Follow the link
for the server that you wish to set up for debug mode.
On the
Configuration
tab, select
Debugging Service
in the Additional
Properties section to open the Debugging Service configuration page.
In the General Properties section of the Configuration tab, select the
Startup
check box. This enables the debugging service when the server starts.
Note the values of the JVM debug port (default 7777) and BSF debug port
(default 4444) fields, which are needed when connecting to the application
server with the debugger.
Click
OK
to make the changes to your local configuration, and then click
Save
to apply the configuration changes.
Proceed with other actions in the Administrative Console or log out, as
desired.
You must restart the application server before the changes that you have
made take effect.
Important: This section assumes that you have already deployed the
ItsoProGuide enterprise application containing the ItsoProGuideBasicWeb
project to a remote Application Server. For details on deploying to a remote
server, see Chapter 18, “Deploying enterprise applications” on page 607
Chapter 16. Testing and debugging 567
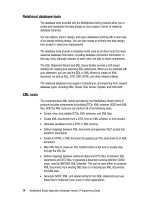
Attaching to remote server in Application Developer
In the server perspective, in the server configuration view, select
Servers
and
select
New -> Server and server configuration
from the context menu
(Figure 16-17).
Enter WebSphere version 5.0 remote server attach as the server name, and
select
WebSphere version 5.0 -> Remote Server Attach
as the server type. Click
Next
to proceed to the next page of the wizard.
Figure 16-17 Create new remote server attach
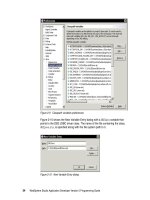
On the next page, enter the host name of the remote host where WebSphere
Application Server Version 5 is installed (Figure 16-18). This can be your own
machine (localhost) or another machine (such as vertex used for remote
testing).
568 WebSphere Studio Application Developer Version 5 Programming Guide
Figure 16-18 Specify the host for the remote server attach
Click
Next
to go to the next page of the wizard. There, you enter the port
numbers for JVM debug and for HTTP (Figure 16-19). The JVM debug port is the
port that Application Developer will use to communicate with the remote
application server during debugging. The HTTP port is the port used to send
HTTP commands through the Web browser.
Figure 16-19 Set ports for attaching to remote server
By default, the JVM debug port is set to
7777
in both the wizard and in the
Application Server. In this example, we are connecting to a remote application
server that uses port 9080 for HTTP (the internal HTTP server). If the external
HTTP Server is started as well, we can use port 80.
Click
Finish
to create the remote server attach. In the servers view, this new
server is now listed (Figure 16-20).
or hostname
Chapter 16. Testing and debugging 569
Figure 16-20 New remote server in servers view
Connecting to the remote server
To connect to the remote server, select
WebSphere version 5.0 remote server
attach
server and select
Debug
from the context menu. Alternatively, you may
click
Debug
.
You are taken to the debug perspective, and the remote server is connected
(Figure 16-21). You may now debug applications on the remote server.
Figure 16-21 Attached to remote server
Debugging on the remote server
The next step needed to debug on a remote server is to add the project to the
server. In server perspective, select the new
WebSphere version 5.0 remote
server attach
server and select
Add -> ItsoProGuide
.
The Server Configuration view reflects this change (Figure 16-22).
570 WebSphere Studio Application Developer Version 5 Programming Guide
Figure 16-22 ItsoProGuide project added to remote server attach
Next, we debug the application on the remotely attached server. Select the
ItsoProGuideBasicWeb in the Navigator view and
Debug on Server
. If you are
prompted to select the server to debug the application on, select
WebSphere
version 5.0 remote server attach
.
The index.html page of the Web application opens. You may now debug the
application in the same way you did in “Debugging a Web application” on
page 554. The only difference is that the application is running on a remote
server.
Where is the source code?
If you use the enterprise application as deployed in Chapter 18, “Deploying
enterprise applications” on page 607, that is, without source code, then you
cannot see the source that you are debugging. You can see the variables while
you step into code.
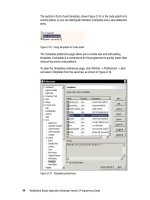
When entering a class, such as itso.basicweb.control.ListAccounts, you can
locate the source code as shown in Figure 16-23:
1. Select the line in the Debug view and
Change Source File
(context).
2. In the Debugger Source Selection window click
Browse
.
3. Deselect
Use default source lookup path
and click
Add Projects
. Select the
ItsoProGuideBasicWeb project and add it to the list.
4. Click
OK
to add the ListAccounts class to the list.
Note: The project should already be published on the remote server. Here we
are just configuring this in Application Developer to allow us to debug.
Tip: Make sure that the server preference of the project properties is set to
prompt; otherwise the preferred server is started!
Chapter 16. Testing and debugging 571
5. Select the ListAccounts line and click
OK
.
Figure 16-23 Attaching source code to the remote debugger
With the source code attached, you can debug the classes by stepping through
the code. Debugging on a remote server is basically the same as debugging on
the internal server.
Note: You may find response time quite slow. The more applications you have
deployed on the remote server, the slower is execution.
1
2
3
4
5
572 WebSphere Studio Application Developer Version 5 Programming Guide
Disconnecting from the remote server
To disconnect from a remote server, select the server in the Servers view and
click the disconnect button . Alternatively, select the server and select
Disconnect
from the context menu.
Communication with the remote server is terminated, and all threads in the
remote VM are resumed. Although the remote VM continues to execute, the
debug session is now terminated.
Summary
In this chapter we described the process of debugging Web applications on the
built-in server and on a remote WebSphere Application Server.
Let us conclude with a generic tip for debugging.
Tip: You can make your programs easier to debug by avoiding having multiple
statements on one line, and by attaching the source code to JAR files.
© Copyright IBM Corp. 2003. All rights reserved. 573
Chapter 17. JUnit and component
testing
JUnit is an open source testing framework for Java that is included in Application
Developer. It provides a simple way of expressing how you intend your code to
work. In this chapter, we explain what JUnit is, then go over the benefits of unit
testing and using a unit testing framework. Next we describe how to set up JUnit
for use in the Workbench and how to write tests with JUnit.
Following that, we introduce component testing within Application developer, and
show examples of creating, running, and reporting the results of Java and HTTP
component tests.
In this chapter, we cover the following topics:
What is JUnit?
Preparing for JUnit
Creating the test case
Running the test case
Component testing
17