Commodity Trading Advisors: Risk, Performance Analysis, and Selection Chapter 11 ppt
Bạn đang xem bản rút gọn của tài liệu. Xem và tải ngay bản đầy đủ của tài liệu tại đây (177.88 KB, 13 trang )
CHAPTER
11
220
CHAPTER 11
Managing Downside Risk in
Return Distributions Using Hedge
Funds, Managed Futures, and
Commodity Indices
Mark Anson
T
his chapter examines how alternative investments can provide downside
return protection in a portfolio composed of U.S. stocks and bonds.
Adding active, “skill-based” strategies such as hedge funds or managed
futures to the portfolio leads to important improvements in downside
returns, Sharpe ratio, and cumulative performance improvement, often
without reducing upside expected returns. In some cases, the same benefits
can be realized by adding passive commodity futures indices instead of skill-
based strategies.
INTRODUCTION
Every investor is concerned with downside risk management. This is why
diversification is a uniform portfolio tool. The better diversified an invest-
ment portfolio, presumably, the less the portfolio is exposed to months
where the return is negative.
Yet it is an unfortunate fact of life that when things hit the fan, they
tend to do it all at the same time. For example, a number of studies have
examined the correlation of the U.S. domestic and international equity
markets during periods of market stress or decline. The conclusion is that
the equity markets around the world tend to be more highly correlated
during periods of economic stress. (See Erb, Harvey, and Viskanta 1994;
c11_gregoriou.qxd 7/27/04 11:26 AM Page 220
Sinquefield 1996.) Therefore, international equity diversification may not
provide the requisite diversification when a U.S. domestic investor needs it
most—during periods of economic turmoil or decline.
The equity markets have become a single, global asset class for four
reasons.
1. Policymakers from major industrial nations regularly attend economic
summits where they attempt to synchronize fiscal and monetary policy.
The Maastricht Treaty and the birth of “Euroland” is an example.
2. Corporations are expanding their operations and revenue streams
beyond the site of their domestic incorporation.
3. The increased volume of international capital flows suggests economic
shocks will be felt globally as opposed to locally.
4. Nations such as Japan have undergone a “big bang” episode where
domestic investors have greater access to international investments.
This provides for an even greater flow of capital across international
boundaries. As a result, distinctions between international and domes-
tic stocks are beginning to fade.
This diversification vacuum is one reason why “skill-based” investing
has become so popular with investors. Hedge funds and managed futures
and other skill-based strategies might be expected to provide greater diver-
sification than international equity investing because the returns are
dependent on the special skill of the manager rather than any broad macro-
economic events or trends. However, diversification need not rely solely on
active skill-based strategies. Diversification benefits also can be achieved
from the passive addition of a new asset class such as commodity futures.
This chapter examines the downside portion of the return distribution
for a diversified portfolio of stocks and bonds. We then blend in hedge
funds, managed futures, and commodity futures to see how the distribution
changes when these alternative asset classes are added.
DESCRIBING DOWNSIDE RISK
The greatest concern for any investor is downside risk. If equity and bond
markets are indeed becoming increasingly synchronized, international
diversification may not offer the protection sought by investors. The ability
to protect the value of an investment portfolio in hostile or turbulent mar-
kets is the key to the value of any macroeconomic diversification.
Within this framework, investment strategies and asset classes distinct
from financial assets have the potential to diversify and protect an invest-
Managing Downside Risk in Return Distributions 221
c11_gregoriou.qxd 7/27/04 11:26 AM Page 221
222 RISK AND MANAGED FUTURES INVESTING
1
We argue that hedge funds represent alternative investment strategies within exist-
ing asset classes rather than a distinct asset class.
0
5
10
15
20
25
Return
Frequency
−8%–7%
−7%–6%
−6%–5%
−5%–4%
−4%–3%
−3%–2%
−2%–1%
−1%–0%
0%–1%
1%–2%
2%–3%
3%–4%
4%–5%
5%–6%
6%–7%
7%–8%
8%–9%
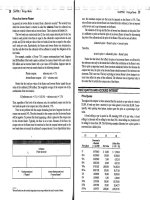
FIGURE 11.1 Frequency Distribution, Portfolio with 60/40 Stocks/Bonds
ment portfolio from hostile markets.
1
Hedge funds, managed futures, and
commodity futures are a good choice for downside risk protection.
To demonstrate this downside risk protection, we start with a standard
portfolio of stocks and bonds. We begin with a portfolio that is 60 percent
the Standard & Poor’s (S&P) 500 and 40 percent U.S. treasury bonds. In
Figure 11.1 we provide a frequency distribution of the monthly returns to
this portfolio over the time period 1990 to 2000.
Our concern is the shaded part of the return distribution, which shows
both the size and the frequency with which the combined portfolio of 60
percent S&P 500 plus 40 percent U.S. treasury bonds earned a negative
return in a particular month. It is this part of the return distribution that
corresponds to downside risk and that investors attempt to avoid or limit.
(See Strongin and Petsch 1996.)
We measure downside risk two ways: First we take the average return
in the shaded part of the return distribution presented in the figure. Second
we examine the number of months of negative returns associated with the
distribution of returns for the stock/bond portfolio.
Table 11.1 shows that the average monthly return to a 60/40
stock/bond portfolio in the shaded part of the distribution is −2.07 per-
cent. In other words, when the standard stock/bond portfolio earned a
negative return in any given month, on average the magnitude of that
return was −2.07 percent. These negative returns are exactly the downside
c11_gregoriou.qxd 7/27/04 11:26 AM Page 222
risk that investors want to reduce through diversification. In addition, the
number of months of negative returns is 42 out of 132, a frequency of
31.8 percent.
To demonstrate the synchronization of the global equity markets, we
blend in a 10 percent allocation to international stocks to our 60/40 U.S.
stock/U.S. bond portfolio. The exact allocation is 55 percent S&P 500, 35
percent U.S. treasury bonds, and 10 percent EAFE.
2
We then calculate the
return distribution for this new portfolio in the same manner by which we
produced the return distribution for the 60/40 U.S. stock/U.S. bond portfolio.
Table 11.1 provides the statistics regarding the return distribution for
the 55/35/10 U.S. stock/U.S. bond/international stock portfolio. Again, we
concentrate on the downside portion of the distribution. The average
monthly return to the downside portion of this distribution is −2.11 percent.
That is, a 10 percent allocation to international stocks provided an addi-
tional monthly exposure to downside risk of −4 basis points, on average.
Therefore, over this time period, an allocation to international stocks
did not diversify an investment portfolio comprised of domestic stocks and
bonds. In fact, a 10 percent allocation to international stocks increased the
exposure to downside risk. Also, the number of months with negative
returns increased to 44 (a 33.3 percent frequency) for the 55/35/10 U.S.
stock/U.S. bond/international stock portfolio from 42 months for our ini-
tial 60/40 U.S. stock/U.S. bond portfolio.
Managing Downside Risk in Return Distributions 223
TABLE 11.1 Downside Risk Exposure with Stocks and Bonds
Expected Standard Sharpe Average
Portfolio Composition Return Deviation Ratio Downside
60/40 US Stocks/US Bonds 0.91% 2.60% 0.177 −2.07%
55/35/10 Stocks/Bonds/EAFE 0.86% 2.66% 0.155 −2.11%
Number of Cumulative Cumulative Cumulative
Downside Downside Return Performance
Portfolio Composition Months Protection Potential Improvement
60/40 US Stocks/US Bonds 42 N/A N/A N/A
55/35/10 Stocks/Bonds/EAFE 44 −5.90% −6.60% −12.50%
2
Europe, Asia, and the Far East (EAFE) is an international stock index developed
and maintained by Morgan Stanley Capital International.
c11_gregoriou.qxd 7/27/04 11:26 AM Page 223
Finally, the addition of international equities to the standard 60/40
stock and bond portfolio resulted in a decline of the expected monthly
return down to 0.86 percent, a reduction in average monthly return of
5 basis points, with a commensurate decline in the associated Sharpe ratio.
Unfortunately, this is an example where international equity diversification
did not provide downside risk protection.
MANAGING DOWNSIDE RISK WITH HEDGE FUNDS
We have described and demonstrated the risk that investors attempt to
avoid through diversification. The question we now address is whether
hedge funds can help investors manage this risk. There has been some spec-
ulation as to whether hedge funds, in fact, can hedge an investment portfo-
lio. (See Asness, Krail, and Liew 2001.)
We use data on hedge funds from Hedge Fund Research Inc. (HFRI),
and include several categories of hedge funds in our portfolio mix to
determine how each style changed the return distribution for the blended
portfolio. We begin with funds of funds (FOF). Using the HFRI FOF
index, we construct a portfolio of 55 percent U.S. stocks, 35 percent U.S.
treasury bonds, and 10 percent FOF. We build the same frequency distri-
bution as presented in the exhibit and focus on the downside portion of
the return distribution.
For hedge FOF, we find that the average downside return was −1.90
percent. This indicates that, on average, the addition of hedge FOF to the
standard stock/bond portfolio provided 27 basis points of downside risk
protection. The number of downside months was the same at 42. Table
11.2 presents the results of the blended portfolios of 55 percent U.S.
stocks, 35 percent U.S. treasury bonds, and 10 percent hedge funds, for
each category of hedge fund.
We also consider what trade-off might be necessary to achieve this level
of downside protection. It is possible some upside potential was sacrificed
to provide the downside protection. In Table 11.1 we saw that the average
monthly return to our initial U.S. stock/U.S. treasury bond portfolio was
0.91 percent. In Table 11.2 we see that the average monthly return when
hedge fund of funds is added is 0.92 percent. Therefore, no upside return
potential was sacrificed to achieve the downside risk protection. Last, the
Sharpe ratio increased for the portfolio with hedge FOF.
We can calculate the cumulative performance improvement to the
stock/bond/hedge fund of funds portfolio from downside risk protection
and upside return enhancement by:
(−1.90% × 42 months) − (−2.07 × 42 months) + [(0.92% − 0.91%)
× 132 months] = 8.46%
224 RISK AND MANAGED FUTURES INVESTING
c11_gregoriou.qxd 7/27/04 11:26 AM Page 224
TABLE 11.2 Downside Risk Protection Using Hedge Funds
Number of Cumulative Cumulative Cumulative
Expected Standard Sharpe Average Downside Downside Upside Performance
Portfolio Composition Return Deviation Ratio Downside Months Protection Potential Improvement
60/40 US Stocks/
US Bonds 0.91% 2.60% 0.177 −2.07% 42 N/A N/A N/A
55/35/10 Stocks/
Bonds/FOF 0.92% 2.45% 0.191 −1.90% 42 7.14% 1.32% 8.46%
55/35/10 Stocks/
Bonds/Equity L/S 1.00% 2.54% 0.215 −2.03% 40 5.74% 13.88% 19.62%
55/35/10 Stocks/Bonds/
Convertible Arb 0.93% 2.42% 0.197 −1.88% 41 9.86% 3.57% 13.43%
55/35/10 Stocks/Bonds/
Market Neutral 0.92% 2.40% 0.195 −1.83% 42 10.08% 1.32% 11.40%
55/35/10 Stocks/Bonds/
Distressed Debt 0.95% 2.45% 0.204 −1.84% 43 8.25% 4.37% 12.62%
55/35/10 Stocks/Bonds/
Event Driven 0.95% 2.49% 0.201 −1.91% 42 6.72% 5.28% 12.00%
55/35/10 Stocks/Bonds/
Fixed Income Arb 0.90% 2.36% 0.189 −1.86% 41 10.68% −1.32% 9.36%
55/35/10 Stocks/Bonds/
Global Macro 0.97% 2.51% 0.207 −2.04% 40 5.34% 9.86% 15.20%
55/35/10 Stocks/Bonds/
Market Timing 0.95% 2.50% 0.198 −2.03% 40 5.74% 7.18% 12.92%
55/35/10 Stocks/Bonds/
Merger Arbitrage 0.93% 2.43% 0.196 −1.90% 41 9.04% 3.57% 12.61%
55/35/10 Stocks/Bonds/
Short Selling 0.85% 2.02% 0.198 −1.63% 37 26.63% −7.92% 18.71%
225
c11_gregoriou.qxd 7/27/04 11:26 AM Page 225
The cumulative performance improvement of 8.46 percent may be
split into two parts, the cumulative return earned from downside risk pro-
tection (7.14 percent) and the amount earned from upside return potential
(1.32 percent).
Table 11.2 presents several interesting results. In every case, the down-
side risk was reduced. The cumulative downside protection for each hedge
fund strategy is positive. Average monthly downside risk ranged from −1.63
percent for short sellers to −2.04 percent for global macro hedge funds. It
is not surprising that global macro hedge funds offered the least in down-
side protection because these funds tend to take significant market risk the
same as stocks and bonds. (See Anson 2000.) Also, it is not surprising that
short sellers offered the best downside risk protection because the very
nature of this strategy is to profit in months when the stock and bond mar-
kets perform poorly.
In every case but two (short sellers and fixed income arbitrage), the
average monthly return of the whole return distribution increased when
hedge fund strategies were added to the initial stock/bond portfolio. More
important, for every hedge fund strategy, the cumulative performance
improvement is positive. Also, Sharpe ratios improved uniformly for all
hedge fund strategies. Last, in only one strategy, distressed debt, did the
number of downside months increase (by one, to 43), but the average
downside return was much lower (−1.84 percent) compared to the stock/
bond portfolio.
In conclusion, we found that hedge funds uniformly offered downside
risk protection, and in many cases, this protection was considerable. Also,
in only two cases did this downside risk protection come at the sacrifice
of upside return potential (for short sellers and fixed income arbitrage),
but the cumulative downside protection received was sufficient to offset
the reduction of cumulative return potential. In every other instance,
downside risk protection was achieved in combination with increased
return potential.
Managing Downside Risk with Managed Futures
Managed futures refers to the active trading of futures contracts and for-
ward contracts on physical commodities, financial assets, and currencies.
The purpose of the managed futures industry is to enable investors to profit
from changes in futures prices. This industry is another skill-based style of
investing. Investment managers attempt to use their special knowledge and
insight in buying and selling futures and forward contracts to extract a pos-
itive return. These futures managers tend to argue that their superior skill
is the key ingredient to derive profitable returns from the futures markets.
226 RISK AND MANAGED FUTURES INVESTING
c11_gregoriou.qxd 7/27/04 11:26 AM Page 226
Within this framework, an asset class distinct from financial assets has
the potential to diversify and protect an investment portfolio from hostile
markets. It is possible that skill-based strategies such as managed futures
investing can provide the diversification that investors seek. Managed
futures strategies might provide diversification for a stock and bond port-
folio because the returns are dependent on the special skill of the commod-
ity trading advisor (CTA) rather than any macroeconomic policy decisions
made by central bankers or government regimes. (See, e.g., McCarthy,
Schneeweis, and Spurgin 1996; Schneeweis, Spurgin, and Potter 1997; and
Edwards and Park 1996.)
To analyze the impact of managed futures on the distribution of returns
in a diversified portfolio, we use the Barclay CTA managed futures indices.
There are four actively traded strategies: CTAs that actively trade in agri-
cultural commodity futures, CTAs that actively trade in currency futures,
CTAs that actively trade in financial and metal futures, and CTAs that
actively trade in energy futures. If managed futures can provide downside
protection, we would expect the average monthly downside return to be
smaller than that observed for our initial stock/bond portfolio.
Once again, we build a blended portfolio of 55 percent U.S. stocks, 35
percent U.S. treasury bonds, and 10 percent CTA strategy. We then develop a
frequency distribution of monthly returns over the period 1990 to 2000. In
Table 11.3 we present the results from the return distribution generated by
this CTA-blended portfolio for each CTA strategy. For example, for CTA
agriculture, the average downside return is −1.81 percent. This is an improve-
ment of 26 basis points over the average downside return observed with the
stock/bond portfolio. The number of downside months with CTA agriculture
managed futures added to the portfolio increased by one month to 43.
Unfortunately, some upside potential was sacrificed, as the expected
monthly return of the investment portfolio declined from 0.91 percent to
0.88 percent when CTA agriculture managed futures are added. Still, even
with the decrease in expected return for the portfolio, the reduction in
downside risk would have added 5.15 percent of cumulative performance
improvement to the portfolio over this time period:
[(−1.81% × 43 months) − (−2.07% × 42 months)]
+ [(0.88% − 0.91%) × 132 months] = 5.15%
Table 11.3 indicates that the 5.15 percent of cumulative performance
improvement can be split into 9.11 percent of cumulative downside protec-
tion and −3.96 percent of cumulative return potential. The table also pres-
ents results for the other CTA managed futures strategies. In every case,
Managing Downside Risk in Return Distributions 227
c11_gregoriou.qxd 7/27/04 11:26 AM Page 227
TABLE 11.3 Downside Risk Protection Using Managed Futures
Number of Cumulative Cumulative Cumulative
Expected Standard Sharpe Average Downside Downside Return Performance
Portfolio Composition Return Deviation Ratio Downside Months Protection Potential Improvement
60/40 US Stocks/
US Bonds 0.91% 2.60% 0.177 −2.07% 42 N/A N/A N/A
55/35/10 Stocks/Bonds/
CTA Agriculture 0.88% 2.37% 0.182 −1.81% 43 9.11% −3.96% 5.15%
55/35/10 Stocks/
Bonds/CTA Currency 0.90% 2.39% 0.190 −1.96% 39 10.50% 1.38% 11.88%
55/35/10 Stocks/Bonds/
CTA Financial & Metals 0.89% 2.39% 0.182 −1.95% 40 8.94% −0.86% 8.08%
55/35/10 Stocks/Bonds/
CTA Energy
a
0.92% 2.38% 0.197 −1.86% 31 6.24% −10.80% −4.56%
a
The downside protection and cumulative performance improvement for CTA energy is adjusted to reflect data ending in 1998.
228
c11_gregoriou.qxd 7/27/04 11:26 AM Page 228
downside risk protection is observed. However, with respect to CTA energy
managed futures, this downside risk protection came at the expense of sig-
nificant upside return potential; the cumulative Performance Improvement
is −4.56 percent.
3
These results highlight the concept that managed futures products
should not be analyzed on a stand-alone basis. The downside risk protec-
tion demonstrated by managed futures products is consistent with the
research of Scheeweis, Spurgin, and Potter (1996). Their true value is best
achieved in a portfolio context.
MANAGING DOWNSIDE RISK WITH COMMODITY
FUTURES
Hedge funds and managed futures fall into the category of skill-based
investing. That is, the returns derived from these strategies are dependent
on the active skill of the individual hedge fund or managed futures manager.
However, downside risk protection may be achieved without active man-
agement. To demonstrate, we blend passive commodity futures into the ini-
tial stock and bond portfolio.
A commodity futures index represents the total return that would be
earned from holding only long positions in an unleveraged basket of com-
modity futures. Commodity futures indices are constructed to be unlev-
eraged. The face value of the futures contracts are fully supported
(collateralized) either by cash or by treasury bills. Futures contracts are pur-
chased to provide economic exposure to commodities equal to the amount
of cash dollars invested in the index. Therefore, every dollar of exposure to
a commodity futures index represents one dollar of commodity price risk.
We consider four commodity futures indices: the Goldman Sachs Com-
modity Index (GSCI), the Dow-Jones/AIG Commodity Index (DJ-AIGCI),
the Chase Physical Commodity Index (CPCI), and the Mount Lucas Man-
agement Index (MLMI).
4
The GSCI, DJ-AIGCI, and the CPCI are unlever-
aged indices of long-only positions on physical commodities. The MLMI
Managing Downside Risk in Return Distributions 229
3
Data for the CTA energy managed futures index is available only through 1998.
Therefore, the data are not strictly comparable to the other managed futures indices,
particularly with respect to the number of downside months. However, in Table
11.3, the cumulative downside protection, cumulative return potential, and the
cumulative performance improvement have been adjusted to reflect the different
time period examined for this trading strategy.
4
More details regarding these indices can be found in Anson (2001).
c11_gregoriou.qxd 7/27/04 11:26 AM Page 229
differs from the other three indices in that it holds physical, financial, and
currency futures; it may invest long or short; and it follows a 12-month
trend-following rule.
It is the last difference, the 12-month moving-average rule, that is the
most distinguishing feature of the MLMI. The 12-month moving average is
designed to provide a mechanical rule to capturing price trends in the
futures markets. In this respect, the MLMI represents a good benchmark by
which to measure the returns associated with managed futures accounts
because it reflects a naive rule for active trading.
We perform the same portfolio construction rule as described in the
previous sections. We construct a portfolio that is 55 percent U.S. stocks,
35 percent U.S. treasury bonds, and 10 percent commodity futures index.
We then observe the distribution of returns and measure the downside risk
of the distribution. Table 11.4 presents the results.
Taking, for example, the MLMI, we observe that the average downside
return is −1.88 percent, a considerable improvement over the initial
stock/bond portfolio. We also observe that the stock/bond/MLMI portfolio
experiences two less months of downside performance (40) than that for
the stock/bond portfolio. Also, the expected return declines slightly to 0.90
percent per month. Therefore, the cumulative performance improvement is:
[(−1.88% × 40 months) − (−2.07% × 42 months)]
+ [(0.90% −0.91%) × 132 months] = 10.42%
The return amount of 10.42 percent may be split between cumulative
downside protection of 11.74 percent, and cumulative return potential of
−1.32 percent. Similar results are obtained for the other three indices. We
note that while the DJ-AIGCI provided downside risk protection, this pro-
tection came at the sacrifice of significant upside return potential.
5
The
cumulative performance improvement was −5.45 percent.
Last, we compare the MLMI to the CTA strategies presented above. We
note that the cumulative performance improvement with respect to the
MLMI exceeded that for every CTA strategy. Therefore, a simple trend-
following strategy such as that presented in the MLMI may provide bet-
ter downside protection and upside return potential than active managed
futures strategies.
230 RISK AND MANAGED FUTURES INVESTING
5
The DJ-AIGCI was available only through 1991 and therefore is not strictly compa-
rable to the other indices, particularly with respect to the number of downside months.
In Table 11.3 we adjust the cumulative downside protection, the cumulative return
potential, and the cumulative performance improvement for this shorter time period.
c11_gregoriou.qxd 7/27/04 11:26 AM Page 230
TABLE 11.4 Downside Risk Protection Using Passive Commodity Futures Indices
Number of Cumulative Cumulative Cumulative
Expected Standard Sharpe Average Downside Downside Return Performance
Portfolio Composition Return Deviation Ratio Downside Months Protection Potential Improvement
60/40 US Stocks/
US Bonds 0.91% 2.60% 0.177 −2.07% 42 N/A N/A N/A
55/35/10 Stocks/
Bonds/GSCI 0.90% 2.39% 0.187 −1.79% 43 9.97% −1.32% 8.65%
55/35/10 Stocks/
Bonds/CPCI 0.91% 2.38% 0.192 −1.86% 41 10.68% 0.09% 10.68%
55/35/10 Stocks/
Bonds/MLMI 0.90% 2.33% 0.191 −1.88% 40 11.74% −1.32% 10.42%
55/35/10 Stocks/
Bonds/DJ-AIGCI
a
0.92% 2.30% 0.205 −1.81% 37 4.09% −9.54% −5.45%
a
The downside protection and cumulative performance improvement for the DJ-AIGCI is adjusted to reflect data beginning in
1991.
231
c11_gregoriou.qxd 7/27/04 11:26 AM Page 231
CONCLUSION
We examined the downside return protection offered by international
stocks, hedge funds, managed futures, and commodity futures. We found
that hedge funds, managed futures, and commodity futures all offer down-
side protection to a traditional stock and bond portfolio. In most cases, this
protection accumulated to several percentage points over the time period
1990 to 2000. We did not, however, find any downside risk protection
offered by international stocks. International stocks were poor portfolio
diversifiers during the observed period.
232 RISK AND MANAGED FUTURES INVESTING
c11_gregoriou.qxd 7/27/04 11:26 AM Page 232