Commodity Trading Advisors: Risk, Performance Analysis, and Selection Chapter 16 pdf
Bạn đang xem bản rút gọn của tài liệu. Xem và tải ngay bản đầy đủ của tài liệu tại đây (177.23 KB, 13 trang )
294
CHAPTER
16
Choosing the Right CTA:
A Contingent Claim Approach
Zsolt Berenyi
M
anaged futures have enjoyed a significant increase as investments dur-
ing the last one and a half decades, both on a stand-alone basis and as
part of a well-diversified portfolio. Managed futures accounts, indeed, seem
to offer investors significant advantages not accessible elsewhere. Yet rank-
ing such investment opportunities either on an ex-ante or an ex-post basis
is still difficult because the risk and return structure of managed futures
accounts often differs from that of (more or less) common benchmarks, and
the risk structure of such investments may be unstable since CTAs may
change the risk exposure of the funds individually.
In this chapter we investigate the ex-post performance ranking of CTAs
based on a contingent claim performance approach. In this approach, the
performance of each managed futures fund is compared to individually cre-
ated benchmark assets having the same risk profile in terms of particular
higher moments. Benchmark assets are constructed (“replicated”) using the
S&P 500, options, and the risk-free asset. Using benchmark assets, we esti-
mate the efficiency gain or loss each CTA produces and analyze the robust-
ness of this kind of efficiency measurement with respect to the number of
moments used.
INTRODUCTION
Commodity funds, which are managed by commodity trading advisors
(CTAs), belong to the modern alternative investment class. Managed com-
modity funds (managed futures) are publicly offered investment vehicles
that invest in futures and options of a wide range of financial assets as well
as commodities and may employ a variety of leverage-creating techniques.
c16_gregoriou.qxd 7/27/04 11:36 AM Page 294
Choosing the Right CTA 295
Managed futures accounts offer investors significant advantages not
accessible elsewhere, due to their unconventional investment strategies.
These forms of investment offer, in much the same way other modern alter-
native investment forms do, both diversification advantages and return pro-
files different from traditional investments.
From this background, research on alternative investments, predomi-
nantly on CTAs and hedge funds, has mushroomed. A particularly interest-
ing field continues to be the performance evaluation of those alternative
investments. Because they may offer highly nonnormal and optionlike return
profiles, traditional performance measures used elsewhere suffer from seri-
ous disadvantages (i.e., they produce controversial results and, in particular,
may be subject to gambling behavior). The performance of CTAs and hedge
funds remains, however, a particularly important issue because, in spite of
the somewhat controversial theoretical results on persistence in CTA perfor-
mance (see, e.g., Schneeweiss 1996), investors evaluate investments, at least
partially, based on past performance.
This chapter reviews the performance of a series of managed futures
funds with a contingent claim–based efficiency measure, which is based on
a moment-based performance evaluation methodology. First, we investigate
the efficiency of CTAs as stand-alone investments based on the compari-
son to option-based strategies. The basis for the comparison is the risk pro-
file of the given CTA asset, where risk is defined as some set of statistical
moments. Then we compare the moment-based efficiency measures to find
out whether using a more complete replication pays off in terms of mone-
tary advantages and accuracy.
MOMENT-BASED EFFICIENCY MEASURE
Distributional Performance Evaluation
Assessing performance in case of opaque or continuously changing portfo-
lios such as managed funds remains difficult because finding or creating a
proper benchmark is still not an easy task. Here we propose a methodology
in which the performance of CTA funds will be measured using syntheti-
cally created benchmarks. The main idea is to compare any investment
portfolio (especially those with nonnormal return distributions like man-
aged funds) to artificial, so-called replicating benchmarks possessing risk
characteristics similar to the primary investment.
The idea that investors compare portfolios based on some statistical
(or other) risk profile should not be very surprising. In the most funda-
mental consideration about investments, investors buy risky time, that is,
c16_gregoriou.qxd 7/27/04 11:36 AM Page 295
296 PROGRAM EVALUATION, SELECTION, AND RETURNS
a particular portfolio return profile provided by holding risky assets for a
predefined period. Throughout this chapter, the distributional features of
return streams will be called risk characteristics (valid for the particular
holding period).
Return distributions certainly can be arbitrary, not just normal (as
would be the usual assumption in case of equity investments). Going one
step further, the particular portfolio payoff and return distribution are lim-
ited in their shape by the available investment opportunities. Performance
measurement, consequently, denotes the evaluation of the particular risk
characteristics of the individual payoff profiles.
The payoff distribution pricing model of Dybvig (1988a), provides a
related perspective. Dybvig develops a pricing framework for assets with
arbitrary return distributions. The basic idea of his work is that agents min-
imize the cost of any one-period return distribution, regardless of the fac-
tors that drive state probabilities. He calls the price of the minimum cost
portfolio for any return distribution the distributional price (to distinguish
it from the normal asset price). That is, economic agents compare return
distributions resulting from any kind of investment opportunity directly.
This approach neglects the underlying structure of portfolios, consider-
ing it as irrelevant for performance comparison. However, because investors
usually use cash returns from the noncash investments for consumption, we
argue it is legitimate to do so. That is, it is of no relevance whether a port-
folio contains common stocks or hedge funds, because only the distribution
of the investment returns for the holding period is important for the per-
formance assessment. This approach also may be justified by acknowledg-
ing factors like investment barriers and relative illiquidity.
Contingent Claim–Based Performance Evaluation
The possibility to create and transform arbitrary return distributions is an
important property of options that has been known and used by practi-
tioners for a long time (cf. Reback 1975). Reback (1975) states that deriv-
ative assets are able to alter the pattern of any portfolio return to create any
desired shape of return distribution. Thus it is possible to create optioned
portfolios mimicking other portfolios in risk characteristics by using options.
Because the return distribution of optioned portfolios can be shaped
arbitrarily, they can be used as a common benchmark asset. Thus, the use of
optioned markets as the reference point suggests extending the performance
evaluation framework to multiple asset classes as well. Doing this facilitates
the broadening of the classical one asset view to more asset classes compet-
ing with each other. In addition, also multimanager funds theoretically could
c16_gregoriou.qxd 7/27/04 11:36 AM Page 296
Choosing the Right CTA 297
be analyzed with optioned markets, if the underlying structure of the invest-
ments remains immaterial.
Indeed, the use of optioned benchmark portfolios for performance
measurement purposes itself is not a novel idea. The work of Dybvig
(1988a, b) also signifies implicitly that optioned portfolios can be compared
to portfolios of other asset classes, regardless of the underlying asset.
Glosten and Jagannathan (1994) propose the use of options to re-create con-
tingent claims for mutual fund performance evaluation. Dynamic strategies,
in much the same way as options, also can be used to create any particular
payoff profile. Recently Amin and Kat (2001) have proposed a similar meth-
odology to evaluate hedge fund returns in using path-independent dynamic
strategies that have positive correlation with the underlying index. The
novelty of this chapter in proposing optioned portfolios for benchmark
purposes lies, however, in reducing the risk characteristics of the replicating
portfolio to a handful of higher statistical moments.
EFFICIENCY GAIN/LOSS MEASURE
This section proposes using so-called replicating portfolios for benchmark
purposes. Replicating portfolios are optioned portfolios designed to repro-
duce the risk characteristics of a given asset by combining a benchmark
asset with options and the risk-free asset.
The expected return on a replicating portfolio for a given risk shape (of
a particular asset) will be called the replicating return. The replicating return
can be interpreted as the alternative return an investor may achieve if, hold-
ing the risk exposure (defined here in terms of return variance, skewness, and
a number of higher moments) constant, she chooses to invest in the optioned
market instead of investing in a given portfolio.
The efficiency gain/loss measure or excess replicating return is simply
the difference between the expected return of the asset under investigation
and that of its synthetic benchmark asset. The expected return of this repli-
cating benchmark asset will be termed as the replicating return.
1
This asset-specific replicating return embodies, at the same time, the
minimum acceptable return on investments having the same risk structure,
and serves thus as a natural benchmark. That is, investors always have the
1
Certainly the replicating benchmark asset will have to be computed to achieve
maximum expected return within the set of possible replicating assets with the same
(moment-based) risk characteristics.
c16_gregoriou.qxd 7/27/04 11:36 AM Page 297
alternative of being paid the return of the replicating optioned portfolio.
Consequently, this replicating return has to be exceeded by other investments
exhibiting similar risk characteristics.
The efficiency gain/loss measure (the excess replicating return) takes the
form
ERR
p
= E(r
p
) − RR(r
p
) (16.1)
where E(r
p
) = expected return on portfolio p
RR(r
p
) = expected replicating return
The excess replicating return can be directly interpreted as an efficiency
gain, if it is positive, or an efficiency loss, if it is negative. If the replicating
optioned return is higher than the expected return for an arbitrary CTA port-
folio, this underlying asset offers an inferior performance (compared to the
benchmark asset). That is, the comparable investment in form of an optioned
portfolio offers a higher expected return for the same risk characteristics
of returns. The fund’s shareholder would do better with a different fund (of
course, as stand-alone investment only). The excess replicating return pro-
vides a simple measure in assessing whether a portfolio outperformed others
on an ex-post basis.
This measure is in a close relationship with the excess return measure
proposed by Ang and Chau (1979), which is an alpha-like composite per-
formance ratio. An important distinction is that, in the replicating case,
individual portfolios do not have to possess the same systematic risk char-
acteristics as the benchmark asset. It is sufficient if both share the same
return distribution shapes.
Construction of Replicating Portfolios
As defined earlier, replicating portfolios are portfolios that have the same
risk structure in terms of some statistical moments (of order three and
higher) as the portfolio being assessed. The foundation for including repli-
cating portfolios in the performance assessment is the assumption that port-
folios can be created to “mimic” the risk structure of the underlying asset
as benchmarks.
The present replicating framework will be termed partial, because only
a reduced set of the return characteristics (the moments) is used for de-
scribing any return distributions, thereby reducing the return distribution’s
dimensionality.
298 PROGRAM EVALUATION, SELECTION, AND RETURNS
c16_gregoriou.qxd 7/27/04 11:36 AM Page 298
It is very important to note that the term “replication” as we use it does
not intend to create the same payoff profile in terms of identical probabil-
ity distributions, nor does it intend to create portfolios having the same pay-
off in every possible state of nature.
For the construction of individual replicating portfolios, we used the
Standard and Poor’s (S&P) 500 index as underlying. Based on the assump-
tion that returns from the index are independent and follow a lognormal
distribution—a simplification that greatly facilitates the use of contingent
claim–based performance evaluation but is not essential—we calculated
prices for a specified number of Black-Scholes call options. Considering
only call options ensures that asset returns are not linearly dependent. For
the sake of simplicity, a holding period of one year is assumed.
In the next step, we used nonlinear programming for generating returns
on replicating portfolios, with variance and (a predefined number of) higher
statistical moments being set to that of the CTA under investigation.
This approach provides a relatively simple and robust means for calcu-
lating individual benchmark returns. This idea parallels the work of Amin
and Kat (2001). They propose a point-by-point optimization algorithm
with a 500-pins-setting, that is, they match 500 separate points of the
return distribution, to calculate hedge fund efficiency gains/losses.
The optimization algorithm that produces replicating portfolio weights
x
i
, can be formulated:
(16.2)
subject to
target variance
target skewness
(16.3)
and the constraints on the portfolio weights
where E(r
i
) = expected return on asset i
s
0
2
s
0
3
= target values for variance and skewness, respectively.
The constraints in equation 16.3 can be expanded to include moments
of order higher than three.
x
i
i
∑
= 1
ss
3
0
3
=
σσ
2
0
2
=
Max
xi
i
i
i
ZxEr=
∑
()
Choosing the Right CTA 299
c16_gregoriou.qxd 7/27/04 11:36 AM Page 299
MARKET DATA USED
For the testing, we used CTA data publicly available from TradeView
(www.tradeview.com). The chosen data set contains 110 CTAs with a
monthly return history of five years, from January 1998 to December 2002.
From the monthly returns, “semi ex-ante” annual discrete returns were
generated with a bootstrap-like methodology i.e., drawing 12 samples with
replacement from the set of monthly data, using 1,000 repetitions for each
fund. This bootstrapping methodology is in the vein of the technique applied
by Ederington (1995).
We used the Standard and Poor’s monthly return series as underlying.
As proxy for the risk-free rate, we took the one-month U.S. Dollar (USD)
London Interbank Offered Rate (LIBOR).
RESULTS
Nonnormality of Returns
We test for nonnormality of returns with the Jarque and Bera (1987) test
(see Greene 2000). Analyzing the samples, we find that the null hypothesis
of normally distributed returns cannot be rejected at the 1 percent level for
only 14 cases (11 percent of the observations) and at the 5 percent level
for only 11 cases (8.7 percent). Clearly, the sample of CTA funds is highly
nonnormal. This should underline the need for a performance measure that
accounts for nonnormality of returns.
Portfolio Efficiency Rankings
by the Excess Replicating Return
The excess replicating return (ERR) is, in much the same way as the Sharpe
ratio, a composite—risk-adjusted—performance measure. It is risk adjusted
because the ERR is calculated always to a given level of risk. Thus risk
adjustment takes place indirectly by applying an additive, not multiplica-
tive, rule.
The ERR, again, denotes the return differential between the expected
return of a particular asset and its replicating counterpart. It is designed to
assess the value added by the portfolio manager—that is, the efficiency gain
or loss. Negative values would mean that the investor is better off buying
the same risk structure through options instead of investing in the given
asset/CTA and vice versa.
300 PROGRAM EVALUATION, SELECTION, AND RETURNS
c16_gregoriou.qxd 7/27/04 11:36 AM Page 300
Choosing the Right CTA 301
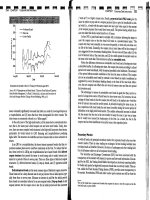
We investigated the efficiency of the CTA sample. Figures 16.1 and
16.2 summarize the main results of the analysis. The first diagram displays
the excess replicating returns for the second moment case (variance only),
sorted by magnitude. It is evident that, for the sample being investigated,
CTAs provided a risk-adjusted performance that is—to a large extent—not
accessible on the stock markets. That is, about 80 percent of the CTAs per-
form better than the replicating optioned portfolios based on the S&P 500.
Nonetheless, two factors have to be considered.
1. In the time period investigated, the S&P delivered an annual return of
about 5.6 percent, which is barely higher that the estimated risk-free
rate (4.2 percent).
2. For technical reasons, we have not accounted for possible survivorship
bias, which may be expected to have a substantial impact on the over-
all performance.
Figure 16.2 displays the excess replicating returns for the nine-moment
case, but in the same ranking order, as in Figure 16.1. It is noticeable that
the basic performance characteristics of the CTAs are mirrored fairly well
with the two-moment method; this suggests that a large part of the repli-
cating return is attributable to the variance itself. Yet we certainly can also
ascertain some significant discrepancies between the rankings of the two
cases that should be subject to a closer look.
−30%
−20%
−10%
0%
10%
20%
30%
40%
50%
60%
Ranked CTA
2nd Moment Case
Efficiency Gain/Loss
FIGURE 16.1 Efficiency Gain/Loss Measure (Variance Only) for the CTA Samples,
Sorted
c16_gregoriou.qxd 7/27/04 11:36 AM Page 301
302 PROGRAM EVALUATION, SELECTION, AND RETURNS
Rank Correlation Statistics
Let us assume that the more complete description of the CTA return distri-
butions (the use of more moments) enables a more robust and exact per-
formance measurement. We would like to investigate the overall properties
of the moment-based replicating measures and determine how the ranking
result is affected by calculating replicating returns with a lower number of
moments. Using the optimization algorithm, we obtained eight portfolios,
M2 through M9, by specifying 2 through 9 moments in the constraints,
respectively. We then replicated returns in each portfolio and obtained the
Sharpe ratio and ERR measures of the replicated returns. Next, we calcu-
lated rank correlations (Spearman correlations) between the particular
ERR measures and Sharpe ratio, which evaluates the closeness of the rank-
ings produced by the different methods of performance evaluation. Table
16.1 sums up the results of the calculation. As can be seen, the moment-
based measures lie within a limited range, that is, the rankings provided by
them are very close to each other: The rank correlations are always higher
than 0.99. It is also noticeable that the rank correlation between the Sharpe
ratio and the moment-based measures is high but lower than the rank cor-
relation between the moment-based measures themselves.
Then we repeated the analysis with a slightly different frame, drawing
small samples repeatedly and comparing the percentage of identical deci-
sions regarding the best possible CTA. Not surprisingly, when drawing sam-
−30%
−20%
−10%
0%
10%
20%
30%
40%
50%
60%
Ranked CTA
Efficiency Gain/Loss
9th Moment Case
FIGURE 16.2 Efficiency Gain/Loss Measure for the CTA Samples, Sorted by
Rankings of the Variance Only Case
c16_gregoriou.qxd 7/27/04 11:36 AM Page 302
TABLE 16.1 Simple Rank Correlation Between Particular Performance Measures
Sharpe Ratio ERR M2 ERR M3 ERR M4 ERR M5 ERR M6 ERR M7 ERR M8 ERR M9
Sharpe Ratio 1.0000
ERR M2 0.7675 1.0000
ERR M3 0.7669 0.9999 1.0000
ERR M4 0.7696 0.9997 0.9998 1.0000
ERR M5 0.7595 0.9981 0.9984 0.9985 1.0000
ERR M6 0.7575 0.9974 0.9978 0.9979 0.9995 1.0000
ERR M7 0.7497 0.9952 0.9956 0.9956 0.9964 0.9966 1.0000
ERR M8 0.7439 0.9958 0.9961 0.9958 0.9959 0.9959 0.9956 1.0000
ERR M9 0.7288 0.9935 0.9939 0.9935 0.9930 0.9928 0.9927 0.9958 1.0000
303
c16_gregoriou.qxd 7/27/04 11:36 AM Page 303
TABLE 16.2 Ratio of Identical Decisions (Sample Size 10, 1,000 Times) with Particular Performance Measures
Sharpe Ratio ERR M2 ERR M3 ERR M4 ERR M5 ERR M6 ERR M7 ERR M8 ERR M9
Sharpe Ratio 1
ERR M2 0.353 1
ERR M3 0.394 1.000 1
ERR M4 0.409 0.998 1.000 1
ERR M5 0.354 0.922 0.963 0.943 1
ERR M6 0.362 0.941 0.948 0.949 0.994 1
ERR M7 0.374 0.861 0.903 0.902 0.896 0.919 1
ERR M8 0.336 0.92 0.917 0.937 0.903 0.949 0.937 1
ERR M9 0.326 0.871 0.918 0.928 0.918 0.931 0.899 0.945 1
304
c16_gregoriou.qxd 7/27/04 11:36 AM Page 304
Choosing the Right CTA 305
ples of 10 CTAs 1,000 times, it turns out that the moment-based replicating
measures produce also very similar results, as it can be seen in Table 16.2.
How Many Moments?
Thus the different moment-based replicating measures produce very simi-
lar results. The most important question is: How many moments are
sufficient to reproduce the results of the quasi-benchmark (i.e., the nine-
moment case)?
To cast some light on this question, we calculated the absolute as well
as the relative contributions of every higher moment to the replicating
returns. That is, we tried to determine whether the absolute as well as the
relative contribution (i.e., the absolute difference between two correspon-
ding moment replicating returns divided by the level of the replicating
return) diminishes as the number of moments increases.
As Table 16.3 shows, this is, unfortunately, not the case. Somewhat sur-
prisingly, the moments 7, 8, and 9 have all an average relative contribution
to the replicating return of over 10 percent. This fact indicates that consid-
ering the first few moments only may provide a good correlation in the
ranking properties but not necessarily a good approximation in terms of
absolute value of the replicating return.
Put differently, for such nonnormal cases, we found only weak evi-
dence for supporting the use of only the variance in the calculation of repli-
cating returns.
TABLE 16.3 Contribution of Higher Moments to the Replicating Returns
Moment 3 Moment 4 Moment 5 Moment 6
Absolute
contribution −0.062% −0.032% −0.261% −0.069%
Relative
contribution −1.540% −0.730% −5.974% −1.348%
Moment 7 Moment 8 Moment 9
Absolute
contribution −0.602% −0.477% −0.422%
Relative
contribution −15.530% −11.985% −13.001%
c16_gregoriou.qxd 7/27/04 11:36 AM Page 305
CONCLUSION
We investigated the ranking properties of the moment-based replicating
efficiency measures on a sample of CTA managed funds.
Summing up, we found that (neglecting any possible survivorship bias)
using these measures, the majority of the funds investigated had a perform-
ance superior to the S&P 500. We also found that the moment-based repli-
cating measures of efficiency gain/loss produce results very close to each
other in terms of rank correlation. In addition, the Sharpe ratio and the
moment-based efficiency measures produce a higher rank correlation but a
lower rate of identical decisions.
However, we also found that the higher moments have a high absolute
and relative contribution to the replicating return. This fact implies that
although the replicating measures may be very useful for ranking assets
with nonnormally distributed returns, the magnitude of the replicating
returns is not robust to the number of moments used in the replication. In
particular, important contributions to replicating returns will be omitted if
moments of low order only (like the variance) are used. Thus, further
research is needed to evaluate the usefulness of approximations of the true
replicating return based on two (or three) moments.
306 PROGRAM EVALUATION, SELECTION, AND RETURNS
c16_gregoriou.qxd 7/27/04 11:36 AM Page 306