How to Display Data- P5 potx
Bạn đang xem bản rút gọn của tài liệu. Xem và tải ngay bản đầy đủ của tài liệu tại đây (165 KB, 5 trang )
12 How to Display Data
The baseline that groups are compared to can be further obscured in other
less deliberate ways than by simply changing the origin. Figure 2.4 shows the
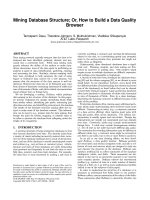
age-standardised death rates from different causes in the UK from 1996 to
2005, for women. The death rates from the different causes have been stacked
on top of each other for each year. In practice only the deaths from COPD
and the total deaths from all seven causes can be compared simply over time.
This is because the baseline for the other causes changes with time. It is diffi -
cult to decide for the majority of other causes whether there are any changes
over time (with the possible exception of cerebrovascular disease and heart
disease). These data might be more usefully displayed by presenting the dif-
ferent rates as different lines, with the same Y-axis, as shown in Figure 2.5.
2.4 Don’t order the data by value
For categorical data with no intrinsic order to the categories, a particu-
larly good way to obscure any patterns in the data is to order the categories
arbitrarily, for example alphabetically. Figure 2.6 shows the population size,
in 2004, for 20 European countries.
4
The countries are displayed in alpha-
betical order. In this case, while the most populous country, Germany, can
be readily seen, for countries of similar sizes, such as France, Italy and the
1998
292
290
288
286
Age-standardised death rate (per million)
284
282
1999 2000 2001
Year
2002 2003 2004
Figure 2.3 Age-standardised death rates from lung cancer (per million) for women
in England and Wales for the years 1998–2004, using the European Standard
Population.
3
How to display data badly 13
Figure 2.4 Age-standardised death rates from different causes in the UK by year
(1996–2005), for women; death rates stacked on top of each other cumulatively.
3
1996
0
500
1000
1500
2000
2500
3000
1997
Age-standardised death rate (per million)
1998 1999 2000 2001
Year
2002 2003 2004 2005
Lung cancer
Breast cancer
Ovarian cancer
Diabetes
Heart disease
COPD
Cerebrovascular disease
Figure 2.5 Age-standardised death rates from different causes in the UK by year
(1996–2005), for women; death rates plotted individually.
3
1996
0
200
Age-standardised death rate (per million)
400
600
800
1000
1200
1997 1998 1999 2000
Year
2001 2002 2003 2004 2005
Lung cancer
Breast cancer
Ovarian cancer
Diabetes
Heart disease
Cerebrovascula
r
disease
COPD
UK, it is not immediately obvious which has the largest population. It would
be better to order these data by size as shown in Figure 2.7, where it can be
easily seen that of the three countries mentioned above, Italy has the small-
est population, France the largest and the UK lies between these two.
5
It then
becomes much clearer how each country relates to the others in Europe with
respect to population size.
14 How to Display Data
2.5 Use images to show linear contrasts
Figure 2.8 shows a chart contrasting the average earnings of UK doctors and
nurses, by using symbols, money bags in this case, to represent the actual
Austria
Belgium
Czech Republic
Denmark
Finland
France
Germany
Greece
Hungary
Ireland
Italy
The Netherlands
Norway
Poland
Portugal
Slovenia
Spain
Sweden
Switzerland
UK
020406080
Po
p
ulation (millions)
100
Figure 2.6 Population (in millions), in 2004, for 20 European countries ordered by
alphabetically.
4
Figure 2.7 Population (in millions), in 2004, for 20 European countries ordered by size.
4
Germany
France
UK
Italy
Spain
Poland
The Netherlands
Greece
Portugal
Belgium
Czech Republic
Hungary
Sweden
Austria
Switzerland
Denmark
Finland
Norway
Ireland
Slovenia
0204060
Population (millions)
80 100
How to display data badly 15
data values.
6
This type of chart is a particular favourite of newspapers.
Rather than displaying the actual numbers, solid fi gures or images are used
instead. While this again produces the ‘gee-whiz’ graph it should be discour-
aged for scientifi c work because the eye automatically contrasts areas rather
than the heights of the symbols, and area increases as the square of height
and thus makes the contrast more impressive. These fi gures are best dis-
played by giving the actual numbers.
Summary
In order to display data badly you need to:
• Display as little information as you can.
• Obscure what information you do show with distracting additions (also
known as chart junk).
• Use a poor scale or suppress the origin.
• Use pseudo-three-dimensional charts.
• Use colour or pattern gratuitously.
• Use symbols or images of different sizes to represent the frequencies for
different groups.
References
1 Huff D. How to lie with statistics. London: Penguin Books; 1991.
2 Wainer H. How to display data badly. The American Statistician 1984;38:137–47.
Nursing/midwifery
(
q
ualified)
Average earnings
Doctors in training
and their e
q
uivalents
Figure 2.8 UK average earnings (in £s), in 2004, of qualifi ed nurses/midwives
compared to doctors in training and their equivalents.
6
16 How to Display Data
3 Mortaility statistics: cause. Report No.: 32. London: Offi ce for National Statistics;
2006.
4 Schott B. Schott’s almanac. London: Bloomsbury; 2006.
5 Ehrenberg ASC. A primer in data reduction. Chichester: John Wiley & Sons; 2000.
6 NHS staff earnings survey: August 2004. Leeds: NHS Health and Social Care
Information Centre; 2005.