Matthias Doepke - Marcroeconomics - Chapter 12 pdf
Bạn đang xem bản rút gọn của tài liệu. Xem và tải ngay bản đầy đủ của tài liệu tại đây (199.1 KB, 20 trang )
Chapter 12
The Effect of Government
Purchases
In this chapter we consider how governmental purchases of goods and services affect the
economy. Governments tend to spend money on two things: wars and social services.
Barro’s Figure 12.2 shows that expenditures by the U.S. government have comprised a
generally increasing fraction of GNP since 1928, but even today that fraction is nowhere
near the peak it attained during WWII. This pattern is generally repeated across countries.
The taste for social services seems to increase with national wealth, so the governments of
richer countries tend to spend more, as a fraction of GDP, than the governments of poorer
countries, especially during peacetime. Of course, there are exceptions to this pattern.
We will examine government spending in three ways:
1. We shall consider the effect of permanent changes in government spending in order
to think about the secular peacetime increases in spending;
2. We shall consider temporary changes in government spending in order to think about
the effect of sudden spikes like wars;
3. We shall begin an analysis of the effect of government social programs. Since govern-
ment social programs (unemployment insurance, social security systems) are inextri-
cably linked to tax systems, we will defer part of our analysis to the next chapter.
Since we have yet to fully discuss tax policy, for this chapter we will assume that the gov-
ernment levies a very special kind of tax: a lump-sum tax. That is, the government an-
nounces a spending plan and then simply removes that amount of money from the budget
of the representative household. As we shall see in the next chapter, this kind of tax system
does not distort the household’s choices.
112
The Effect of Government Purchases
In the Barro textbook, the government budget constraint, in addition to lump sum taxes,
also contains fiat currency. In this chapter we will assume that the government does not
use the printing press to finance its purchases. In later chapters (especially Chapter 18) we
will examine this effect in much greater detail.
12.1 Permanent Changes in Government Spending
Assume that the government announces a permanent level of government spending, ,to
be levied each period. What is the role of these government expenditures? The govern-
ment provides productive services, such as a court system for enforcing contracts and an
interstate highway system for quickly and cheaply transporting goods. The government
also provides consumption services such as public parks and entertainment spectacles such
as trips to the moon and congressional hearings. We focus on the first role.
How should we model the productive services provided by the government? We shall
analyze a model under two assumptions:
1. Government spending at some constant rate
,
2. The effect of government spending
is augmented by the level of capital, ,so
output
increases by the amount .
In the first case, $100 of government spending increases output by 100
regardless of the
current level of capital, while in the second case, the same $100 boosts output much more
in nations with more capital.
The representative household lives forever and has preferences over consumption streams
=0
given by:
(
=0
)=
=0
( )
Where 0and 0. Here 0 1 reflects impatience. In addition, to keep the
algebra nice, we will say that:
=
1
1+
Here is the discount factor and the discount rate.
The household has access to a productive technology mapping capital
into private out-
put
of:
=
12.1 Permanent Changes in Government Spending
113
Total output (and hence income) of the household will be the sum of private output and
government-augmented output,
. Government augmented output will take on one of
two values:
= or:(12.1)
=(12.2)
Equation (12.1) corresponds to the case of government spending affecting total output the
same amount no matter what the level of capital. Equation (12.2) corresponds to the case
of government spending affecting total output more when the level of capital is high. We
shall examine the effect of
on capital accumulation, aggregate output and consumption
under both of these assumptions.
The household must split total income
= + into consumption , investment
and payments to the government of . Recall that we assumed the government would sim-
ply levy lump-sum taxes. Now we are using that assumption. The household’s resource
constraint is thus:
+ +(12.3)
Finally, there is a law of motion for the capital stock
. Each period, a proportion of the
capital stock vanishes due to physical depreciation, so only the remaining (1
)proportion
survives into the next period. In addition, capital may be augmented by investment. Thus
capital evolves according to:
+1
=(1 ) +(12.4)
We assume that the representative household begins life with some initial stock of capital
0
0.
We are interested in writing
as a function of next period’s capital stock
+1
. Combining
equations (12.3) and (12.4) gives:
= +(1 )
+1
+ or:(BC1)
= +(1 )
+1
+(BC2)
The differences between the two equations arises from which version of the government
technology we use, equation (12.1) or (12.2).
Analysis with Equation (BC1)
Let us begin our analysis with the first version of the government spending technology,
equation (12.1). Thus we are using as the relevant budget constraint equation (BC1). The
114
The Effect of Government Purchases
household’s problem becomes:
max
+1
=0
=0
[
+(1 )
+1
(1 )
]
We take first-order conditions with respect to the choice of next period’s capital
+1
in
some typical period
. Remember that
+1
appears in two periods, and +1:
( )[ 1] +
+1
(
+1
)
1
+1
+1 =0
For all =0 1 .Here is given by equation (BC1) above. Simplifying produces:
( )= (
+1
)[
1
+1
+1 ](12.5)
For simplicity (and as in other chapters) we choose not to solve this for the transition path
from the initial level of capital
0
to the steady state level
SS
, and instead focus on char-
acterizing the steady state. At a steady state, by definition the capital stock is constant:
=
+1
=
SS
As a result:
=
+1
=
SS
and:
=
+1
=
SS
=
SS
Equation (12.5) at the steady-state becomes:
(
SS
)= (
SS
)[
SS
1
+1 ]
Simplifying, and using the definition of as 1 (1 + )produces:
1+
=
SS
1
+1
We now solve for the steady-state capital level:
SS
=
+
1
1
Notice immediately that, under this formulation of government spending the steady state
capital level is independent of government spending. As we shall see in the next chapter,
this is a direct consequence of the lump-sum tax technology. If the government had to use
a distortionary tax,
SS
would be affected by .
Given
SS
, it is easy to calculate the other variables that the household controls: steady-
state private income,
SS
, consumption
SS
, and investment,
SS
. From the technology, we
know that
= ,so:
SS
=
SS
12.1 Permanent Changes in Government Spending
115
Total output (GDP) is private output
plus government output ,or:
SS
=
SS
+
Consumption is, in this case, determined by the budget constraint equation (BC1). At the
steady-state, then:
SS
=
SS
+(1 )
SS SS
(1 )
We can simplify this to produce:
SS
=
SS SS
(1 )
At the steady-state, the household must be investing just enough in new capital to offset
depreciation. Substituting into the law of motion for capital provides:
SS
=
SS
Now we are ready to determine the effect of government spending on total output, con-
sumption and the capital level. When we think about changing
we are comparing two
different steady states. Thus there may be short-term fluctuations immediately after the
government announces its new spending plan, but we are concerned here with the long-
run effects.
Notice immediately that:
SS
=0(12.6)
SS
= ( + )= and:(12.7)
SS
= (1 )(12.8)
That is, total output is increasing in
but consumption is decreasing in if 1. Thus
1isanexampleofcrowding out. Think of it this way: the government spends $1000 on
a new factory, which produces 1000
units of new output. The household pays the $1000
in taxes required to construct the new factory, does not alter its capital level and enjoys the
extra output of 1000
as consumption. If 1 the household has lost consumption. Thus
output has increased and consumption has decreased.
Why do we automatically assume that
1? This is equivalent to saying that the gov-
ernment is worse at building factories than the private sector. The government may be
the only institution that can provide contract enforcement, police and national defense, but
long history has shown that it cannot in general produce final goods as effectively as the
private sector.
One final note before we turn our attention to the effect of production augmenting gov-
ernment spending. Government transfer payments, in which the government takes money
116
The Effect of Government Purchases
from one agent and gives it to another, fit nicely into this category of expenditure. Trans-
fer payments have absolutely no productive effects, and the government institutions re-
quired to administer the transfer payments systems will prevent the perfect transmission
of money from one agent to another. Since we are working with a representative consumer,
transfer payments appear as taxes which are partially refunded.
Analysis with Equation (BC2)
Now let us consider the effect of government spending whose benefits are proportional to
capital stock. We will use precisely the same analysis as before. except that now consump-
tion
as a function of capital and
+1
and government spending will be given by
equation (BC2) above.
The household’s problem becomes:
max
+1
=0
=0
[
+(1 + )
+1
]
We take first-order conditions with respect to the choice of next period’s capital stock
+1
in some typical period . Remember the trick with these problems:
+1
appears twice in
the maximization problem, first negatively in period
and then positively in period +1:
( )[ 1] +
+1
(
+1
)
1
+1
+1 + =0
For all =0 1 . is given by equation (BC2). Simplifying produces:
( )= (
+1
)[
1
+1
+1 + ](12.9)
Compare this with the previous simplified first-order condition, equation (12.5) above. No-
tice that in equation (12.5) the government spending term
does not appear. Here it does.
This should alert us immediately that something new is about to happen. As before, we
assume a steady state and characterize it. At the steady state:
(
SS
)= (
SS
)[
SS
1
+1 + ]
Using our definition of as 1 (1 + ) this becomes:
1+
=
SS
1
+1 +
Hence the steady-state capital level is:
SS
=
+
1
1
12.1 Permanent Changes in Government Spending
117
Notice immediately that, under this formulation of government spending the steady-state
capital level is increasing in government spending. If the government were forced to fi-
nance its spending with a distortionary tax this result might not go through.
Given the steady-state capital level, it is easy to calculate the steady-state levels of total
output
SS
, consumption
SS
and investment,
SS
. Since the steady-state capital level,
SS
,is
now affected by
, both public output and private output areinturnaffectedby
. Given the production function, we see that:
SS
=
SS
+
SS
From the budget constraint equation (BC2) above, we see that the steady state, consump-
tion is:
SS
=
SS SS
(1
SS
)
As before, the household must be investing just enough to overcome depreciation, to keep
the capital level constant:
SS
=
SS
Now we can reconsider the effect of government spending on total output, consumption
and the capital level. Some of these derivatives are going to be fairly involved, but if we
break them down into their constituent pieces they become quite manageable.
Begin by defining:
+
Note that:
=
+
The steady-state capital stock is:
SS
=
1
1
so the derivative of the steady-state capital stock with respect to is:
SS
=
1
1
1
1
1
Plugging in yields:
SS
=
1
1
1
1
1
+
=
1
1 +
1
1
=
1
1 +
SS
(12.10)
118
The Effect of Government Purchases
Armed with this result we can tackle the other items of interest. First, consider the effect of
increased spending on aggregate output:
SS
= (
SS
+
SS
)
=
(
SS
+
SS
)
=
SS
1
SS
+
SS
=
SS
1
1
1 +
SS
+
1
1 +
SS
=
1
1 +
[
SS
+
SS
]
=
1
1 +
SS
+
SS
(12.11)
Compare the effect of government spending on aggregate output here with the effect of
government spending on aggregate output when government spending simply augments
output directly, equation (12.7) above. Notice that while previously every dollar of govern-
ment spending translated into
dollars of extra output no matter what the output level,
now government spending is more productive in richer economies.
Finally, we turn our attention to consumption. Recall that before, for
1, consump-
tion decreased as government spending increased, that is, consumption was crowded out.
Now we shall see that, while consumption may be crowded out, it will not necessarily be
crowded out. In fact, in rich economies, increases in government spending may increase
consumption. Once again, this result will hinge to a certain extent on the assumption of a
perfect tax technology. Begin by writing consumption as:
SS
=
SS SS
+
SS
so:(12.12)
SS
= (
SS
+( )
SS
)
=
SS
1
SS
+( )
SS
+
SS
1
=
SS
1
1
1 +
SS
+( )
1
1 +
SS
+
SS
1
=
1
1 +
[
SS
+( )
SS
]
+
SS
1
The first two terms are certainly positive. The question is, are they large enough to out-
weigh the
1? Even if 1, for large values of this may indeed be the case.
12.1 Permanent Changes in Government Spending
119
Increasing Returns to Scale and Government Spending
Thus we have seen that the effect of government spending depends crucially on assump-
tions about how it is transformed into output. In the next chapter we will also see that it
depends on how the government raises the revenue it spends.
Our second assumption about technology, embodied in equation (BC2), generated some
exciting results about government spending. It seems that, if the world is indeed like
the model, there is a potential for governments to provide us with a free lunch. Take a
closer look at equation (12.2). If we assumed that the representative household controlled
directly (through representative government, for example) what level would it choose?
Ignore the dynamics for a moment and consider the household’s consumption
given
that it has chosen some level of
and :
( )= +
Now suppose the household doubles its inputs of and , so it is consuming some
amount
:
(2 2 )=2 +4 2 2
For sufficiently large values of and it is easy to see that:
2
In other words, by doubling and , the representative household could more than dou-
ble net consumption. This is the standard free lunch of increasing returns to scale, in this
case jointly in
and . In the real world, are there increasing returns to scale jointly
in government spending and capital? In certain areas this is almost certainly true. For
example, by providing sewage and water-treatment services the government prevents epi-
demics and lowers the cost of clean water to consumers. This is a powerful direct benefit.
This direct benefit is increasing in the population concentration (a small village probably
would do fine with an outhouse, while 19th-century Chicago was periodically decimated
by Cholera epidemics before the construction of the sanitary canal), and in turn encour-
ages greater capital accumulation. No one business or household in 18th century Chicago
would have found it worthwhile to build a sewage system, so it would have been diffi-
cult for private enterprise alone to have provided the improvements. Furthermore, since
the Chicago sewage system depends in large measure on the Sanitary Canal, which had to
be dug across previously-private land, it may have been impossible to build without the
power of eminent domain.
1
Unfortunately, there are few such clear-cut cases of increasing returns to scale combined
with the requirement of government power. Why should a city government construct a
stadium to lure sports teams? To build it, the government has to tax citizens who may
experience no direct or indirect benefit.
1
For more information on Chicago’s sewer works, see Robin L. Einhorn, Property Rules: Political Economy in
Chicago, 1833-1872.
120
The Effect of Government Purchases
Transitions in the Example Economies
We have so far ignored the problem of transitions in order to concentrate on steady-state
behavior. But transition dynamics, describing the path that capital, consumption and the
interest rate take as an economy transitions from low capital to the steady state capital
level can be extremely interesting. In this subsection we will study transition dynamics by
numerically simulating them on a computer.
Consider an example economy in which
=04, =01, =025, =0075, =01and
=1 (1 + ). Using the technology from equation (BC1), the steady-state capital level is
SS
=16089, using the better technology from equation (BC2), the steady-state capital level
is
SS
=22741. Notice that, since =04, government spending as a fraction of output in
these example economies is 0
3436 and 0 3033, respectively.
What happens if we endow the representative consumer with an initial capital stock
0
=
0
03, which is far below the eventual steady-state level? We know generally that there will
be growth to the steady-state, but little more.
The evolution of the capital stock under both assumptions about the government spend-
ing technology is plotted in Figure (12.1). The solid line gives the evolution with the high-
return government spending technology (that is, equation (BC2)), while the dotted line
gives the evolution with the low-return technology (that is, equation (BC1)). Notice that
the economy based on equation (BC2) is initially poorer and slower-growing than the other
economy. This is because, at low levels of capital, government spending is not very pro-
ductive and is a serious drag on the economy. As capital accumulates and the complemen-
tarities with government spending kick in, growth accelerates and the economy based on
equation (BC2) surpasses the economy based on equation (BC1).
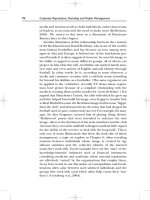
In the same way, the time path of consumption is plotted in Figure (12.2). Finally, the real
interest rate in these economies is plotted in Figure (12.3). For more about how to calculate
the real interest rate in these models, please see the next section.
The Real Interest Rate
Now we turn our attention to the effect of permanent changes in government spending
on the equilibrium real interest rate in this model. Recall that in infinite-horizon capital
accumulation models, like the one we are studying here, it usual to assume there is a closed
economy, so the representative household does not have access to a bond market. In this
setting, the equilibrium interest rate becomes the interest rate at which the household, if
offered the opportunity to use a bond market, would not do so. In other words, there is, as
usual, no net borrowing or lending in a closed economy. We will refer to this condition as
a market-clearing condition in the bond market, or simply market-clearing for short.
We shall see that, during the transition period while capital is still being accumulated, the
12.1 Permanent Changes in Government Spending
121
0 5 10 15 20 25 30 35 40
0
0.5
1
1.5
2
2.5
Capital Stock
time t
K(t)
Figure 12.1: Evolution of capital stock.
The solid line gives
assuming that
government purchases affect output as in
equation (BC2) and the dotted line as-
suming they affect output as in equa-
tion (BC1).
0 5 10 15 20 25 30 35 40
0
0.1
0.2
0.3
0.4
0.5
0.6
0.7
Consumption
time t
C(t)
Figure 12.2: Time path of consumption.
The solid line gives
assuming that
government purchases affect output as in
equation (BC2) and the dotted line as-
suming they affect output as in equa-
tion (BC1).
0 5 10 15 20 25 30 35 40
0
0.2
0.4
0.6
0.8
1
1.2
1.4
1.6
Interest rate
time t
r(t)
Figure 12.3: Time path of interest rates.
The solid line gives
assuming that gov-
ernment purchases affect output as in
equation (BC2) and the dotted line as-
suming they affect output as in equa-
tion (BC1).
interest rate is decreasing in the capital stock. At the steady state, however, when consump-
122
The Effect of Government Purchases
tion is constant, the equilibrium interest rate will just be , the discount rate. Because per-
manent changes in government spending lead eventually to a new steady-state, at which
consumption is constant, permanent changes in the level of government spending will not
affect the equilibrium interest rate at the steady state.
The easy way to see this is to notice that if the representative household has some endow-
ment stream
=0
, and the interest rate satisfies:
1+
=
1
( = )
(
+1
=
+1
)
then there will be no net borrowing or lending across periods. In our case the endowment
stream
=0
is the result of a capital accumulation process which eventually reaches a
steady state at which
=
+1
=
SS
. Hence at a steady-state:
1+
SS
=
1
(
SS
)
(
SS
)
=
1
=1+ so:
SS
=
No matter what the eventual steady-state level of capital, at the steady-state consumption
becomes smooth, which forces the equilibrium interest rate to the discount rate. If
SS
the household would wish to save on the bond market (consuming below endowment
and thus violating market-clearing) and if
SS
then then the household would wish to
borrow on the bond market (consuming above endowment and again violating market-
clearing).
12.2 Temporary Changes in Government Spending
Studying temporary changes in government spending requires studying the transition
path of an economy from one steady-state to another and then back again. Imagine an
economy of the type we studied in the previous section, in which the government is spend-
ing some low but constant amount
0
each period. As time goes forward, the capital stock
and consumption converge to their steady-state levels and the real interest rate converges
to the discount rate. Suddenly the government must fight an expensive war. Government
spending shoots up to some high level
1
for a relatively short period of time. During the
war, the capital stock will begin to transition to the steady-state implied by the new spend-
ing level
1
. Since wars tend to be short it may never get there. When the war is over,
government spending drops to its accustomed pre-war level of
0
, and the capital stock
slowly returns from wherever it was when the war ended to the old steady-state.
Analytically determining the trajectories of capital, consumption and the interest rate un-
der temporary shifts in government spending is beyond the scope of this chapter. How-
ever, we can easily simulate them numerically, using precisely the same techniques we did
to study the growth experience of economies.
12.2 Temporary Changes in Government Spending
123
All of the figures that follow make the following assumptions: That in periods 1-5 the
economy is at its pre-war steady-state, that in periods 6-15 the economy is in a war, with
increased government spending, and in periods 16-30 the economy is back at peace. Dur-
ing the war the economy begins its transition to a war steady-state, but the relatively short
duration of the war prevents it from ever reaching that steady-state. After the war the econ-
omy transitions slowly back to its pre-war steady-state. We are also assuming that in the
last period of peace before the war (period 5) the population learns of the impending war,
and that in the last period of the war before peace begins again (period 15) the population
learns of the coming peace.
The parameters used here are exactly those used in the section on transitions in the example
economies (page 120) above. In addition, the peacetime spending level is
0
=0andthe
wartime spending level is
1
=04.
The evolution of the capital stock under both assumptions about the government spending
technology is plotted in Figure (12.4). The solid line gives the evolution with the high-
return government spending technology (that is, equation (BC2)), while the dotted line
gives the evolution with the low-return technology (that is, equation (BC1)).
5 10 15 20 25 30
1.5
1.6
1.7
1.8
1.9
2
2.1
2.2
Capital Stock
time t
K(t)
Figure 12.4: Time path of the capital stock
before, during and after a war. The sol-
id line gives
assuming that govern-
ment purchases affect output as in equa-
tion (BC2) and the dotted line assuming
they affect output as in equation (BC1).
In the same way, the time path of consumption is plotted in Figure (12.5). Finally, the
real interest rate in these economies is plotted in Figure (12.6). It is surprising to note that
sometimes the real interest rate is negative. From the section on the real interest rate (on
page 120 above) we know that, given consumption decisions
and
+1
that must
124
The Effect of Government Purchases
satisfy:
=
1
( )
(
+1
)
1
If
+1
is quite small relative to ,then (
+1
) will be large relative to ( )and might
be negative. A negative real interest rate occurs in precisely those periods in which today’s
consumption must be high relative to tomorrow’s, as in the last period of peacetime before
the war, in order to prevent agents from carrying wealth forward into the next period. At
the ends of wars, when today’s consumption is low relative to tomorrow’s (think March,
1945), real interest rates are quite high, to dissuade borrowing.
5 10 15 20 25 30
0.6
0.7
0.8
0.9
1
1.1
Consumption
time t
C(t)
Figure 12.5: Time path of consumption
before, during and after a war. The
solid line gives
assuming that govern-
ment purchases affect output as in equa-
tion (BC2) and the dotted line assuming
they affect output as in equation (BC1).
5 10 15 20 25 30
−0.2
0
0.2
0.4
0.6
0.8
Interest rate
time t
r(t)
Figure 12.6: Time path of the interest rate
before, during and after a war. Note
the very low interest rates prevalent in
the last period before the war and the
generally higher interest rates during the
war. The solid line gives
assuming
that government purchases affect output
as in equation (BC2) and the dotted line
assuming they affect output as in equa-
tion (BC1).
In general, Barro presents evidence that, during wartime, interest rates tend to increase.
That fits well with the experience of the second model presented here, the one in which
government purchases affect output as in equation (BC2).
12.3 Social Security
125
12.3 Social Security
The Social Security system is one of the largest components of U.S. government spending.
There are some interesting theoretical issues associated with it that are worth examining.
Social Security is an old-age pension system, in which young workers pay into a general
fund with a payroll tax of about 7% of wages and old retirees receive payments from this
same general fund. Thus although it maintains the illusion of being a national savings
scheme (and many politicians and voters are convinced that it is exactly that) is in fact an
unfunded or pay-as-you-go pension scheme. In an unfunded pension system, payments to
retirees are paid for by taxes levied on the current young.
Other countries have adopted funded pension schemes, which are essentially forced savings
systems. In a funded pension system, young workers are taxed, with the proceeds going to
an individual account, invested in some securities (the precise type of investment mix, and
whether these investments are under the control of the government or the worker vary
from country to country). When workers become old and retire, they draw down their
accumulated stock of savings.
Consider a world in which there are two types of agents: Young workers who earn an
amount
in their working years, and old retirees who earn nothing. This is clearly a vast
simplification over reality, since, in particular, the retirement date is exogenous. However,
even this simple model will help us think clearly about pension schemes. A generation
born in period
will have preferences over consumption while young
0
and old
1
of:
(
0 1
)=2
0
+2
1
Where 0 1 reflects a preference for consumption while young.
Each period
there are new young workers born, each of whom produces with cer-
tainty in their youth. The youth population
evolves as:
+1
=(1+ )
There is a bond market which pays a constant, riskless, real interest rate of 0, paid
“overnight” on savings. Where does this bond market come from? We will not say here,
leaving it simply outside of the scope of the model. If you are bothered by this, how-
ever, imagine that a certain portion of the population, instead of being workers, are en-
trepreneurs, who will accept funds from workers, use them as capital in a productive
process of some kind, and then use the output from that production to repay the work-
ers (now old) with interest. The interest rate gets set as the result of competition among
entrepreneurs for funds.
126
The Effect of Government Purchases
Funded Pension Systems
Begin with an analysis of a funded system. The government levies a tax rate of on young
workers’ income
, taking . Since the young workers do not affect ,thisisequivalentto
a lump-sum tax. The government invests
on behalf of the young workers, realizes the
common real rate of return
on it, and returns it to the agents when they are retired. In
addition, workers of generation
may save an amount 0 in the bond market on their
own. Assume that
is small relative to the savings needs of agents. This will prevent them
from attempting to set
0, and will save us having to check corner conditions.
Given
and , we can calculate an agent’s expected consumption path
0
1
:
0
=(1 )(12.13)
1
=(1+ )( + )(12.14)
Because the government has taken
from the agent while young, he is left only with (1
) to split between consumption while young and own-savings, . When old, the agent
gets the benefit of both public (government forced) savings
and private (own) savings
. Consumption while old is merely the total volume of savings times the prevailing gross
interest rate 1 +
.
We are now ready to find
for this agent. The agent maximizes (
0
1
)where
0
as
afunctionof
is given by equation (12.13) and
1
by equation (12.14). Thus the agent
solves:
max
2 (1 ) +2 (1 + )( + )
Assuming that the constraint 0 will not be binding, we take the derivative of this
function with respect to
and set it to zero to find the optimal value of .So:
1
(1 )
+
1+
+
=0
We cross-multiply to find:
(1 + ) (1 ) = +
[
2
(1 + )][(1 ) ]= +
[
2
(1 + )](1 ) =[1+
2
(1 + )] and:
2
(1 + ) [1 +
2
(1 + )] = [1 +
2
(1 + )]
Dividing both sides by 1 +
2
(1 + )produces:
=
2
(1 + )
1+
2
(1 + )
(12.15)
12.3 Social Security
127
Substituting back into equations (12.13) and (12.14) gives us optimal consumption choices
in each period:
0
=
1
1+
2
(1 + )
1
=
2
(1 + )
2
1+
2
(1 + )
Notice that the government-forced public savings policy does not affect the agent’s choice
of savings. If
increases, the agent will merely decrease his choice of .
If the government sets
to exactly the agent’s desired savings rate, that is:
=
2
(1 + )
1+
2
(1 + )
then = 0 and all saving is done by the government.
Unfunded Pension Systems
Now we turn our attention to unfunded pension systems (also known as pay as you go
systems), in which the government taxes the current young workers to pay the current
old retirees. The key insight will be that unfunded pension systems will dominate funded
pension systems if the population is growing quickly enough.
In period
there are young workers and
1
old retirees who were born in period 1
and are now old. If the government taxes each young worker an amount
it raises total
revenue of:
=
If it distributes this equally among the old, each old agent will get
1
or:
1
1
=
1
Recall that the population is growing at a rate so that =(1+ )
1
.Hence:
1
= (1 + )
Notice that, since the population growth rate is constant at , does not vary with time,
so we write merely
.
Consider again the agent’s budget constraints as a function of
and , equations (12.13)
and (12.14) above, only now using the unfunded pension system:
0
=(1 ) and:
1
=(1+ ) +(1+ )
128
The Effect of Government Purchases
We could solve this explicitly for as a function of in much the same way that
we did above (in fact, this is a good exercise to do on your own), but instead we are will
simply provide intuition for the agent’s choices.
If
= then the agent is no longer indifferent between public and private savings. If ,
then public savings make the agent worse off. As
increases more and more of the agent’s
wealth is being used in a relatively low-return activity. Agents would complain bitterly to
their government about this (apparent) waste of their money.
On the other hand, if
, then the agent would prefer to save entirely by using the
government pension system. Agents would demand that the system be increased until
their private savings (in the relatively inefficient bond market) fell to zero.
Exercises
Exercise 12.1 (Easy)
For each of the following questions provide a brief answer.
1. (True, False or Uncertain) All things being equal, there is more total savings under a
funded than under an unfunded pension system.
2. For the U.S., at the moment, is
?
3. Name three items in the Federal budget that account for more than 20% of all gov-
ernment expenditures (each).
Exercise 12.2 (Easy)
Assume that every dollar spent by the government augments total output by
,where0
1. Assume that total private output is fixed at and that the government pays for its
expenditures with lump-sum taxes. What is the absolute maximum amount of government
spending,
? At this level, how much does the household consume and invest?
Exercise 12.3 (Moderate)
For this exercise assume that the representative household lives for only two periods and
has preferences over consumption streams
0 1
given by:
(
0
)+ (
1
)
where =1(1 + )and 0. Here assume that 0 0. The household has a
constant endowment stream
which is not affected by government spending. Any
government spending must be paid for by lump-sum taxes on the representative house-
hold. There is no capital stock. This is a closed economy. Answer the following questions:
1. Assume that the government spends the same amount
each period. What is the
market-clearing interest rate,
0
?
Exercises
129
2. Assume that the government spends different amounts in each period,
0 1
and
that
0 1
. Now what is the market-clearing interest rate
0
?
3. Which is greater,
0
or
0
? Does this fit with your intuition about the effect of tempo-
rary government spending?
Exercise 12.4 (Moderate)
Consider again the model of Section 12.3 above. Calculate
explicitly when the return on
public savings is
and the return to private savings is . Assume = and is small.
Exercise 12.5 (Moderate)
Grace lives for two periods. She has preferences over consumption streams
0 1
of:
(
0 1
)=ln(
0
)+ ln(
1
)
where 0 1. Grace is endowed with one unit of time each period. In the first period,
she can divide her time between working in a low-wage job at a wage of
= 1 or attending
hours of school. Grace earns nothing while in school, but she is augmenting her human
capital. In the second period of life, Grace spends all of her time at her high-wage job,
earning
1
where
1
is her human capital and 1. Human capital is augmented by
schooling by the simple formula
1
= , so given a choice for , Grace earns 1 while
young and
while old. There is no bond market.
The government is interested in helping Grace go to school. It levies a lump-sum tax of
on Grace when she is young and uses it to augment her human capital so that
1
= +
where 0. Answer the following questions:
1. Assume
= 0. Find Grace’s optimal schooling choice and human capital
1
.
2. Assume
0. Find Grace’s optimal schooling choice and human capital
1
.
Remember that
1
is affected directly by . Show that is decreasing in and that
1
is decreasing in is 1.
3. Now assume that the human capital augmentation is a a straight subsidy from the
government, that is, the government has taxed someone else to pay for Grace’s
schooling, so she is not taxed at all while young. Now how do
and
1
vary with
?
Variable Definition
Household savings at the end of period (if posi-
tive), or household debt (if negative).
Consumption by the household (in period ).
Specific consumption levels used in an example.
=0
Sequence of household endowments over time.
Government spending (usually assumed to be
constant).
Household’s investment in the capital stock at
time
.
0
Capital stock in period (initial capital stock).
Output from private productive processes.
Output from government production which is re-
funded to the household.
Total output in period ,thesumofprivateand
government output.
Household discount factor, usually assumed to
be 1
(1 + ).
Household discount rate.
Depreciation rate of capital.
(
=0
) Household’s preferences over an entire stream of
consumptions.
( ) ( ) Household utility in period from consumption
in that period of
.
0
1
Consumptionofgenerationborninperiod
while young and old.
Population in period .
Growth rate of population.
Real interest rate.
Income tax rate.
Household income.
Household gross private savings.
The government’s realized revenue from taxes on
young.
Government’s per-capita payments to the old,
,inperiod +1.
Table 12.1: Notation for Chapter 12