A textbook of Computer Based Numerical and Statiscal Techniques part 44 pdf
Bạn đang xem bản rút gọn của tài liệu. Xem và tải ngay bản đầy đủ của tài liệu tại đây (126.63 KB, 10 trang )
416
COMPUTER BASED NUMERICAL AND STATISTICAL TECHNIQUES
And, the equation of the line of regression of
y
on
x
is
() ()
.
y
x
yy r xx
σ
−= −
σ
(ii)
Let
1
m
and
2
m
be the slopes of
()
i
and
()
ii
respectively.
Then,
1
.
y
x
m
r
σ
=
σ
and
2
.
y
x
r
m
σ
=
σ
.
Therefore,
()
12
12
tan
1
mm
mm
−
θ=
+
()
()
()
()
2
2
22
2
1
.
1
yy
xy
xx
xy
y
x
r
r
r
r
σσ
−
σσ
−
σσ
==
σ+σ
σ
+
σ
Proved.
Example 9. The lines of regression of
x
on
y
and
y
on
x
are respectively x = 19.13 – 0.87y
and y = 11.64 – 0.50x. Find:
(a) The mean of x - series;
(b) The mean of y- series;
(c) The correlation coefficient between
x
and
y
.
Sol. Let the mean of x-series is x
–
and that of y-series be y
–
.
Since the lines of regression pass through
()
,xy
, we have:
x
–
= 19.13 − 0.87 y
–
or x
–
+ 0.87 y
–
= 19.13 (1)
and
11.64 0.50yx=−
or
0.50 11.64xy+=
(2)
On solving
()
1
and
()
2
, we get
15.94x =
and
3.67.y =
Therefore, mean of x-series = 15.94
And mean of y-series = 3.67
Now, the line of regression of
y
on
x
is:
11.64 0.50yx=−
∴
0.50
yx
b
=−
Also, the line of regresson
x
on
y
is:
19.13 0.87xy=−
∴
0.87
xy
b
=−
∴
()()
0.50 0.87 0.435 0.66
yx xy
rbb
==−−==−
Clearly,
r
is taken as negative, since each one of
yx
b
and
xy
b
is negative.
Example 10. Out of the following two regression lines, find the line of regression of
x
on
y
:
2x + 3y = 7 and 5x + 4y = 9.
CURVE FITTING
417
Sol. Let
237xy+=
be the regression line of
x
on
.y
Then, 5x + 4y = 9 is the regression line of y on x.
Therefore
237xy+=
and
549xy+=
⇒
37
22
xy=− +
and
59
44
yx=− +
⇒
3
2
xy
b
=−
and
5
4
yx
b
=−
⇒
35
24
xy yx
rbb
==−−−
[3
,,
xy yx
rb b
have the same sign]
15
1,
8
=− <−
which is impossible.
Therefore our choice of regression line is incorrect.
Hence, the regression line of
x
on
y
is 5x + 4y = 9. Ans.
Example 11. Find the correlation coefficient between
x
and
y
, when the lines of regression are:
2x – 9y + 6 = 0 and x – 2y + 1 = 0.
Sol. Let the line of regression of
x
on
y
be 2x – 9y + 6 = 0
Then, the line of regression of
y
on
x
is
210xy−+=
.
Therefore
2960xy−+=
and
210xy−+=
⇒
9
3
2
xy=−
and
11
22
yx=+
⇒
9
2
xy
b
=
and
1
2
yx
b
=
⇒
91 3
·1,
22 2
xy yx
rbb
==×=>
which is impossible.
So, our choice of regression line is incorrect.
Therefore, the regression line of
x
on
y
is
210xy−+=
.
And, the regression line of
y
on
x
is
2960xy−+=
.
⇒
21xy=−
and
22
93
yx=+
⇒
2
xy
b
=
and
2
9
yx
b
=
⇒
22
.2
93
xy yx
rbb
==×=
Hence, the correlation coefficient between
x
and
y
is
2
3
. Ans.
Example 12. The equations of two lines of regression are: 3x + 12y = 19 and 3y + 9x = 46. Find
418
COMPUTER BASED NUMERICAL AND STATISTICAL TECHNIQUES
(i) the mean of x-series
(ii) the mean of y-series
(iii) Regression coefficient
xy
b
and b
yx
,
(iv) Correlation coefficient between
x
and y.
Sol. Let the mean of x-series be
x
and that of y-series be
y
. Then, each of the given lines passes
through
(,)xy
.
Therefore
31219xy+=
(1)
And
93xy+
= 46 (2)
On solving (1) and (2), we get
x
= 5 and
y
=
1
3
.
Therefore mean of x-series is 5 and mean of y-series is
1
3
.
Now, let the line of regression of x on y be 3x + 12y = 19
Then, the line of regression of y on x is 3y + 9x = 46.
Therefore 3x + 12y = 19 and 3y + 9x = 46
⇒ x =–4y +
19
3
and y = –3x +
46
3
⇒ b
xy
= –4 and b
yx
= –3
⇒ r =
––4–3
afaf
=
–2 3
< –1, which is impossible.
∴ Our choice of regression line is incorrect.
Consequently, the regression line of x on y is 3y + 9x = 46.
And, the regression line of y on x is 3x + 12y = 19.
Therefore 3y + 9x = 46 and 3x + 12y = 19
⇒
146
39
xy=− +
and
119
412
yx=− +
⇒
11
,
34
xy yx
bb
=− =−
and
11 1 3
34 6
23
r
−−
=− −= =
(Because
r
, b
xy
and b
yx
have the same sign).
Example 13. You are given the following data:
Series
x
y
Mean 18 100
standard deviation 14 20
Correlation coefficient between
x
and
y
is 0.8. Find the two regression lines.
Estimate the value of
,y
when
x
is 70.
Estimate the value of
,x
when
y
is 90.
CURVE FITTING
419
Sol. Given that
18, 100,xy==
14, 20
xy
σ= σ=
and
0.8r =
.
Therefore the line of regression
y
on
x
is :
()
.
y
x
yyr xx
σ
−= −
σ
or
()
()
0.8 20
100 18
14
yx
×
−= −
or
1.14 79.41yx=+
When
70x =
, we have:
(1.14 70 79.41) 159.21y =×+ =
And, the line of regression of
x
on
y
is:
()
.
x
y
xxr yy
σ
−= −
σ
or
()
()
14
18 0.8 100
20
xy
−=× −
or
0.56 38xy=−
When
90y =
, we have
()
0.56 90 38 12.4x
=×−=
. Ans.
To F i n d b
yx
and b
xy
Using Assumed Mean: Let the assumed means of x-series and y-series
be A and B respectively. Then, taking
()
ii
dx x A
=−
and
()
ii
dy y B
=−
, we have
()
()()
()
()
2
2
ii
ii
yx
i
i
dx dy
dx dy
n
b
dx
dx
n
⋅−
=
−
∑∑
∑
∑
∑
And,
()
()()
()
()
2
2
ii
ii
xy
i
i
dx dy
dx dy
n
b
dy
dy
n
⋅−
=
−
∑∑
∑
∑
∑
Example 14. Find the regression coefficients and hence the equations of the two lines of regression from
the following data:
Age of husband (x) 25 22 28 26 35 20 22 40 20 18
Age of wife (y) 18 15 20 17 22 14 16 21 15 14
Hence estimate
(i) The age of wife, when the age of husband is 30.
(ii) The age of husband, when the age of wife is 19.
420
COMPUTER BASED NUMERICAL AND STATISTICAL TECHNIQUES
Sol. We have
256
25.6
10
i
x
x
x
===
∑
and
172
17.2
10
i
y
y
n
===
∑
Let the assumed mean of x- series and y- series be 26 and 17 respectively. Then, we may prepare
the table given below:
()
()
()
()
2
2
26 17
25 18 1 1 1 1 1
22 15 4 2 16 4 8
28 20 2 3 4 9 6
26 17 0 0 0 0 0
35 22 9 5 81 25 45
20 14 6 3 36 9 18
22 16 4 1 16 1 4
40 21 14 4 196 16 56
20 15 6 2 36 4 12
18 14 8 3 64 9 24
256 17
i i ii ii i i ii
ii
x y dx x dy y dx dy dx dy
xy
=− =− ×
−−
−−
−−
−−
−−
−−
==
∑
()
()
2
2
4 2 450 78 172
iiiiii
dx dy dx dy dx dy
=− = = = =
∑∑ ∑∑ ∑ ∑
Therefore,
()
()()
()
()
()()
()
22
2
42
.172
10
4
450
10
ii
ii
yx
i
i
dx dy
dx dy
n
b
dx
dx
n
−
−−
==
−
−
−
∑∑
∑
∑
∑
b
yx
=
172 0 8
450 1 6
+ .
–.
bg
bg
=
172 8
448 4
.
.
= 0.385
()
()()
()
()
()()
22
2
42
.172
10
2
78
10
ii
ii
xy
i
i
dx dy
dx dy
n
b
dy
dy
n
−
−−
==
−
−
∑∑
∑
∑
∑
()
()
172 0.8
172.8
2.23
78 0.4 77.6
xy
b
+
===
−
Therefore the equation of the line of regression of
y
on
x
is:
() ()
.
yx
yy b xx
−= −
or
()
()( )
17.2 0.385 25.6yx
−= −
CURVE FITTING
421
Now, when x = 30, we get
()( )
17.2 0.385 30 25.6y
−= −
or
19y =
(approximately).
∴
When the age of husband is 30 years, the estimated age of husband is 19 years.
Again, the equation of the line of regression of x on y is:
xx–
di
= b
xy
yy–
di
or (x – 25.6) = (2.23)(y –17.2)
Thus, when y = 19, we get x = 30 (approximately).
So, when the age of wife is 19 years, the estimated age of husband is 30 years. Ans.
9.4 ERROR OF PREDICTION
The deviation of the predicted value from the observed value is known as the standard error of
prediction. It is given by
()
2
p
yx
yy
E
n
−
=
∑
,
where
y
is the actual value and
p
y
the predicted value.
Theorem: Prove that:
(1)
()
2
.1
yx y
Er
=σ −
, (2)
()
2
.1
xy x
Er
=σ −
Proof: (1) The equation of the line of regression of
y
on
x
is
()
.
y
x
yyr xx
σ
−= −
σ
∴
()
.
y
p
yyr xx
x
σ
=+ −
σ
(1)
So,
()
()
2
1/2
2
1
p
y
yx
x
yy
Eyyrxx
nn
−
σ
==−−−
σ
∑
∑
()
()()
1/2
2
22
2
2
2.
1
() .
y
y
x
x
rxx
r
yy xxyy
n
σ−
σ
=−+ −−−
σ
σ
∑
() () ()()
1/2
22
22
2
.2.
yy
x
x
yy xx xxyy
rr
nn n
−−−−
σσ
=+ −
σ
σ
∑∑∑
1/2
22
22
2
.2.
yy
yx xy
x
x
rr
r
σσ
=σ+ σ− σσ
σ
σ
()()
1/2
22 2
.1
y
yy y
rr
=σ− σ =σ −
.
(2) Similarly, (2) may be proved.
422
COMPUTER BASED NUMERICAL AND STATISTICAL TECHNIQUES
Example 15. For the data given below, find the standard error of estimate of
y
on
x
.
x
12345
y
25387
Sol. We leave it to the reader to find the line of regression of y on x.
This is:
1.3 1.1yx=+
. So,
1.3 1.1
p
yx
=+
Now form the table for given data:
() ()
()
2
2
1.3 1.1
1 2 2.4 0.4 0.16
2 5 3.7 1.3 1.69
33 5 2 4
4 8 6.3 1.7 2.89
5 7 7.6 0.6 0.36
9.10
ppp
p
xyyx yy yy
yy
=+ − −
−
−
−=
∑
Therefore
()
2
9.10
1.82 1.349
5
p
yx
yy
E
n
−
====
∑
. Ans.
9.5 MULTIPLE LINEAR REGRESSION
There are a number of situations where the dependent variable is a function of two or more
independent variables either linear or non-linear. Here, we shall discuss an approach to fit the
experimental data where the variable under consideration is linear function of two independent
variables.
Let us consider a two-variable linear function given by
y = a + bx + cz (1)
The sum of the squares of the errors is given by
S =
yabxcz
iii
i
n
–– –
bg
2
1
=
∑
(2)
Differentiating S partially w.r.t. a, b, c, we get
∂
∂
S
a
=0 ⇒
2
1
yabxcz
iii
i
n
–– – –1
bg
af
=
∑
= 0
∂
∂
S
b
=0 ⇒
2
1
yabxcz x
iiii
i
n
–– – (–)
bg
=
∑
= 0
CURVE FITTING
423
and
∂
∂
S
c
=0 ⇒
2
1
yabxcz z
iii
i
n
i
–– – (–)
bg
=
∑
= 0
which on simplification and omitting the suffix i, yields.
∑y = ma + b∑x + c∑z
∑xy = a∑x + b ∑x
2
+ c∑xz
∑yz = a∑z + b∑xz + c∑z
2
Solving the above three equations, we get values of a, b, and c. Consequently, we get the linear
function y = a + bx + cz called regression plane.
Example 16. Obtain a regression plane by using multiple linear regression to fit the data given
below :
x : 1 2 3 4
y : 0 1 2 3
z : 12 18 24 30
(U.P(U.P
(U.P(U.P
(U.P
.TU. 2002).TU. 2002)
.TU. 2002).TU. 2002)
.TU. 2002)
Sol. Let y = a + bx + cz be required regression plane where a, b, c are the constants to be
determined by following equations :
and
∑= +∑+∑
∑=∑+∑+∑
∑=∑+∑+∑
U
V
|
W
|
ymabxcz
xy a x b x c xz
yz a z b zx c z
2
2
(1)
Here, m =4
22
22
1 0 12 1 0 12 0 0
2118 4 1 36 2 18
3 2 24 9 4 72 6 48
4 3 30 16 9 120 12 90
10 6 84 30 14 240 20 156
xz y x z xy xz yz
xzyx z xy xzyz====== ==
∑∑∑∑∑∑ ∑∑
From table, equation (1) can be written as
84 = 4a + 10b + 6c
240 = 10a + 30b + 20c
and 156 = 6a + 20b + 14c
Solving, we get a = 10, b = 2, c = 4
Hence the required regression plane is
y = 10 + 2x + 4z.
Ans.Ans.
Ans.Ans.
Ans.
424
COMPUTER BASED NUMERICAL AND STATISTICAL TECHNIQUES
PROBLEM SET 9.2
1. Find the equation of the lines of regression on the basis of the data:
:x
42342
:y
23244
[Ans.
3.75 0.25 , 3.75 0.25yxxy=− =−
]
2. Find the regression coefficient
yx
b
for the data:
55,x =
∑
88,y =
∑
2
385,
x =
∑
2
1114,
y =
∑
586,xy =
∑
and
10n =
[Ans.1.24]
3. The following data regarding the heights
()
y
and weights
()
x
of 100 college students
are given:
15000,x =
∑
2
2272500,
x =
∑
6800,y =
∑
2
463025,
y =
∑
and
1022250xy =
∑
.
[Ans.
0.1 53yx=+
]
4. Find the coefficient of correlation when two regression equations are:
=− +0.2 4.2xy
and
0.80 8.4yx=− +
.[Ans.
0.4
r
=−
]
5. Find the standard error of estimate of
y
on
x
for the data given below:
:x
1346891114
:y
12445789
[ Ans.
0.564
yx
E
=
]
6. If two regression coefficients are 0.8 and 0.2, what would be the value of coefficient of
correlation? [Ans.
0.4r =
]
7.
x
and
y
are two random variables with the same standard deviation and correlation
coefficient r. Show that the coefficient of correlation between
x
and
xy+
is
1
.
2
r+
8. Show that the geometric mean of the coefficients of regression is the coefficient of
correlation.
GGG
CHAPTER 10
Time Series and Forecasting
10.1 INTRODUCTION
Business executives, economists, and government officials are often faced with problems that
require forecast such as future sales, future revenue and expenditures, and the total business
activity for the next decade. Time series analysis is a statistical method, which helps the
businessman to understand the past behaviour of economic variables based on collection of
observations taken at different time intervals. Having recognized the behaviour or movements
of a time series, the businessman tries to forecast the future of economic variables on the
assumption that the time series of such an economic variable will continue to behave in the
same fashion as it had in the past. Thus analyzing information for the previous time periods
is the subject of time series analysis.
Thus the statistical data, which are collected, observed or recorded at successive intervals
of time or arranged chronologically are said to form a time series.
“A time series a set of observations taken at specified times, usually (but not always) at
equal intervals”. Thus a set of data depending on time, which may be year, quarter, month,
week, days etc. is called a time series.
Examples:
1. The annual production of Rice in India over the last 15 years.
2. The daily closing price of a share in the Calcutta Stock Exchange.
3. The monthly sales of an Iron Industry for the last 6 months.
4. Hourly temperature recorded by the meteorological office in a city.
Mathematically, a time series is defined by the value
12
, , ,
yy
of a variable
y
(closing price of a share, temperature etc.) at time t
1
, t
2
, t
3
, . Thus y is a function of
t and given by
y = f (t)
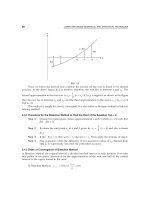
10.2 TIMES SERIES GRAPH
A time series involving a variable y is represented pictorially by constructing a graph of y
verses t.
425