The Best Damn Windows Server 2003 Book Period- P29 ppsx
Bạn đang xem bản rút gọn của tài liệu. Xem và tải ngay bản đầy đủ của tài liệu tại đây (535.04 KB, 10 trang )
One of the downsides of multiple processors is the management of interrupts.The first CPU in a
multiprocessor system (processor 0) controls I/O. If an application running on another CPU
requires a lot of I/O, CPU 0 can spend much of its time managing interrupts instead of running an
application. Windows Server 2003 manages multiple processors and interrupts quite well, but there
is a way to tune the affinity of a thread to a specific processor.
Processor affinity is a method of associating an application with a specific CPU. Processor affinity
can be used to reduce some of the overhead associated with multiple CPUs and is controlled pri-
marily via the Task Manager utility.
Priority is a mechanism used to prioritize some applications (or threads) over others. Priority can
be set when an application is started or can be changed later using the Task Manager utility.
Disk
The disk is the permanent storage location of the operating system, applications, and data. A disk is
made up of one or more physical drives. Often, a computer system will contain multiple disks con-
figured in arrays, which can be useful for increasing performance and/or availability.
Several factors contribute to the performance and reliability of disk:
■
The disk controller technology
■
The life-expectancy (MTBF) of the drive(s)
■
The way data is arranged on the drive(s)
■
The way data is accessed on the drive(s)
■
The ratio of drive controllers to the number of drives
Network Components
The primary (and default) communications protocol used by Windows Server 2003 is TCP/IP.The
operating system also supports the next generation of the TCP/IP protocol, IP version 6 (IPv6), as
well as the AppleTalk, Reliable Multicast, and NWLink protocols. Multiple protocols installed on a
system consume additional memory and CPU resources. Reducing the number of protocols in use
will improve performance.
On systems that do have multiple protocols loaded, change the binding order of the protocols to
the NIC so that the most frequently used protocol is bound first.This will reduce the amount of
processing needed for each network packet and improve performance.
When a packet is received by the NIC, it is placed in a memory buffer.The NIC then either
generates an interrupt to have the CPU transfer the packet to the main memory of the computer or
performs a direct memory access (DMA) transfer and moves the data itself.The method used
depends on the hardware involved.The DMA transfer method is much faster and has less impact on
the overall system.
The number and/or size of the memory buffers allocated to the NIC can affect performance as
well. Some NICs allow you to adjust the number of memory buffers assigned to the card. A larger
buffer space allows the NIC to store more packets, reducing the number of interrupts the card must
generate by allowing larger, less frequent data transfers. Conversely, reducing the number of buffers
246 Chapter 7 • Planning, Implementing, and Maintaining a High-Availability Strategy
301_BD_w2k3_07.qxd 5/11/04 5:01 PM Page 246
can increase the amount of interrupts generated by the NIC, impacting system performance. Some
NICs allow you to adjust the buffers for transmitting and receiving packets independently, giving
you more flexibility in your configuration.The trade-off of increasing communication buffers may
be a reduction in the amount of memory available to applications in the system.
One feature of Windows 2000 and Windows Server 2003 is support for IP Security (IPSec).
This feature allows the securing of data transmitted over IP networks through the use of cryptog-
raphy. IPSec is computer-intensive, meaning that significant amounts of CPU overhead are incurred
with its use. Some NICs made in recent years support the offloading of the IPSec calculations to a
highly optimized processor on the NIC.This can greatly reduce the amount of CPU time needed,
as well as improve communications performance. NICs that support the offloading of IPSec are not
much more expensive than regular NICs and should be strongly considered if you are using IPSec.
Another consideration for network performance is the network topology. Although it is not
specific to the Windows operating system, network topology can greatly affect communications per-
formance. If the traffic to your server must travel through routers that convert large incoming
packets into multiple smaller packets, your server must do more work to reassemble the original
packets before your applications can use the data. For example, if a client system is connected to a
Token Ring network (which commonly uses a packet size of 4192 bytes or larger) and your server
is connected via Ethernet (with a packet size of 1514 bytes), an intermediary router will “chop” the
original packet into three or more packets for transmission on the Ethernet network segment.Your
server must then reassemble these packets before passing them to applications. Reducing the number
of topologies and/or routers on your network can improve performance by reducing packet conver-
sions and reassembly.
Also, when using Ethernet, consider using switches instead of hubs. Switches are more expensive
but allow higher communication rates and also permit more than one device to communicate at the
same time. Hubs are cheaper but allow only one computer to be communicating at any given time.
Switches are also not susceptible to Ethernet collisions, whereas hubs are at the mercy of collisions.
Another topology-related configuration is the duplex setting of the NICs. Primarily an issue
with Ethernet, duplex describes how data is transmitted. A full-duplex communication link allows
the simultaneous transmission and reception of data. Full duplex is the desired setting for servers,
because servers normally need to transmit and receive at the same time. Full duplex typically
requires switches. Half-duplex communication is the bi-directional communication of data but not
at the same time. When transmitting data, receiving data is not possible and vice versa. Half duplex is
often acceptable for workstations but should be avoided on servers.
Using the System Monitor Tool to Monitor Servers
Windows Server 2003 includes tools for monitoring the performance of your server. System
Monitor is one such tool. System Monitor is an ActiveX control snap-in that is available as part of
the Performance administrative tool.You can start it from the Start menu, as shown in Figure 7.1.
Planning, Implementing, and Maintaining a High-Availability Strategy • Chapter 7 247
301_BD_w2k3_07.qxd 5/11/04 5:01 PM Page 247
System Monitor works by collecting information from counters built in to the operating system.
Counters are features of the operating system (as well as some utilities and applications) that count
specific events occurring in the system (like the number of disk writes each second or the per-
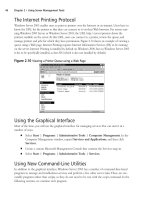
centage of disk space in use by files).The graphical view, shown in Figure 7.2, graphs the counter
statistics.
You can also see the counter statistics in System Monitor’s report view, as shown in Figure 7.3.
248 Chapter 7 • Planning, Implementing, and Maintaining a High-Availability Strategy
Figure 7.1 Starting the Performance Administrative Tool
Figure 7.2 System Monitor, Graphical View with Default Counters
301_BD_w2k3_07.qxd 5/11/04 5:01 PM Page 248
You can access the data collected by counters via System Monitor, other utilities, or third-party
applications.This data provides you with an understanding of what is occurring on your system at the
moment or over time. Using this information, you can tune your system’s operation to best suit your
needs, determine if components are being overutilized, plan for expanding or replacing your system, or
perform troubleshooting. Some of the most frequently used counters are shown in Table 7.1.
Table 7.1 Commonly Referenced Performance Counters
Performance Object: Recommended
Resource Counter Threshold Comments
Disk Logical Disk:%Free Space 15% Percentage of unused
disk space. This value
may be reduced on
larger disks, depending
on your preferences.
Physical Disk:%Disk Time 90% If you’re using a hard-
ware controller, try
increasing the controller
cache size to improve
read/write performance.
The Physical Disk counter
is not always available or
may be unreliable on
clustered disks.
Logical Disk:%Disk Time
Planning, Implementing, and Maintaining a High-Availability Strategy • Chapter 7 249
Figure 7.3 System Monitor, Report View with Default Counters
Continued
301_BD_w2k3_07.qxd 5/11/04 5:01 PM Page 249
Table 7.1 Commonly Referenced Performance Counters
Performance Object: Recommended
Resource Counter Threshold Comments
Physical Disk:Disk Varies by disk The rate of read or write
Reads/sec technology operations per second.
Ultra SCSI should handle
50 to 70. I/O type
(random/sequential) and
RAID structure will affect
this greatly.
Physical Disk:Disk
Writes/sec
Physical Disk:Avg. Disk Total # of spindles The number of disk
Queue Length plus 2 requests waiting to
occur. It is used to deter-
mine if your disk system
can keep up with I/O
requests.
Memory Memory:Available Bytes Varies The amount of free
physical RAM available
for allocation to a pro-
cess or the system.
Memory:Pages/sec Varies Number of pages read
from or written to disk
per second. Includes
cache requests and
swapped executable
code requests.
Paging File Paging File:%Usage Greater than 70% The percentage of the
page file currently in
use. This counter and
the two Memory coun-
ters are linked. Low
Available Bytes and high
Pages/sec indicate a
need for more physical
memory.
Processor Processor:%Processor 85% Indicates what per-
Time centage of time the
processor was not idle.
If high, determine if a
single process is con-
suming the CPU.
Consider upgrading the
CPU speed or adding
processors.
250 Chapter 7 • Planning, Implementing, and Maintaining a High-Availability Strategy
Continued
301_BD_w2k3_07.qxd 5/11/04 5:01 PM Page 250
Table 7.1 Commonly Referenced Performance Counters
Performance Object: Recommended
Resource Counter Threshold Comments
Processor:Interrupts/sec Start at 1000 on s Indicates the number of
ingle CPU; 5000 hardware interrupts gen-
multiple CPUs erated by the compo-
nents of the system (net-
work cards, disk
controllers, and so on)
per second. A sudden
increase can indicate
conflicts in hardware.
Multiprocessor systems
normally experience
higher interrupt rates.
Server Work Server Work Queues: 4 Indicates the number of
Queues Queue Length requests waiting for ser-
vice by the processor. A
number higher than the
threshold may indicate a
processor bottleneck.
Observe this value over
time.
System System:Processor Less than 10 per The number of process
Queue Length processor threads awaiting execu-
tion. This counter is
mainly relevant on multi-
processor systems. A
high value may indicate
a processor bottleneck.
Observe this value over
time.
Before you attempt to troubleshoot performance issues, you should to create a baseline. Develop
a baseline by collecting data on your system in its initial state and at regular intervals over time. Save
this collected data and store it in a database.You can then compare this historical data to current
performance statistics to determine if your system’s behavior is changing slowly over time.
Momentary spikes on the charts are normal, and you should not be overly concerned about them.
Sustained highs can also be normal, depending on the activity occurring in a system, or they can
signal a problem. Proper baselining will allow you to know when a sustained high is detrimental.
The Heisenberg Principal of physics (greatly paraphrased) states that you cannot observe the
activity of something without altering its behavior.The same is true with performance monitoring.
The collection of statistics requires computer resources. Collect only the counters you specifically
need. If the system you wish to examine is extremely busy, consider using the noninteractive
Performance Logs and Alerts function, shown in Figure 7.4, rather than System Monitor. Collecting
the counters will still incur overhead, but not as much.
Planning, Implementing, and Maintaining a High-Availability Strategy • Chapter 7 251
301_BD_w2k3_07.qxd 5/11/04 5:01 PM Page 251
You might also consider lowering the update interval or collecting data from the system on an
hourly or daily basis, rather than continuously. If you’re monitoring disk counters, store the logs on a
different disk (and, if possible, on a different controller channel) than the one you are monitoring.
This will help avoid skewing the data.You can also save the collected statistics into a file or database,
and then load and review them later (configured on the Source tab of the System Monitors
Properties dialog box, shown later in Figure 7.11).
A counter log called System Overview, shown in Figure 7.5, is provided by Microsoft as an
example.This log is configured to collect the same default counters as System Monitor at 15-second
intervals.
You can view the properties of the System Overview log by right-clicking it and selecting
Properties from the context menu. Figure 7.6 shows the dialog box that appears.
252 Chapter 7 • Planning, Implementing, and Maintaining a High-Availability Strategy
Figure 7.4 Performance Logs and Alerts, Accessed from Computer Management
Figure 7.5 The Sample System Overview Counter Log
301_BD_w2k3_07.qxd 5/11/04 5:01 PM Page 252
The Log Files tab, shown in Figure 7.7, specifies the type (format) of the log file, its location,
and the comment assigned to the log.The drop-down menu for the Log File Type option (shown
in Figure 7.7) lists the formats available for log files.The binary format is compact and efficient.The
text formats require more space to store the log, but they can be read by other applications like
Microsoft Word and Excel.The binary circular file format overwrites itself when it reaches its max-
imum size, potentially saving disk space.
If you click Configure… in the Log Files tab of the System Overview Properties dialog
box, you will be presented with the Configure Log Files dialog box, as shown in Figure 7.8. Here,
you can specify the location, name, and size limit of the log file.
Planning, Implementing, and Maintaining a High-Availability Strategy • Chapter 7 253
Figure 7.6 Properties of the System Overview Sample Log
Figure 7.7 Properties of the System Overview Sample Log, Log Files Tab
301_BD_w2k3_07.qxd 5/11/04 5:01 PM Page 253
The Schedule tab, shown in Figure 7.9, lets you specify the schedule for collecting data from
the selected counters.The log can be manually controlled or can be scheduled to start at a specific
date and time.You can stop the log manually or after a specific duration, a certain date and time, or
when the log reaches its maximum size.
By default, System Monitor tracks real-time data, but you can also have it display data from log
files.To view log file data, click the View Log Data button in the main System Monitor window,
as shown in Figure 7.10 (the icon that looks like a disk, the fourth from the left; circled for clarity in
the figure).
On the Source tab, select the Log files option button and click Add. Browse to the log file
you wish to view, select it, and click Open. With a log file added, the Source tab should look sim-
ilar to Figure 7.11.
Click OK, and you will be viewing the data collected in the log file. Figure 7.12 shows an
example of viewing log file data.
254 Chapter 7 • Planning, Implementing, and Maintaining a High-Availability Strategy
Figure 7.8 Configuring Log Files
Figure 7.9 Properties of the System Overview Sample Log, Schedule Tab
301_BD_w2k3_07.qxd 5/11/04 5:01 PM Page 254
Planning, Implementing, and Maintaining a High-Availability Strategy • Chapter 7 255
Figure 7.10 Selecting the View Log Data Button
Figure 7.11 System Monitor Properties, Source Tab
Figure 7.12 System Monitor, Viewing Log File Data
301_BD_w2k3_07.qxd 5/11/04 5:01 PM Page 255