Microsoft SQL Server 2008 R2 Unleashed- P17 pptx
Bạn đang xem bản rút gọn của tài liệu. Xem và tải ngay bản đầy đủ của tài liệu tại đây (280.69 KB, 10 trang )
ptg
114
CHAPTER 5 SQL Server Command-Line Utilities
User-specified agent parameter values:
-sourceserver (local)
-sourcedatabase AdventureWorks2008R2
-sourceschema Person
-sourcetable AddressType
-destinationserver (local)
-destinationdatabase AdventureWorks2008R2
-destinationschema Person
-destinationtable AddressTypeCopy
-f c:\TableDiff_Output
Table [AdventureWorks2008R2].[Person].[AddressType] on (local)
and Table [AdventureWorks2008R2].[Person].[AddressTypeCopy] on (local)
have 2 differences.
Fix SQL written to c:\TableDiff_Output.sql.
Err AddressTypeID Col
Mismatch 1 Name
Mismatch 5 ModifiedDate Name
The requested operation took 0.296875 seconds.
The output first displays a summary of the parameters used and then shows the compari-
son results. In this example, it found the two differences that are due to updates
performed on AddressTypeCopy. In addition, the –f parameter used in the example caused
the tablediff utility to output a SQL file that can be used to fix the differences in the
destination table. The output file from this example looks as follows:
— Host: (local)
— Database: [AdventureWorks2008R2]
— Table: [Person].[AddressTypeCopy]
SET IDENTITY_INSERT [Person].[AddressTypeCopy] ON
UPDATE [Person].[AddressTypeCopy]
SET [Name]=’Billing’
WHERE [AddressTypeID] = 1
UPDATE [Person].[AddressTypeCopy]
SET [ModifiedDate]=’2002-06-01 00:00:00.000’,
[Name]=’Shipping’ WHERE [AddressTypeID] = 5
SET IDENTITY_INSERT [Person].[AddressTypeCopy] OFF
NOTE
The tablediff utility requires the source table to have at least one primary key, identi-
ty, or ROWGUID column. This gives the utility a key that it can use to try to match a cor-
responding row in the destination table. If the –strict option is used, the destination
table must also have a primary key, identity, or ROWGUID column.
Download from www.wowebook.com
ptg
115
The bcp Command-Line Utility
5
Keep in mind that several different types of comparisons can be done with the tablediff
utility. The –q option causes a quick comparison that compares only record counts and
looks for differences in the schema. The –strict option forces the schemas of each table
to be the same when the comparison is run. If this option is not used, the utility allows
some columns to be of different data types, as long as they meet the mapping require-
ments for the data type (for example, INT can be compared to BIGINT).
The tablediff utility can be used for many different types of comparisons. How you use
this tool depends on several factors, including the amount and type of data you are
comparing.
The bcp Command-Line Utility
You use the bcp (bulk copy program) tool to address the bulk movement of data. This utility
is bidirectional, allowing for the movement of data into and out of a SQL Server database.
bcp uses the following syntax:
bcp {[[database_name.][owner].]{table_name | view_name} | “query”}
{in | out | queryout | format} data_file
[-mmax_errors] [-fformat_file] [-x] [-eerr_file]
[-Ffirst_row] [-Llast_row] [-bbatch_size]
[-n] [-c] [-N] [-w] [-V (60 | 65 | 70 | 80)] [-6]
[-q] [-C { ACP | OEM | RAW | code_page } ] [-tfield_term]
[-rrow_term] [-iinput_file] [-ooutput_file] [-apacket_size]
[-Sserver_name[\instance_name]] [-Ulogin_id] [-Ppassword]
[-T] [-v] [-R] [-k] [-E] [-h”hint [, n]”]
Some of the commonly used options—other than the ones used to specify the database,
such as user ID, password, and so on—are the –F and –L options. These options allow you
to specify the first and last row of data to be loaded from a file, which is especially helpful
in large batches. The –t option allows you to specify the field terminator that separates
data elements in an ASCII file. The –E option allows you to import data into SQL Server
fields that are defined with identity properties.
TIP
The BULK INSERT T-SQL statement and SSIS are good alternatives to bcp. The BULK
INSERT statement is limited to loading data into SQL Server, but it is an extremely fast
tool for loading data. SSIS is a sophisticated GUI that allows for both data import and
data export, and it has capabilities that go well beyond those that were available in
SQL Server 2000’s Data Transformation Services (DTS).
Download from www.wowebook.com
ptg
116
CHAPTER 5 SQL Server Command-Line Utilities
This section barely scratches the surface when it comes to the capabilities of bcp. For a
more detailed look at bcp, refer to the section, “Using bcp” in Chapter 52, “SQL Server
Integration Services.”
The sqldiag Command-Line Utility
sqldiag is a diagnostic tool that you can use to gather diagnostic information about
various SQL Server services. It is intended for use by Microsoft support engineers, but you
might also find the information it gathers useful in troubleshooting a problem. sqldiag
collects the information into files that are written, by default, to a folder named SQLDIAG,
which is created where the file sqldiag.exe is located (for example, C:\Program
Files\Microsoft SQL Server\100\Tools\binn\SQLDIAG\). The folder holds files that
contain information about the machine on which SQL Server is running in addition to
the following types of diagnostic information:
. SQL Server configuration information
. SQL Server blocking output
. SQL Server Profiler traces
. Windows performance logs
. Windows event logs
The syntax for sqldiag changed quite a bit in SQL Server 2005, but very little has changed
in SQL Server 2008. Some of the options that were used in versions prior to SQL Server
2005 are not compatible with the current version. The full syntax for sqldiag is as
follows:
sqldiag
{ [/?] }
|
{ [/I configuration_file]
[/O output_folder_path]
[/P support_folder_path]
[/N output_folder_management_option]
[/C file_compression_type]
[/B [+]start_time]
[/E [+]stop_time]
[/A SQLdiag_application_name]
[/T { tcp [ ,port ] | np | lpc | via } ]
[/Q] [/G] [/R] [/U] [/L] [/X] }
|
{ [START | STOP | STOP_ABORT] }
|
{ [START | STOP | STOP_ABORT] /A SQLdiag_application_name }
Download from www.wowebook.com
ptg
117
The sqldiag Command-Line Utility
5
NOTE
Keep in mind that many of the options for sqldiag identify how and when the sqldiag
utility will be run. The utility can be run as a service, scheduled to start and stop at a
specific time of day, and it can be configured to change the way the output is generat-
ed. The details about these options are beyond the scope of this chapter but are cov-
ered in detail in SQL Server Books Online. This section is intended to give you a taste
of the useful information that this utility can capture.
By default, the sqldiag utility must be run by a member of the Windows Administrators
group, and this user must also be a member of the sysadmin fixed SQL Server role. To get
a flavor for the type of information that sqldiag outputs, open a command prompt
window, change the directory to the location of the sqldiag.exe file, and type the follow-
ing command:
sqldiag
No parameters are needed to generate the output. The command prompt window scrolls
status information across the screen as it collects the diagnostic information. You see the
message “SQLDIAG Initialization starting ” followed by messages that indicate what
information is being collected. The data collection includes a myriad of system informa-
tion from MSINFO32, default traces, and SQLDumper log files. When you are ready to stop
the collection, you can press Ctrl+C.
If you navigate to the sqldiag output folder, you find the files created during the collec-
tion process. In this output folder, you should find a file with MSINFO32 in its name. This
file contains the same type of information that you see when you launch the System
Information application from Accessories or when you run MSINFO32.EXE. This is key
information about the machine on which SQL Server is running. This information
includes the number of processors, the amount of memory, the amount of disk space, and
a slew of other hardware and software data.
You also find a file named xxx_sp_sqldiag_Shutdown.out, where xxx is the name of the
SQL Server machine. This file contains SQL Server–specific information, including the SQL
Server error logs, output from several key system stored procedures, including sp_helpdb
and sp_configure, and much more information related to the current state of SQL Server.
You find other files in the sqldiag output directory as well. Default trace files, log files
related to the latest sqldiag execution, and a copy of the XML file containing configura-
tion information are among them. Microsoft documentation on these files is limited, and
you may find that the best way to determine what they contain is simply to open the files
and review the wealth of information therein.
Download from www.wowebook.com
ptg
118
CHAPTER 5 SQL Server Command-Line Utilities
The sqlservr Command-Line Utility
The sqlservr executable is the program that runs when SQL Server is started. You can use
the sqlservr executable to start SQL Server from a command prompt. When you do that,
all the startup messages are displayed at the command prompt, and the command prompt
session becomes dedicated to the execution of SQL Server.
CAUTION
If you start SQL Server from a command prompt, you cannot stop or pause it by using
SSMS, Configuration Manager, or the Services applet in the Control Panel. You should
stop the application only from the command prompt window in which SQL Server is run-
ning. If you press Ctrl+C, you are asked whether you want to shut down SQL Server. If
you close the command prompt window in which SQL Server is running, SQL Server is
automatically shut down.
The syntax for the sqlserver utility is as follows:
sqlservr [-sinstance_name] [-c] [-dmaster_path] [-f]
[-eerror_log_path] [-lmaster_log_path] [-m]
[-n] [-Ttrace#] [-v] [-x] [-gnumber] [-h]
Most commonly, you start SQL Server from the command prompt if you need to trou-
bleshoot a configuration problem. The –f option starts SQL Server in minimal configura-
tion mode. This allows you to recover from a change to a configuration setting that
prevents SQL Server from starting. You can also use the –m option when you need to start
SQL Server in single-user mode, such as when you need to rebuild one of the system data-
bases.
SQL Server functions when started from the command prompt in much the same way as
it does when it is started as a service. Users can connect to the server, and you can
connect to the server by using SSMS. What is different is that the SQL Server instance
running in the command prompt appears as if it is not running in some of the tools.
SSMS and SQL Server Service Manager show SQL Server as being stopped because they are
polling the SQL Server service, which is stopped when running in the command prompt
mode.
TIP
If you simply want to start the SQL Server service from the command prompt, you can
use the NET START and NET STOP commands. These commands are not SQL Server
specific but are handy when you want to start or stop SQL Server, especially in a batch
file. The SQL Server service name must be referenced after these commands. For
example, NET START MSSQLSERVER starts the default SQL Server instance.
Download from www.wowebook.com
ptg
119
Summary
5
Summary
SQL Server provides a set of command-line utilities that allow you to execute some of
the available SQL Server programs from the command prompt. Much of the functional-
ity housed in these utilities is also available in graphical tools, such as SSMS. However,
the capability to initiate these programs from the command prompt is invaluable in
certain scenarios.
Chapter 6, “SQL Server Profiler,” covers a tool that is critical for performance tuning in
SQL Server 2008. SQL Server Profiler provides insight by monitoring and capturing the
activity occurring on a SQL Server instance. It is a “go-to” tool for many DBAs and devel-
opers because of the wide variety of information that it can capture.
Download from www.wowebook.com
ptg
This page intentionally left blank
Download from www.wowebook.com
ptg
CHAPTER 6
SQL Server Profiler
IN THIS CHAPTER
. What’s New with SQL Server
Profiler
. SQL Server Profiler Architecture
. Creating Traces
. Executing Traces and Working
with Trace Output
. Saving and Exporting Traces
. Replaying Trace Data
. Defining Server-Side Traces
. Profiler Usage Scenarios
This chapter explores the SQL Server Profiler, one of SQL
Server’s most powerful auditing and analysis tools. The SQL
Server Profiler gives you a basic understanding of database
access and helps you answer questions such as these:
. Which queries are causing table scans on my invoice
history table?
. Am I experiencing deadlocks, and, if so, why?
. What SQL queries is each application submitting?
. Which were the 10 worst-performing queries last week?
. If I implement this alternative indexing scheme, how
will it affect my batch operations?
SQL Server Profiler records activity that occurs on a SQL
Server instance. The tool has a great deal of flexibility and
can be customized for your needs. You can direct SQL
Server Profiler to record output to a window, file, or table.
You can specify which events to trace, the information to
include in the trace, how you want that information
grouped, and what filters you want to apply.
What’s New with SQL Server Profiler
The SQL Server 2008 Profiler is essentially the same as the
SQL Server 2005 profiler. This is not surprising because
many new features that were added with SQL Server 2005
addressed gaps identified in previous versions. The changes
made in SQL Server 2008 are generally minor and include
several new trace events, one new trace column, and several
other minor changes to the profiler GUI screens.
Download from www.wowebook.com
ptg
122
CHAPTER 6 SQL Server Profiler
Lock Manager
ODS
Query Processor
Log Manager
Error Log
OLE–DB
•••
User Defined
SQL Server Profiler
UI
Flat File
Ta b le
Event Log
•••
Event
Producers
Filters Queue Event
Consumers
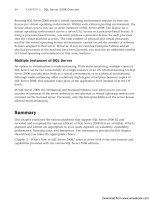
FIGURE 6.1 SQL Server Profiler’s architecture.
SQL Server Profiler Architecture
SQL Server 2008 has both a server and a client-side component for tracing activity on a
server. The SQL trace facility is the server-side component that manages queues of events
initiated by event producers on the server. Extended stored procedures can be used to
define the server-side events that are to be captured. These procedures, which define a SQL
trace, are discussed later in this chapter, in the section, “Defining Server-Side Traces.”
The SQL Profiler is the client-side tracing facility. It comes with a fully functional GUI that
allows for real-time auditing of SQL Server events. When it is used to trace server activity,
events that are part of a trace definition are gathered at the server. Any filters defined as
part of the trace definition are applied, and the event data is queued for its final destina-
tion. The SQL Profiler application is the final destination when client-side tracing is used.
The basic elements involved in this process are shown in Figure 6.1.
This figure illustrates the following four steps in the process when tracing from the SQL
Server Profiler:
1. Event producers, such as the Query Processor, Lock Manager, ODS, and so on, raise
events for the SQL Server Profiler.
2. The filters define the information to submit to SQL Server Profiler. A producer will
not send events if the event is not included in the filter.
Download from www.wowebook.com
ptg
123
Creating Traces
6
3. SQL Server Profiler queues all the events.
4. SQL Server Profiler writes the events to each defined consumer, such as a flat file, a
table, the Profiler client window, and so on.
In addition to obtaining its trace data from the event producers listed in step 1, you can
also configure SQL Profiler so that it obtains its data from a previously saved location. This
includes trace data saved in a file or table. The “Saving and Exporting Traces” section, later
in this chapter, covers using trace files and trace tables in more detail.
Creating Traces
Because SQL Server Profiler can trace numerous events, it is easy to get lost when reading
the trace output. You need to roughly determine the information you require and how
you want the information grouped. For example, if you want to see the SQL statements
that each user is submitting through an application, you could trace incoming SQL state-
ments and group them by user and by application.
When you have an idea about what you want to trace, you should launch the SQL Server
Profiler by selecting Start, then SQL Server 2008, then Performance Tools, and finally SQL
Server Profiler. You also can launch it from within SSMS from the Tools menu. When you
launch the Profiler, you are presented with an application window that is basically empty.
To start a new trace, you select the File menu and choose New Trace. In the connection
dialog that is displayed, you can enter the connectivity information for the server you
want to trace. After the connection is established, the General tab of the Trace Properties
window (see Figure 6.2) is displayed.
FIGURE 6.2 General trace properties.
Download from www.wowebook.com