Calculus: An Integrated Approach to Functions and their Rates of Change, Preliminary Edition Part 5 pptx
Bạn đang xem bản rút gọn của tài liệu. Xem và tải ngay bản đầy đủ của tài liệu tại đây (257.11 KB, 10 trang )
1.3 Representations of Functions 21
ii. Using the information from part (i) we label the point P on the graph (63π,7).
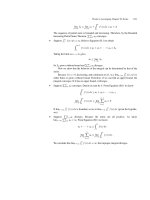
iii. The volume of liquid in this beaker, V ,is9πh. We want to calculate height given
volume, so we solve for h in terms of V :
h =
V
9π
so C
b
(V ) =
V
9π
.
The height is proportional to the volume. We can see this from the function formula,
h = C
b
(V ) =
1
9π
· V , or from the physical situation itself. The walls of the beaker are
perpendicular to the base; therefore all cross-sections are equal in area and the height
is proportional to the volume.
◆
In the examples that follow we will work on expressing one variable as a function
of another. These examples are chosen to highlight relationships that will arise repeatedly
throughout our studies. They will also serve as a review of some geometry including similar
triangles and the Pythagorean Theorem. (For a summary of some useful geometric formulas,
refer to Appendix B.)
REMARK Examples in a mathematics text are meant to be read actively, with a pencil
and paper. A solution will have more impact, and stay with you longer, if you have
spent a bit of time tackling the problem yourself. Read the problems that follow and
try each one on your own before reading the solutions. The problem-solving strategies
highlighted below should help you out. Think of them as a way of coaching yourself through
a problem.
Portable Strategies for Problem Solving
Draw a picture whenever possible.
Label known quantities and unknown quantities so you can refer to them. Make your
labeling clear and explicit.
Take the problem apart into a series of simpler questions. Plan a strategic approach to
the problem.
Make the problem more concrete (or simpler) in order to get started. Either solve the
problem with the concrete numbers and try to generalize, or spot check your answer
by making sure it works in a concrete example or two.
◆
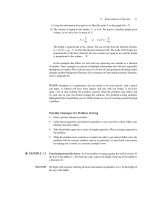
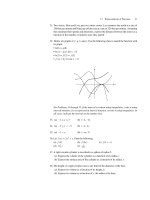
EXAMPLE 1.7 Functioning around the house. An 8-foot ladder is leaning against the wall of a house. If
the foot of the ladder is x feet from the wall, express the height of the top of the ladder as
a function of x.
SOLUTION We begin with a picture, labeling all known and unknown quantities. Let y be the height of
the top of the ladder.
22 CHAPTER 1 Functions Are Lurking Everywhere
ladder against wall
wall
8 ft.
y ft.
x ft.
Figure 1.8
The Pythagorean Theorem tells us how x and y are related.
x
2
+ y
2
= 8
2
y
2
= 64 − x
2
y =±
64 − x
2
,
but height is never negative, so
y =
64 − x
2
.
Therefore, y = f(x)=
√
64 − x
2
, where x ∈ [0, 8]. ◆
◆
EXAMPLE 1.8 Functioning around the house. A 13-foot ladder is leaning against the wall of a house. The
foot of the ladder is 5 feet from the house and the top has a height of 12 feet. The distance
between the wall of the house and a point on the ladder is a function of the height, h, of the
point on the ladder. Write a formula for this function.
SOLUTION Let d be the distance between the point on the ladder and the wall.
1.3 Representations of Functions 23
ladder against wall
wall
13 ft.
12 ft.
5 ft.
13
12 – h
h
5
h
d
Figure 1.9
We must relate d and h. We can do this by using similar triangles. We’ll then solve for d in
terms of h.
d
12 − h
=
5
12
d =
5
12
· (12 − h)
= 5 −
5h
12
Therefore, d = f (h) = 5 −
5h
12
.
◆
Thinking ahead can save energy. There were several different algebraic options when using
similar triangles to relate d and h. Since our goal is to solve for d, our work is simplified
by using a relationship that is written so that d is in the numerator of the ratio.
EXERCISE 1.2 Functioning in the evening Late in the evening an elegant 5
1
2
-foot-tall woman is standing
by a 14-foot-high street lamp on a cobbled road. The length of the shadow she casts is a
function of her distance from the lamppost. Write a formula for this function, where x is
the distance between the woman and the lamppost.
24 CHAPTER 1 Functions Are Lurking Everywhere
elegant woman under streetlamp
14 ft
5.5 ft
x ft
woman
shadow length =
Figure 1.10
Answer
The length of her shadow is f(x)=
11
17
x.
◆
EXAMPLE 1.9 Functioning in the morning. We’re making a pot of coffee using a conical coffee filter.
The coffee filter holder is a right circular cone with a radius of 6 centimeters at the top and
a height of 12 centimeters. Express the amount of liquid in the filter as a function of the
height of the liquid.
h
12 cm
6 cm
12-h
h
r
6
12
coffee in a coffee filter
Figure 1.11
SOLUTION We can use the volume of a cone to relate the amount of liquid, V , and the height, h, of the
liquid.
V =
1
3
πr
2
h
Here r is the radius of the top of the cone of liquid, not of the conical filter itself, so r varies
with the amount of liquid. But now V is expressed as a function of two variables, r and h.
We would like the volume expressed as a function of h only. Since r depends on h, we must
express r in terms of h. We can do this using similar triangles.
1.3 Representations of Functions 25
r
h
=
6
12
r =
1
2
· h
Therefore,
V =
1
3
π
h
2
2
h
=
1
3
π
h
2
4
h
=
1
12
πh
3
.
◆
◆
EXAMPLE 1.10 Functioning in the kitchen. Chocolate pudding is being served in hemispherical bowls
with a radius of 2 inches. The top skin of the pudding forms a disk whose radius, r, depends
upon the height, h, of the pudding. Express r as a function of h.
SOLUTION First, be sure you understand the question. The radius of the pudding skin and the radius of
the bowl are generally different. They are the same only if the bowl is filled all the way to
the top.
2-h
h
2
2"2"
2
r
h
2-h
h
h
r
r
2
bowl of chocolate pudding
searching for a way
to relate h and r
success! relate r and 2-h using
a triangle with hypotenuse 2
Figure 1.12
We can relate r and h by looking at a cross-sectional slice and using a right triangle.
While it may be tempting to draw a triangle whose legs are h and r, this is not useful, since
the hypotenuse of the triangle is unknown. Instead, we must draw a triangle that involves
the radius of the bowl itself. This radius must emanate from the center of the sphere.
26 CHAPTER 1 Functions Are Lurking Everywhere
(2 − h)
2
+ r
2
= 2
2
r
2
= 4 − (2 − h)
2
r
2
= 4 − (4 − 4h + h
2
)
r
2
= 4h − h
2
r =±
4h − h
2
but r ≥ 0, so
r =
4h − h
2
r = f (h) =
4h − h
2
. ◆
◆
EXAMPLE 1.11 Functioning with friends. Javier goes to a pizza shop intending to order a small pizza and
eat it. When he enters the shop he sees some of his friends and they decide to split a large
pizza. If the radius of a large pizza is twice the radius of a small pizza, what fraction of
the large pizza should be allocated to Javier to give him the amount of food he originally
intended to eat?
small pizza
large pizza
Figure 1.13
SOLUTION We’ ll use functional notation in solving the problem.
Area of small pizza
Area of large pizza
=
A(r)
A(2r)
=
πr
2
π(2r)
2
=
πr
2
π4r
2
=
1
4
Allocate a quarter of the large pizza to Javier. ◆
Notice that we did not need to know the actual radius of either the small or the large
pizza. We were able to determine the answer simply by calling the radius of the small pizza r.
◆
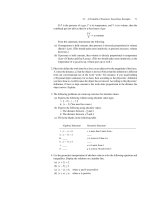
EXAMPLE 1.12 Functioning on a diet of sugar cane. Giant pandas eat sugar cane. S pounds of sugar cane
provide N calories. On average, each day a panda needs to take in C calories for every
pound of the panda’s weight.
i. The number of pounds of sugar cane it takes to support a panda for a day is a function
of the weight, x, of the panda. Express this function with a formula. The formula will
involve the constants S, N, and C.
ii. The number of pounds of sugar cane it takes to support a pair of pandas, one weighing
P pounds and the other weighing Q pounds, for a period of W weeks is a function of
1.3 Representations of Functions 27
W , the number of weeks they are to be supported. Express this function as a formula.
The formula will involve the constants S, N, C, P , and Q.
SOLUTION i. Let’s use the strategy of taking the problem apart into a series of simpler questions.
We’ ll use unit analysis to help us.
We’re looking for the number of pounds of sugar cane it takes to support a panda
weighing x pounds for one day. In order to use unit analysis constructively we’ll need to
be very precise; we don’t want to confuse pounds of sugar cane with pounds of panda.
Question: How many calories does the panda need for one day?
C
calories
lbs of panda
· x lbs of panda = Cx calories
Question: How many pounds of sugar cane will provide Cx calories?
If we know the number of pounds of sugar cane per calorie, then multiplying by
Cx, the number of calories needed, will give the answer. S pounds of sugar cane provide
N calories. We can express this as
S lbs of sugar cane
N calories
or
S
N
lbs of sugar cane
calorie
.
Therefore, to support the panda for one day we need
S
N
lbs of sugar cane
calorie
· Cx calories =
SC
N
x lbs of sugar cane.
Number of pounds of sugar cane = f(x)=
SC
N
x.
ii. Again, let’s break this down into a series of simpler questions.
How many pounds of sugar cane are needed to support a pair of pandas, one weighing
P pounds and the other weighing Q pounds for one day?
Amount to support the pair for a day = amount to support one panda
+ amount to support the other
Amount to support the panda weighing P lb =
SCP
N
Amount to support the panda weighing Q lb =
SCQ
N
Amount to support the pair for a day =
SCP
N
+
SCQ
N
=
SC
N
· (P + Q)
Whatever it takes to feed the pandas for a day, it takes 7 times that amount to feed them
for a week and 7W times that amount to feed them for W weeks. To feed the pandas
for W weeks it takes
f(W)=7W ·
SC
N
· (P + Q)
pounds of sugar cane.
◆
28 CHAPTER 1 Functions Are Lurking Everywhere
COMMENT Working with Rates Consider the statement “S pounds of sugar cane provide
N calories.” From this we can determine the amount of sugar cane equivalent to one calorie
(pounds of sugar cane per calorie):
S lbs of sugar cane
N calories
or
S
N
lbs of sugar cane
calorie
.
Similarly, we can determine the number of calories per pound of sugar cane:
N calories
S lbs of sugar cane
or
N
S
calories
lbs of sugar cane
In other situations we may be given analogous sorts of rate information. For instance,
if a typist types W words in H hours then he types at a rate of
W words
H hours
or
W
H
words
hour
.
If we know the number of hours the typist worked, we can estimate the number of words
he typed. Unit analysis gives
words
hour
· hours = words.
Multiplying rate by time gives the amount done.
Alternatively, we can calculate the time per word.
H hours
W words
or
H
W
hours
word
.
If we know the number of words the typist must type, we can estimate the time it will take
him.
hours
words
· words = hours.
Presenting a Function Graphically
While you may be accustomed to seeing functions described by formulas, frequently
information about a function is obtained directly from its graph. The function itself may be
presented graphically, without a formula; think about a seismograph recording the size of
tremors in the earth, an electrocardiogram machine measuring electric activity in the heart,
or the output of many standard measuring instruments of meteorologists. These machines
give us pictures, not formulas. Alternatively, consider the function that takes time as input
and gives as output the temperature at the top of the Prudential Center in downtown Boston.
The function can be quite easily presented in the form of a graph, while arriving at a formula
to fit past data is a much more complicated task. (Even if such a formula is found, it will
require frequent alteration as data comes in that does not fit the existing formula.) The
function that gives the number of applicants to Harvard College as a function the calendar
year can also be presented much more simply by a graph than by trying to fit a formula to
past data.
1.3 Representations of Functions 29
1990 199119921993199419951996199719981999
13000
14000
15000
16000
17000
year
18000
Applicants to Harvard Collegetemperature
time
Figure 1.14
When graphing functions we use the convention that the independent variable (input)
is plotted along the horizontal axis and the dependent variable (output) is plotted along the
vertical axis.
13
The coordinates of points on the graph are of the form (input, corresponding
output). Given the function f , for every x in the domain of f the point with coordinates (x,
output of f corresponding to x) is a point on the graph of f . Recall that “the output of f
corresponding to x” can be written using the shorthand f(x).Thus the points on the graph
are of the form
(input, corresponding output)
(x, output of f corresponding to x)
(x, value of f at x)
(x, f(x)).
All four expressions carry the same meaning; we usually use the last one.
The height of a graph at a point is the value of the function at that point.
◆
EXAMPLE 1.13 C
E
is the calibrating function for a particular evaporating flask. The graph of C
E
is drawn
below. Use the graph to identify the domain and range of C
E
.
13
When constructing a function to model a situation, you must decide which variable you consider input and which you
consider output. For instance, when calibrating bottles, we consider the input (or independent) variable to be the volume and the
output (dependent) variable to be the height. When using a calibrated bottle for measuring, we consider the input variable to be
the height; the output is the volume.
30 CHAPTER 1 Functions Are Lurking Everywhere
Height
(11, 2)
Volume
Volume → Height
C
E
Figure 1.15
SOLUTION By looking at the graph of C
E
we can tell that the domain of the function, the set of all
possible volumes, is [0, 11] and the range, the set of all possible heights for these volumes,
is [0, 2].
◆
It is useful to be able to obtain information about a function from its graph, as we will
see below.
If x is in the domain of f then the point (x, f(x))is on the graph of f .
If (3, 16) lies on the graph of some function named g, then 3 is an acceptable input of
the function, and 16 is the associated output, so g(3) = 16. If an input of 8 produces
an output of 3, then the point (8, 3) will be on the graph. More generally, if (x
1
, y
1
) is
on the graph of f , then y
1
= f(x
1
).The converse
14
is also true. If y
1
= f(x
1
),then the
point (x
1
, y
1
) is on the graph of f .
If a function is given by an equation y = f(x),then a point (x, y) lies on the graph of
the function if and only if it satisfies the equation y = f(x).
The “if and only if” construction comes up frequently in mathematical discussions, so
we’ll pause for a moment to clarify the meaning of an “if and only if” statement.
Language and Logic: An Interlude.
“A if and only if B” means “A and B are equivalent statements.” Using symbols we write
A ⇔ B. Specifically, “P is a square if and only if P is a rectangle with sides of equal length”
says that the two statements “P is a square” and “P is a rectangle with sides of equal length”
are equivalent. They carry the same information.
A ⇔ B means A ⇒ B and B ⇒ A.
A if and only if B means A implies B and Bimplies A.
14
The word “converse” has a precise meaning in math. Suppose that if A is true, then B is also true. The converse reverses
the two pieces, saying if B is true, A is also true. The converse of a true statement is often not true. For example, the statement “if
a shape is a square, then it is also a rectangle” is true, but the converse (“if a shape is a rectangle, then it is also a square”) is false.