Calculus: An Integrated Approach to Functions and their Rates of Change, Preliminary Edition Part 6 doc
Bạn đang xem bản rút gọn của tài liệu. Xem và tải ngay bản đầy đủ của tài liệu tại đây (226.98 KB, 10 trang )
1.3 Representations of Functions 31
Specific Example General Statement Symbolic
Representation
P is a if and only if P is a rectangle with
square sides of equal length A if and only if BA⇔B
P is a if P is a rectangle with A if B
square sides of equal length
equivalently equivalently
If P is a rectangle with then P is a if B then AB⇒A
sides of equal length square
P is a only if P is a rectangle with A only if B
square sides of equal length
equivalently equivalently
If P is then P is a rectangle with if A then BA⇒B
asquare sides of equal length
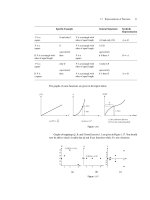
The graphs of some functions are given in the figure below.
V
f(V )
V
π
(a) f(V) =
A(r)
(r, A(r))
r
A
9
2
(b) A(r)=
πr
V
C(V)
volume
height
(c) the calibration function
C(V) for the evaporating flask
Figure 1.16
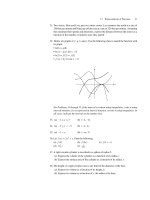
Graphs of mappings Q, R, and S from Exercise 1.1 are given in Figure 1.17. You should
now be able to check visually that Q and R are functions while S is not a function.
x
S
13 6
13 6
x
Q
(3, Q(3)) = (3, 6)
R
x
13 6
6
4
2
–6
–4
–2
(3, R(3)) = (3,
)
16
15
14
13
12
11
π
π
(a) (b) (c)
Figure 1.17
32 CHAPTER 1 Functions Are Lurking Everywhere
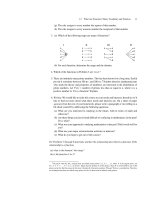
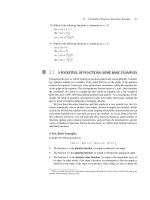
EXERCISE 1.3 Two of the four graphs given in Figure 18 are the graphs of functions.
15
Which two are they?
Can you come up with a rule for determining whether or not a given graph is the graph of
a function?
x
y
y
x
x
y
y
x
(a) (b) (c) (d)
Figure 1.18
Answer
We can tell that the relationships represented in Figures 1.16(a)–(c), 1.17(a) and (b), and
1.18(b) and (d) are, in fact, functions. The test for a function is that every input must have
only one output assigned to it; graphically, this means if we draw a vertical line through any
point on the horizontal axis, this line cannot cross the graph in more than one place. (The
vertical line will not cross the graph at all if it is drawn through a point on the horizontal
axis that is not a valid input, i.e., not in the domain of the function.) This test for deciding
if a graph represents a function is called the vertical line test.
x
y
y
x
x
y
y
x
(a) (b) (c) (d)
Not the graph
of a function
Not the graph
of a function
Figure 1.19 Vertical line test
Let’s return to the problem of calibrating bottles. When we calibrate a bottle we put in a
known volume of liquid and the calibration function C(v) produces a height. Once we have
calibrated a bottle we can then use it as a measuring device. We turn the procedure around
so that the height becomes the input while the volume is the output. The key ingredient
that makes the original volume-height assignment useful is that not only does each volume
correspond to one height but each height corresponds to only one volume. The calibration
function is 1-to-1. A function f that is 1-to-1 has an inverse function that “undoes” f . The
domain of the inverse function is the range of f ;iff maps a to b then its inverse function
mapsbtoa.
16
EXERCISE 1.4 Given the graph of a function, how can we determine whether the function is 1-to-1?
15
The conventions about hollow and filled circles are the same as they are for interval notation. A hollow circle denotes a
point that is not on the graph, while a filled circle indicates that the point is on the graph.
16
Sometimes people mistakenly think of the words “inverse” and “reciprocal” as being the same. The inverse of the function
f undoes f .Iff adds 3 to its input then its inverse function subtracts 3; if f multiplies its input by 3 then its inverse function
divides by 3. If f maps 7 to 11 then its inverse function maps 11 to 7. On the other hand, the reciprocal of N is simply 1/N .
1.3 Representations of Functions 33
Answer
By the horizontal line test: If any horizontal line intersects the graph in more than one place,
then the function is not 1-to-1; if no horizontal line intersects the graph in more than one
place, then the function is 1-to-1.
Functions: The Grand Scheme
In this text we will be looking at functions of one variable—but not all functions are
functions of one variable. For instance, suppose you were to calculate the value, V ,of
the change in your pocket. V is a function of q, d, n, and p, where q, d, n, and p are the
number of quarters, dimes, nickels, and pennies, respectively, in your pocket. We can write
this function as
V = f(q,d,n,p) = 25q + 10d + 5n + p.
As another example, suppose we denote by V the volume of a fixed mass of gas, by T
its temperature on the Kelvin scale, and by P its pressure. Then the combined gas law tells
us that
PV
T
= k, where k is a constant,
or, equivalently,
V =
k
P
· T .
We see that the volume of the gas will depend upon both the pressure and the temperature.
V is a function of two variables, V = f(P,T).Ifpressure is held constant, then volume is
directly proportional to temperature; as the temperature of a gas goes up, the volume goes
up as well.
V = (a constant) · T is the gas law of Charles and Gay-Lussac.
In other words, if pressure is held constant, then V can be expressed as a function of one
variable.
Think back to Example 1.9 where we were expressing the volume of water in a conical
coffee filter as a function of the height of the water. We began by writing V =
1
3
πr
2
h, where
both r, the radius of the liquid, and h, the height of the liquid are variables. We wanted to
express V as a function of only h. In this example we cannot simply say “let r be a constant,”
since h cannot vary without r varying. Instead, we found a relationship between h and r
that allowed us to express the former in terms of the latter, resulting in a function of only
one variable.
Because our focus will be on functions of one variable, when we do modeling we
need to determine one independent variable and one dependent variable, for a total of two
variables. If we appear to have more variables, then it is necessary to do one of two things:
Figure out how we can express one of the variables in terms of another, or
be less ambitious with our model, treating some quantities as constants when it is
reasonable to do so.
34 CHAPTER 1 Functions Are Lurking Everywhere
PROBLEMS FOR SECTION 1.3
1. (a) Consider the following graphs. For each graph decide whether or not y is a function
of x. If it is a function, determine the range and domain.
x
y
-5 -4 -3 -2 -1 123456
5
4
3
2
1
-1
-2
x
y
-3 -2 -1 1 2
3
456
5
4
3
2
1
-1
-2
-3
x
y
-4 -3 -2 -1 123456
5
4
3
2
1
-1
-2
7
-3
-4
x
y
-5 -4 -3 -2 -1 123456
3
2
1
-1
-2
x
y
-5 -4 -3 -2 -1 123456
3
2
1
-1
-2
x
y
-5 -4 -3 -2 -1 123456
3
2
1
-1
-2
x
y
-5 -4 -3 -2 -1 1 2 3 4 5 6
5
4
3
2
1
-1
-2
x
y
-5 -4 -3 -2 -1 123456
5
4
3
2
1
-1
-2
x
y
-5 -4 -3 -2 -1 123456
5
4
3
2
1
-1
-2
(a) (b) (c)
(d) (e) (f)
(g) (h) (i)
(b) Are any of the functions from part (a) 1-to-1? If so, which ones?
In Problems 2 through 4 find the domain of each of the functions.
2. (a) f(x)=
1
x+2
(b) g(x) =
5
x
2
+4
1.3 Representations of Functions 35
3. (a) f(x)=
√
x (b) g(x) =
√
x − 3 (c) h(x) =
√
x
2
− 4
4.
(a) f(x)=
1
x+1
(b) g(x) =
x
x+1
(Hint: Keep in mind that if the numerator and denominator of a fraction are both
negative, then the fraction is positive.)
5. Find the range of the functions in Problems 2 through 4.
6. Let g(x) be the function graphed below with domain [−5, 4]. Use the graph to answer
the following questions.
(a) What is the range of g?
(b) Is g(x) 1-to-1?
(c) Where does g take on its highest value? Its lowest value?
(d) What is the highest value of g?
(e) What is the lowest value of g?
(f) For what x is g(x) =0?
(g) Approximate g(0).
(h) Approximate g(−4).
(i) Approximate g(π) and g(−π).
(j) For approximately what values of x is g(x) = 1?
(k) For approximately what values of x is g(x) < −1?
x
4321
1
–
1
–
2
2
3
–
1
–
2
–
3
–
4
–
5
(
–
5,
–
2)
(
–
3, 3)
(4,
–
1)
g
7. Two functions are equivalent if they have the same domain and the same input/output
relationship. The first function listed on each line below is called f . Which of the
functions listed on each line are equivalent to f ? The domain of each function is the
set of all real numbers. (Be careful to think about the sign of each function.)
(a) f(x)=−2x
2
g(w) =(−2w)
2
i(t) =2(−t
2
) j(x) =−
√
2x
2
√
x
2
√
2
(b) f(x)=(2x −1)
2
g(c) =(1 −2c)
2
h(t) =1 − 2t
2
j(x)=1−(2x)
2
(c) f(x)=
√
x
2
λ(m) =m T (x) =
(−x)
2
ϕ(s) =|s|
36 CHAPTER 1 Functions Are Lurking Everywhere
8. Below is a graph of the function f . Use it to approximate the following.
(a) The value of f at x =−1, x = 0, and x = 1
(b) All x such that f(x)=0
(c) All x such that f(x)=2
(d) −f(0)+2f(3)
x
f
–2
–1
–1
1
1
2
3
234
9. Below is a graph of the function g. Use it to approximate the following.
(a) g(−2), g(0), g(1)
(b) All t such that g(t) = 0
(c) All t such that g(t) = 1
(d)
g(−1) + g(1)
2
(e) g(3) + 3g(1)
t
g
–2–3
–1
–1
–2
1
1
2
2345
10. The graph of h is given at the top of page 37.
(a) Give the domain and range of h.
(b) Evaluate h(0), h(1), h(2).
(c) Fill in the output values on the table.
1.3 Representations of Functions 37
x h(x)
−0.5
−0.01
0
0.1
0.5
1.5
1.95
2
2.01
(d) Find all x such that h(x) = 3. Use inequalities in your answer.
(e) Find all x such that h(x) = 1. Use interval notation, paying attention to [ versus (.
x
h
–2–3
–1
1
1
2
3
4
234
11. The graph of k is given below.
(a) Give the domain and range of k.
(b) Find 2k(−1) + [k(−1)]
2
+ k((−1)
2
).
(c) Find all t such that k(t) = 2.
x
k
1
–1
1
2
3
(2, 1)
(–1, 2)
(3, 3)
(4, 2)
234
12. Consider the functions f , g, h, and k presented as graphs in Problems 8 through 11.
Which, if any, of these functions are 1-to-1?
38 CHAPTER 1 Functions Are Lurking Everywhere
13. The graphs of f and g are given below. Approximate the following.
(a) All x such that f(x)= g(x)
(b) All x such that g(x)>f(x)
x
y
g
f
1–1–2–4
2 3 4 5 6 7 8
14. Determine whether or not the given graph is the graph of a function.
x
y
x
y
x
y
x
y
(a)(b)
x
y
x
y
(d)(d)
(e)
(f)
x
y
(g)
15. Draw the graph of a function f that is 1-to-1 and a function g that is not 1-to-1.
1.3 Representations of Functions 39
x
f
(– 4, –3)
(5, 3)
x
k
(–3, –2)
(4, 6)
x
g
(3, 2)
(– 4, –3)
The graph of a function is given in Problems 16 through 22. Determine the range and
domain. Is the function 1-to-1?
16.
17.
x
h
(–3, –1)
1
(4, 5)
18.
19.
x
m
3–3
–2
2
20.
21.
x
j
(–5, – 4)
(4, 5)
22.
x
(–3, .01)
(3, –.01)
ഞ
40 CHAPTER 1 Functions Are Lurking Everywhere
23. You make yourself a hot cup of tea. The telephone rings, distracts you, and when you
return the tea is at room temperature. Sketch a rough graph of the function T(t),where
t is the time, in minutes, from when the phone rings, and T(t)is the temperature of the
tea at time t.
24. Your neighbor prunes his hedge once every three weeks. Sketch a rough graph of h(t),
the height of the hedge as a function of time, where t = 0 corresponds to a pruning
session, and t is measured in weeks. Let the domain of the function be [0, 10].
25. First Slice is a “come from behind” horse. He starts out slowly and comes on at the
end. Tass is a sprinter, starting out fresh and tiring at the end. First Slice and Tass both
run a mile in 1:12. On the same set of axes, graph F(t)and T(t),the distances traveled
by First Slice and Tass, respectively, as a function of time t, t in seconds.
26. Express the area of a circle as a function of:
(a) its diameter, d. (b) its circumference, c.
27. Express the surface area of a cube as a function of the length s of one side.
28. A closed rectangular box has a square base. Let s denote the length of the sides of the
base and let h denote the height of the box, s and h in inches.
(a) Express the volume of the box in terms of s and h.
(b) Express the surface area of the box in terms of s and h.
(c) If the volume of the box is 120 cubic inches, express the surface area of the box
as a function of s.
29. You are constructing a closed rectangular box with a square base and a volume of 200
cubic inches. If the material for the base and lid costs 10 cents per square inch and the
material for the sides costs 7 cents per square inch, express the cost of material for the
box as a function of s, the length of the side of the base.
30. A rectangle is inscribed in a semicircle of radius R, where R is constant.
(a) Express the area of the rectangle as a function of the height, h, of the rectangle,
A = f (h).
(b) Express the perimeter of the rectangle as a function of the height, h, of the
rectangle, P = g(h).
R
h