Calculus: An Integrated Approach to Functions and their Rates of Change, Preliminary Edition Part 10 pps
Bạn đang xem bản rút gọn của tài liệu. Xem và tải ngay bản đầy đủ của tài liệu tại đây (217.18 KB, 10 trang )
2.2 A Pocketful of Functions: Some Basic Examples 71
If P is the pressure of a gas, T is its temperature, and V is its volume, then the
combined gas law tells us that for a fixed mass of gas
PV
T
= a constant.
From this statement, demonstrate the following.
(a) If temperature is held constant, then pressure is inversely proportional to volume
(Boyle’s Law). (This should make sense intuitively; as pressure increases, volume
decreases.)
(b) If pressure is held constant, then volume is directly proportional to temperature
(Law of Charles and Gay-Lussac). (This too should make sense intuitively; as the
temperature of a gas goes up, volume goes up as well.)
2. Physicists define the work done by a force on an object to be the magnitude of the force,
F , times the distance, d, that the object is moved. Notice that this definition is different
from our conversational use of the word “work.” For instance, if you stand holding
a 50-pound object stationary for an hour, then according to the physicists’ definition
you have done no work because the object has not moved. According to the physicists’
definition, if force is kept constant is the work done proportional to the distance the
object moves. Explain.
3. The following problems are warm-up exercises for absolute values.
(a) Express the following without using absolute value signs.
i. −5|−|−3
ii. |x −3| (You need two cases.)
(b) Express the following using absolute values.
i. The distance between −5 and π
ii. The distance between
√
3 and π
(c) Fill in the blanks in the following table.
Algebraic Statement Geometric Statement
i. |x −c| > 6 x is more than 6 units from c
ii. |x −3|> 2
iii. c is closer to 0 than b is
iv. |x −3|≤4
v. w is 6 units from d
vi.
q is at most 18 units from 5
4. Use the geometric interpretation of absolute value to solve the following equations and
inequalities. Display the solutions on a number line.
(a) |x +3|< 2
(b) |x −5|≤3
(c) |x −a|=b, where a and b are positive
(d) |x +a|≤a, where a is positive
72 CHAPTER 2 Characterizing Functions and Introducing Rates of Change
5. Use the algebraic interpretation of absolute value to solve each of the following. Please
display your answers on a number line.
(a) |2x + 1/2|≤6 (b) |3x − 4| > 8
6. Solve the following inequalities. Display your answers on a number line using interval
notation.
(a) −2x − 7 < −8 (b) |−2x−8|≥2 (c) |−2x−8|<2
7. Solve these inequalities and explain your answers: Think carefully.
(a) |3x − 4| > −4 (b) |3x − 4| > 0 (c) |3x − 4| < −4
8. Which of the following statements are true and which are not always true? For a
statement to be true, it must always be true. If a statement is not always true, give
a counterexample. To give a counterexample is to give an example of values for x and
y for which the statement is false.
(a) |x
2
|=|x|
2
(b) |x|=|−x|
(c) |x − y|=|x|−|y| (d) |x + y|=|x|+|y|
(e)
|x|
|y|
=
x
y
for y = 0 (f) |x||y|=|xy|
(Four of the statements are true.)
9. Use absolute values to write the following statement more compactly: Whenever x is
within 0.02 of 7, f(x)differs from 19 by no more than 0.3.
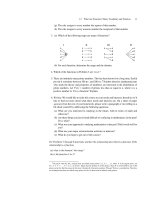
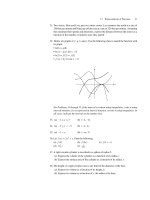
10. Refer to the accompanying figure. Given the graph of f(x)below, for which values of
x is:
(a) f(x)=0? (b) f(x)discontinuous? (c) f(x)<0?
x
f
–2–3– 4–5 –11
234 567
11. Let h(x) =|x|.Solve the following. Do parts (a) and (b) twice—once using an analytic
approach and once using a geometric approach.
(a) h(x + 2) ≤ 3 (b) h(x − 1) = 5 (c) h(x + 3) ≥ 0.1 (d) h(3x + 1)>4
12. Let h(x) =|x|.Solve the following.
(a) 2h(x) > 4 (b) h(2x − 1) ≤ 3 (c) h(x
2
− 1) ≥ 0
In Problems 13 through 18, determine whether the function is even, odd, or neither.
13. (a) f(x)=x
2
+3x
4
(b) g(x) =
1
x
2
+3x
4
2.3 Average Rates of Change 73
14. (a) f(x)=2x
3
+3x (b) g(x) = 2x
3
+ 3x + 1
15. (a) f(x)=
x
2
−1
x
3
(b) g(x) =
x
2
−1
x
4
+1
16. (a) f(x)=|x|+3 (b) g(x) =−2|x|
17. (a) f(x)=
1
x
2
(b) g(x) =
2
x
3
18. (a) f(x)=x+
1
x
(b) g(x) = 1 +
1
x
19. Let f(x)=
1
x
. Solve the following.
(a) f(x
2
)=1 (b) −f(x)=f(x−1) (c) 2f(x −2)=f(x+3)
20. A function can be neither even nor odd. For example, consider f(x)=x
3
+x
2
.Can a
function be both even and odd? If your answer is yes, give an example. Can you give
two examples?
2.3 AVERAGE RATES OF CHANGE
The problem of how to determine the rate at which the output of a function is changing is
the fundamental question that gives rise to differential calculus. In Section 2.1 we discussed
characterizing a function by describing where it is increasing and where it is decreasing.
Suppose we want to be more specific and determine the function’s rate of increase or rate
of decrease. We first explored this question when looking at the calibration of a bottle
and discussing how a change in the volume of water changes the height. In the case of
a cylindrical beaker we saw that the ratio
change in height
change in volume
is constant. We refer to this ratio as the rate of change of water level “with respect to volume.”
In the case of the conical flask, we saw that this ratio is not constant. We continue our
exploration of rates of change in this section.
◆
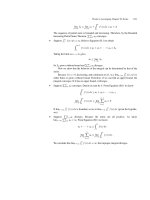
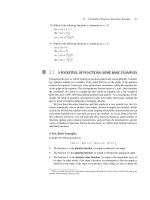
EXAMPLE 2.5 Below is a graph of y = T(t), which gives the temperature in Green Bay, Wisconsin, as
a function of time between 6 a.m. and 11 a.m. on a cold day. We can see from the graph
that the temperature is increasing throughout this time interval (sometimes negative and
sometimes positive, but always increasing).
74 CHAPTER 2 Characterizing Functions and Introducing Rates of Change
T
Temperature (°C)
(11, 12)
(6, –3)
t (time)
611
Suppose we want to determine how fast the temperature is increasing between 6 a.m.
and 11 a.m. (“Why?” you may ask. Perhaps a football game is starting at noon and you
would like to guess the temperature at the start of the game.) Although the temperature is
not increasing at a constant rate, we know that it has increased 15 degrees (from −3to+12)
in a 5-hour span, so it is increasing at an average rate of 3 degrees per hour. In mathematical
notation, we calculate the average rate of change of temperature with respect to time as
follows:
Average rate of change of temperature =
change in temperature
change in time
=
final temperature − initial temperature
final time − initial time
=
15 degrees
5 hours
= 3
degrees
hour
(Therefore, to answer the question posed above, you might guess that the temperature will
increase about three more degrees in the next hour before the game starts, making the kickoff
temperature a balmy 15 degrees—perfect weather for going to a Packers game.)
◆
We’ ll use the next example to distinguish between three different notions:
i. Change in price is (final price − initial price).
ii. Percent change in price is
change in price
initial price
.
(This gives percent as a decimal: 0.05 = 5%.)
iii. Average rate of change of price with respect to time is
change in price
change in time
.
2.3 Average Rates of Change 75
◆
EXAMPLE 2.6 The Boston Globe (summer, 1999) reports that average apartment-rental prices in the
Allston-Brighton neighborhood of Boston have gone up 53 percent in the past six years.
For instance, a two-bedroom apartment that was being rented for $800 in 1993 could be
renting for $1224 in 1999. Find:
i. the change in price,
ii. the percent change in price,
iii. the average rate of change in price over the six-year period specified.
SOLUTION i. The change in price is $424. It is measured in dollars.
ii. The percent change in price is
$424
$800
= 0.53 = 53%. It is unitless.
iii. The average rate of change of the price with respect to time is
$424
6 years
≈ 70.67 $/year.
It is measured in dollars per year.
◆
In this section we will be focusing on average rate of change.
Definition
The average rate of change of a function y = f(x)over the interval from x = a to
x = b is given by
average rate of change of f on [a, b] =
f(b)−f(a)
b − a
.
In other words,
average rate of change of f =
f
x
=
y
x
.
Geometrically, the average rate of change represents the slope of the line between the two
points used. This is because the average rate of change of f on [a, b]isgivenby
change in output
change in input
=
change in y
change in x
=
rise
run
,
which gives the slope of a straight line through the points (a, f(a))and (b, f(b)).
A line through two points on a curve is called a secant line. Therefore, the average
rate of change of f on [a, b] is the slope of the secant line through the points (a, f(a))and
(b, f(b)).
76 CHAPTER 2 Characterizing Functions and Introducing Rates of Change
ab
x
f(x)
slope =
(b, f(b))
(a, f(a))
∆y = f(b) – f(a)
∆x = b – a
∆y
∆x
Figure 2.19
Average velocity over a time interval is the average rate of change of position with
respect to time:
average velocity =
position
time
.
Suppose, for example, that we’re analyzing the motion of a cheetah. If s(t ) gives the
cheetah’s position at time t, then the cheetah’s average velocity from time t = 1 to time
t = 5 is given by:
position
time
=
s
t
=
s(5) − s(1)
5 − 1
.
In colloquial English, to accelerate is to pick up speed. Mathematically, acceleration
refers to the rate of change of velocity with respect to time:
average acceleration =
velocity
time
.
◆
EXAMPLE 2.7 Suppose we are filling a bucket with water. We have the following information, where time
is measured in seconds, amount of water in liters, and height of the water in centimeters.
Time Amount of Water Height of Water
00 0
11.5 4
24 9
The average rate of change of volume with respect to time over the time interval [0, 1] is
given by
volume
time
=
1.5 − 0
1 − 0
liters
sec
= 1.5
liters
sec
.
2.3 Average Rates of Change 77
The average rate of change of volume with respect to time over the time interval [1, 2] is
given by
volume
time
=
4 − 1.5
2 − 1
liters
sec
= 2.5
liters
sec
.
The average rate of change of height with respect to time over the time interval [2, 0] is
given by
height
time
=
9 − 0
2 − 0
cm
sec
= 4.5
cm
sec
.
The average rate of change of height with respect to volume as the volume increases from
1.5 to 4 liters is given by
height
volume
=
9 − 4
4 − 1.5
cm
liter
=
5
2.5
cm
liter
= 2
cm
liter
.
◆
◆
EXAMPLE 2.8 A trucker drives west a distance of 240 miles stopping only once to get gas. He begins the
trip parked at a truck stop and ends the trip parked at another truck stop. The trip takes him
4 hours. What is his average velocity? Did he ever exceed the 60-mile-per-hour speed limit?
SOLUTION His average velocity for the trip is given by
change in position
change in time
=
240 miles
4 hours
= 60 mph.
He stopped once for gas and began and ended the trip with zero velocity; therefore he
wasn’t traveling at 60 mph all the time. There must have been some times when his speed
exceeded the 60 mph speed limit. While verifying this mathematically takes some work,
this conclusion should make logical sense to you.
10
His velocity is varying; he is not always
traveling at 60 mph.
Notice that his average velocity is not the average of his final and initial velocities. His
final and initial velocities are both zero, but his average velocity is certainly positive. We
will return to rates of change in Chapter 5.
◆
PROBLEMS FOR SECTION 2.3
1. The average price of an 8-ounce container of yogurt in upstate New York was 35 cents
in 1970. In 2000 the average price had risen to 89 cents.
(a) What is the price increase?
(b) What is the percent increase in price?
(c) What is the average rate of change in price from 1970 to 2000?
2. The average price of a 12-ounce cup of coffee in Seattle is modeled by the function
p(t), where t is the number of years since 1950 and p(t) is price in dollars. Express
the following using functional notation.
10
The theorem assuring us that this is true is called the Mean Value Theorem. It is proven in Appendix C.
78 CHAPTER 2 Characterizing Functions and Introducing Rates of Change
(a) The increase in the price of a cup of coffee in Seattle from 1970 to 2000
(b) The percent increase in the price of a cup of coffee in Seattle from 1970 to 2000
(c) The average rate of change of the price of a cup of coffee from 1970 to 2000
3. The graph of a function f is given below.
ab cd
f
x
(a) Put in ascending order (smallest to largest) f(a),f(b),f(c),f(d).
(b) Determine which of the expressions listed below are positive. Then put the expres-
sions in ascending order, with < or = signs between them.
f(b)− f(a) f(b)− f(c) f(d)− f(c)
(c) Determine which of the expressions listed below are positive. Then put the expres-
sions in ascending order, with < or = signs between them.
f(b)− f(a)
b − a
f(a)− f(b)
a − b
f(c)− f(b)
c − b
f(d)− f(c)
d − c
f(d)− f(b)
d − b
4. Consider the statement “Colleges report that their tuition increases are slowing down.”
Suppose we set t = 0 to be three years before this statement was made and measure
time in years. If we let T(t)be the average college tuition in year t, put the following
expressions in ascending order (the smallest first), assuming the statement is true.
T(3)−T(2) 0 T(2)− T(1)
T(3)−T(1)
3 − 1
5. The Boston Globe (August 31, 1999, p.1) reports: “While the number of AIDS deaths
continues to drop nationally, the rapid rate of decline that had been attributed to new
drugs is starting to slow dramatically.” The newspaper supplies the following data.
Year Number of Deaths Attributed to AIDS
1995 149,351
1996 36,792
1997 21,222
1998 17,047
Let D(t) be the number of deaths from AIDS in year t, where t is measured in
years and t = 0 corresponds to 1995.
2.3 Average Rates of Change 79
(a) Is D(t) positive or negative? Increasing or decreasing?
(b) What is the average rate of change of D(t) from t = 0tot=1? What is the percent
change in D(t) over that year?
(c) What is the average rate of change of D(t) from t = 1tot=2? What is the percent
change in D(t) over that year?
(d) What is the average rate of change of D(t) from t = 2tot=3? What is the percent
change in D(t) over that year?
6. The average rate of change of a function f over the interval a ≤ x ≤ b is defined to be
f
x
=
f(b)−f(a)
b − a
.
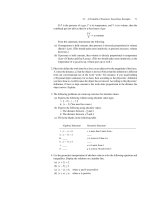
Let P(t) be the size of a population at time t. The graph of P(t) is given below.
(a) Using functional notation, write an expression for the average rate of change of
the population over the interval t
1
≤ t ≤ t
2
.
(b) Using functional notation, write an expression for the average rate of change of
the population over the interval t
2
≤ t ≤ t
3
.
(c) Which expression is larger, your answer to part (a) or your answer to part (b)?
t
P(t)
t
1
t
2
t
3
7. Let h(t) denote the height of a rocketship t seconds after takeoff.
(a) Express the average rate of change of height of the rocket betweeen 2 and 2.01
seconds after takeoff in terms of the function h.
(b) Express the average rate of change of height (average vertical velocity) of the
rocket on the time interval [a, a + 0.001] in terms of h.
(c) Express the average vertical velocity of the rocket on the time interval [a, a + k].
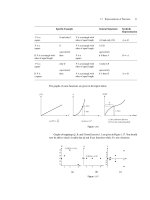
8. Find the average rate of change of f(x)=
1
x
2
+1
on each interval. Simplify your answer.
(a) [1, 3]
(b) [1, 1.5]
(c) [1, 1.01]
80 CHAPTER 2 Characterizing Functions and Introducing Rates of Change
(d) [1, 1 + h] (Show that your answer agrees with the answers you obtained in parts
(a), (b), and (c).)
(e) Illustrate your answers to parts (a), (b), and (c) by sketching f(x) and drawing
secant lines whose slopes correspond to these average rates of change.
9. Answer the previous question using g(x) = 2x
2
+ 3x instead.
10. Find the average rate of change of f(x)=x
2
overeach of the following intervals.
(a) [0, 3]
(b) [1, 4]
(c) [2, 5]
(d) [a, a + 3]
(e) [a, a + h]
11. Find the average rate of change of g(t) =
t
t
2
+2
+ 3t over the intervals [−1, 1], [0, 2],
[1, 1 + p].
12. A bicyclist does a one-mile climb at a constant speed of 12 miles per hour followed by
a one-mile descent at a constant speed of 30 miles per hour.
(a) Sketch a graph of distance traveled as a function of time. Assume the cyclist starts
at t = 0 minutes, and be sure to label the times at which he reaches the top and
bottom of the hill.
(b) What is his average speed for the two miles? Is this the same as the average of 12
mph and 30 mph? Explain why or why not.
13. A backyard pool is a cylinder sitting above the ground and measuring 3.5 feet in height
and 20 feet in diameter.
(a) Express the volume of water in the pool as a function of the height h of the water.
(Note: The domain of this function, the set of all acceptable inputs, is 0 ≤ h ≤ 3.5.)
(b) Sketch a graph of volume versus height.
(c) What is the range of the function? Make sure this is indicated on your graph.
(d) How much additional water is needed to increase the depth of water in the pool by
1 foot? By 1/2 foot? Is
V
h
constant? If so, what is it?
(e) You’ve expressed the rate of change of volume with respect to height in terms of
ft
3
/ft, but the volume of water is more likely to be measured in gallons or liters.
Knowing that 1 gallon ≈ 0.16054 ft
3
, convert your answer to gallons/ft.
(f) Is the volume of water in the pool directly proportional to the height of water?
14. During the 1996 Summer Olympics in Atlanta, track and field world records were set
in both the men’s 100 meters dash and the men’s 200 meters dash. Donovan Bailey
won the 100 in 9.86 seconds, and Michael Johnson won the 200 in 19.32 seconds.
(a) What was the average speed of each runner? Which race had the higher average
speed? Explain why you think this might be so. Please use graphs to illustrate your
answer.