Calculus: An Integrated Approach to Functions and their Rates of Change, Preliminary Edition Part 11 doc
Bạn đang xem bản rút gọn của tài liệu. Xem và tải ngay bản đầy đủ của tài liệu tại đây (232.97 KB, 10 trang )
2.3 Average Rates of Change 81
(b) In 1996 the record for 400 meters was 43.29, set by Butch Reynolds. How does this
average speed compare to the two given above? Does the “pattern” of the longer
race having a higher average speed continue if we include the 400 meter? Give a
possible reason for this.
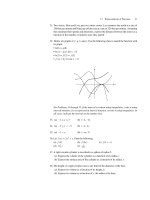
15. A and B are points on the graph of f(x)=
1
x
2
. The x-coordinate of point A is 3 and
the x-coordinate of point B is (3 + h). Which of the expressions below correspond to
the average rate of change of f on the interval [3, 3 + h]?
(a)
1
9
+h−
1
9
h
(b)
1
(3+h)
2
−
1
9
h
(c)
1+h
9
−
1
9
3
(d)
1
9
+
1
h
−
1
9
(e)
1
(3+h)
2
−
1
9
3
82 CHAPTER 2 Characterizing Functions and Introducing Rates of Change
Exploratory Problems for Chapter 2
Runners
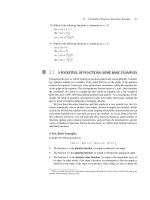
1. Early one morning three runners leave Washington State Univer-
sity in Pullman and run the Palouse Path
11
joining their town to
the University of Idaho. Alicia, Bertha, and Catrina run for 1 hour.
The graphs below give position, s(t ), as a function of time, for
each of the runners. The position function gives position mea-
sured from the start of the path from time t = 0tot.The runners’
position graphs are labeled A, B, and C, respectively.
(a) Narrate the run, comparing and contrasting the running styles
of the three women.
(b) Compare the average velocities of the three runners.
(c) Who is ahead after 1 hour of running?
A
B
C
s (position)
in km
t (time)
in hrs.
1
12.5
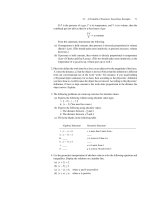
2. At lunchtime Amir, Baboucar, and Carlos leave Washington State
University and head for the University of Idaho along the same
trail. The graphs on page 83 give velocity, v(t), as a function of
time for each of the runners. Each man runs for an hour. Their
position graphs are labeled A, B, and C, respectively.
11
This path, officially called the Bill Chipman Palouse Path, is a rails-to-trails conversion com-
pleted in the late 1990s. It joins the small college towns of Pullman, Washington, and Moscow, Idaho,
along a defunct railway track.
Exploratory Problems for Chapter 2 83
A
B
C
v (velocity)
km/hr
t (time)
1
(a) Narrate the run. Be sure to mention who is the frontrunner and
who is behind after half an hour and then after 1 hour. Compare
and contrast the runners’ running styles.
(b) Compare the average velocities of the runners for the 1-hour
time block.
(c) Compare the average accelerations of the runners for the 1-
hour time block.
84 CHAPTER 2 Characterizing Functions and Introducing Rates of Change
2.4 READING A GRAPH TO GET INFORMATION
ABOUT A FUNCTION
The graph of a function carries a great deal of information about the function. In the
examples that follow we investigate some graphs and the information they contain. In the
next example we will look at a position graph; we follow this by looking at a rate graph.
◆
EXAMPLE 2.9 Figure 2.20 gives information about a bike ride along Route 1A, a road going north-south
along the coast of Massachusetts from the Boston area, through a town called Lynn, and past
Salem. The graph tells us the cyclist’s position, p, along the road (in miles) as a function of
time: p = f(t).Wewill use the town of Lynn as our benchmark for measuring position; we
indicate that the cyclist is 2 miles north of Lynn by setting position equal to 2 and indicate
that the cyclist is 2 miles south of Lynn by writing position equals −2. We let the benchmark
time of 12 noon correspond to t = 0.
–1 –0.5 0.5 1 1.5 2 2.5 3 3.25
–6
7
12
time
(in hours after noon)
position
(miles)
Figure 2.20
Use the graph in Figure 2.20 to answer the following questions.
i. Where (in relation to Lynn) and at what time does the bike trip start?
ii. Interpret the intercepts on the horizontal axis and the intercept on the vertical axis in
terms of the trip.
iii. When is the cyclist traveling north? South?
iv. Salem is about 7 miles north of Lynn. Does the cyclist ever reach Salem? If so,
approximate the time she gets there. If she comes back through Salem, indicate that
time.
v. What is the cyclist doing between noon and 1:00 p.m.?
vi. We define speed to be the absolute value of velocity. Speed is always nonnegative; it
gives no information about direction.
What is the cyclist’s average speed between 2:00 p.m. and 3:15 p.m.?
What is the cyclist’s average velocity between 2:00 p.m. and 3:15 p.m.?
vii. Does the cyclist ever turn around and change direction? When?
2.4 Reading a Graph to Get Information About a Function 85
viii. What is the farthest north of Lynn the cyclist ever gets? What is the farthest south?
ix. Does she begin and end the trip in the same place?
SOLUTION First we will answer these question colloquially, and then we will use the notation of
functions introduced in Chapter 1.
i. The trip starts 6 miles south of Lynn at 11:00 a.m. f(−1)=−6, where t =−1
corresponds to 11:00 a.m. and p =−6corresponds to a place 6 miles south of Lynn.
ii. The horizontal intercepts, solutions to the equation f(t)=0,indicate when she passes
through Lynn. The vertical intercept, f(0), indicates her position relative to Lynn at
time t = 0. f(0)=7,soshe is 7 miles north of Lynn at noon.
iii. She is going north when the graph is increasing; this is from 11:00 a.m. to noon and
again from 1:00 p.m. to 2:00 p.m. She is going south when the graph is decreasing; this
is from 2:00 p.m. to 3:15 p.m. (Note that t = 3.25 corresponds to 3:15 p.m.)
iv. Yes. She reaches Salem for the first time at noon, when her position is +7. She returns
through Salem the next time her position is +7, or at about 2:30 p.m. Answering this
question is equivalent to finding t such that f(t)=7. Notice that the position function
is not 1-to-1.
v. She is not moving. Perhaps she is taking a break in Salem or changing a flat tire.
vi. During this time period she travels 12 miles. The time period is 1.25 hours long, so her
average speed is (12 miles)/(1.25 hours) = 9.6 miles per hour.
At 2:00 p.m. t = 2 and at 3:15 p.m. t = 3.25. Therefore, her average velocity can
be expressed as
f(3.25) − f(2)
3.25 − 2
=
0 − 12
1.25
=−9.6
The sign of velocity indicates direction. The negative sign indicates that the cyclist
is going south. A positive velocity would indicate that she is biking north (because
position, p, increases as she goes north).
When her velocity is −9.6 mph her speed is 9.6 mph.
vii. Yes, she turns around when the graph changes from increasing (going north) to de-
creasing (going south). This happens at 2:00 p.m.
viii. The farthest north corresponds to the maximum of the graph, which is 12 miles. The
farthest south is represented by the minimum, which is −6, or 6 miles south of Lynn.
ix. No. She starts 6 miles south of Lynn, but she finishes in Lynn.
◆
◆
EXAMPLE 2.10 Figure 2.21 is the graph of a different bike ride; now the graph represents velocity, v,asa
function of time. v = f(t).When velocity is negative the rider is moving south, and when
velocity is positive she is moving north. Here again, time t = 0 represents noon.
CAVEAT While this graph is similar in shape to Figure 2.20, the two graphs represent
completely different bike rides. A common error is to be drawn in by the shape of a graph
and leap headlong into a tangled web of incorrect conclusions without stopping to look at
the labeling of the axes of the graphs. You can be misled by not reading graphs carefully!
The story told by a graph hinges very much on the labeling of the axes.
86 CHAPTER 2 Characterizing Functions and Introducing Rates of Change
–1 –0.5 0.5 1 1.5 2 2.5 3 3.25
–6
7
12
time (hrs)
velocity (mph)
Figure 2.21
Use the graph to answer the following questions.
i. During what time period(s) is the cyclist riding south? North?
ii. Interpret the intercepts on the horizontal axis and the intercept on the vertical axis in
terms of the trip.
iii. When is the cyclist traveling most rapidly south? Most rapidly north?
iv. Does the cyclist ever change direction? If so, when?
v. Does the cyclist ever stop? If so, when?
vi. Can you determine where the cyclist started her trip?
vii. What is the cyclist’s maximum speed? Minimum speed?
SOLUTION i. She is moving south when velocity is negative (below the horizontal axis)—from
11:00 a.m. until 11:30 a.m She is moving north when velocity is positive (above the
horizontal axis)—from 11:30 a.m. until 3:15 p.m.
ii. The horizontal intercepts (at −0.5 and 3.25) indicate times when her velocity is zero.
Her velocity is zero at 11:30 a.m. and 3:15 p.m. The vertical intercept gives her velocity
at noon. She is traveling 7 mph north at noon.
iii. She is traveling most rapidly south when the graph lies furthest below the t -axis—at
11:00 a.m. She is moving most rapidly north when the graph lies furthest above the
t -axis—at 2:00 p.m.
iv. She turns around when her velocity changes sign (either positive to negative or vice
versa). This occurs at 11:30 a.m.
v. She stops for an instant to turn around at 11:30 a.m. and stops again at 3:15 p.m., when
her velocity hits zero.
vi. We cannot determine where she started because this is only a graph of velocity. We
have absolutely no idea where any of this takes place. The biker could have begun her
trip in Lynn, in Seattle, in Bangkok—anywhere there is a north-south route.
vii. Her maximum speed is 12 mph, and her minimum speed is 0 mph. (Note: When velocity
is −6 mph, speed is +6 mph.)
◆
2.4 Reading a Graph to Get Information About a Function 87
These last three examples are designed to help you read information from graphs and
to keep you aware that the story told by a graph cannot be determined without carefully
reading the labeling of the axes. Notice that we were able to get some information about
velocity from the position graph and some information about relative position from the
velocity graph. As we proceed, we will develop a deeper understanding of the connections
between position and velocity, and, more generally, between amount functions and their
corresponding rate functions.
EXERCISE 2.10 Oil is leaking from a point and spreading evenly in a thin, expanding disk. We can measure
the radius of the disk and want to know the rate of change of the area of the disk with respect
to the radius. The area is a function of the radius: A(r) = πr
2
square feet.
i. When the radius increases from 1 foot to 3 feet, by how much has the area changed?
What is the average rate of change of area with respect to radius?
ii. When the radius increases from 3 feet to 5 feet, by how much has the area changed?
What is the average rate of change of area with respect to radius?
Answers to Exercise 2.10 are provided at the end of Chapter 2.
Information About a Function Not Readily
Available From Its Graph
You can obtain a tremendous amount of information about a function from its graph.
The increasingly sophisticated technology of graphing calculators puts a mountain of
information in the palm of your hand and access to it at your fingertips. However, there
are instances in which it can be difficult to get useful information about a function from its
graph. In this subsection we will explore facets of functions not readily available from their
graphs and not readily accessible via a calculator.
◆
EXAMPLE 2.11 We define the function f as follows:
f(x)=
−1 for x a rational number,
1 for x an irrational number.
To make sense out of this function let’s clarify the terms “rational number” and “irrational
number.”
Definitions
A rational number is a number that can be expressed in the form p/q, where p
and q are integers.
12
This is equivalent to saying that a rational number can be
expressed as either a finite decimal expansion (e.g., 1/4 = 0.25) or an infinitely
repeating decimal (e.g., 1/6 = 0.1
¯
6).
13
An irrational number is a number that cannot be expressed as a ratio of integers.
The decimal expansion of an irrational number is infinite and nonrepeating. Some
examples of irrational numbers are π,
√
2, and
√
5.
14
The set of real numbers is the set of all rational and all irrational numbers. The
real numbers correspond to all the points on the number line.
88 CHAPTER 2 Characterizing Functions and Introducing Rates of Change
Because we cannot write a complete decimal expansion of any irrational number,
sometimes people are left with the incorrect idea that there are only “afew”of them. The
truth is that irrational numbers are more slippery than fish, and much more numerous. There
are infinitely many of them.
Let’s return to our function f . If we try to graph f , the best we can do is along the lines
of the figure below. The domain of this function is the set of all real numbers, and the range
is {−1, 1}. The horizontal lines at y = 1 and y =−1haveinfinitely many holes, but we
have no way of indicating this. In fact, since we cannot indicate the holes in the lines, this
graph doesn’t even look like the graph of a function; it doesn’t appear to pass the vertical
line test, although in actuality it does. Every real number is either rational, in which case
the function maps it to −1, or irrational, in which case the function maps it to +1. ◆
x
f
–1
1
Figure 2.22
A computer or graphing calculator can be an extremely useful tool, but, like any tool,
it has limitations. Try using your machine to do the following exercise.
EXERCISE 2.11 Let f(x)=x
2
−2
√
2x + 1. See if you can use your calculator to find the exact values of
the zeros and turning points of this function. (Some calculators can do this.)
The answers are:
zeros: x =
√
2 +1 and x =
√
2 −1
turning point: x =
√
2
The exact answers cannot be expressed as decimals.
12
The set of integers is { −3, −2, −1, 0, 1, 2, 3, }.
13
See Reference Section A, Algebra, for details.
14
It is not obvious that these numbers are irrational, but it can be proven. The standard proof that
√
2 is irrational is a proof by
contradiction. We begin by assuming
√
2 can be written in the form p/q and show that this assumption leads to a contradiction.
While π ≈ 3.14159 ,its decimal representation cannot be presented in its entirety; it is a sequence that never repeats yet goes
on forever. Refer to Section 2.5 where reals and rationals are discussed.
2.4 Reading a Graph to Get Information About a Function 89
Historically, irrational numbers were perplexing and disturbing, particularly to the
Greek Pythagoreans around 500 b.c. They have also had a history of being perplexing to
students in this course. Section 2.5 includes a discussion of irrational numbers and exact
answers as they pertain to our work.
EXERCISE 2.12 Let g(x) =
1
x
10
. Look at the graph of g to see what type of information is accessible from
its graph.
Graph this function on the standard viewing window of your calculator (with a domain
and range of [−10, 10] ). The graph almost looks like two vertical lines. Why? See if you
can adjust your viewing window to get a “good” picture of g. Investigate this function
numerically in order to get a feel for why, regardless of the viewing window used, it is
difficult to get a handle on g from its graph.
Here is another function that is difficult to get a handle on by looking at a single graph.
EXERCISE 2.13 Let h(x) = x
3
+ 999x
2
− 1000x. What are the zeros of this function? How many turning
points does it have?
Answers to Exercise 2.13 are provided at the end of Chapter 2.
Exercises 2.12 and 2.13 are designed to make you think about the window through
which you view a function on your calculator or computer. A bug and a bird have very
different views of the world. Flexibility and the ability to view the world through different
lenses and from different perspectives build problem-solving power.
PROBLEMS FOR SECTION 2.4
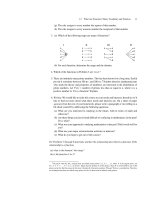
1. Use the graph of f on the following page to give approximate answers to the following
questions. Assume that the domain of f is −5 ≤ t ≤ 5.
(a) For what value of t between 0 and 5 is f(t)largest?
(b) How many solutions are there to the equation f(t)=0?Approximate these solu-
tions.
(c) How many solutions are there to the equation f(t)=3? Approximate these solu-
tions.
(d) Approximate f(0).
(e) For what values of t is |f(t)|<1?
(f) What are the values of k between −3 and 5 for which f(t)=k has exactly one
solution?
90 CHAPTER 2 Characterizing Functions and Introducing Rates of Change
–5
– 4 –3 –2 –112345
4
5
3
2
1
–1
–2
–3
t
f
2. Refer to the graph for Problem 1. Suppose that this graph gives information about a
mule’s travels along the Nile River in Egypt between the hours of 7:00 a.m. and 5:00
p.m. The mule travels along the Corniche, the road following the Nile. t = 0 corresponds
to noon; t =−5indicates five hours before noon, i.e., 7 a.m.
(a) Suppose f(t)gives the mule’s position (in miles) at time t, where t measures time
in hours. Karnak Temple is used as a benchmark for position; f = 0 when the
mule is at the Karnak Temple. Positions north of the Karnak are assigned positive
values and positions south of the Karnak are assigned negative values. Your job
is one of translation. Translate each of parts (a)–(e) in the previous problem to
the corresponding questions about the mule’s trip. Your answers should contain
neither “t”s nor “f(t)”s.
(b) Now suppose f(t)gives the mule’s velocity at time t (measured in miles per hour).
When the velocity is positive the mule is traveling north along the Nile, and when
the velocity is negative the mule is traveling south along the Nile. Translate each
of parts (a)–(e) in the previous problem to the corresponding questions about the
mule’s trip, again avoiding “t”s and “f(t)”s.
3. Suppose f is a continuous function with domain [−4, 7]; f is decreasing on [−4, 4]
and increasing on [4, 7].
(a) Can you determine where f takes on its lowest value? If this can be done, do it. If
not, can you narrow down the selection to a few possibilities ?
Can you determine the lowest value of f ?
(b) Can you determine where f takes on its highest value? If this can be done, do it.
If not, can you narrow down the selection to a few possibilities ?
Can you determine the highest value of f ?
4. Below are graphs giving information about trips. The trips are all taken along Interstate
Route 90, a road that runs east-west through Sturbridge, Massachusetts. The top four
graphs give position versus time while the bottom four give velocity versus time.
We use as our benchmark location Sturbridge itself. We will indicate that we are
10 miles east of Sturbridge by writing position = 10; we will indicate that we are 10
miles west of Sturbridge by writing position =−10. Positive velocity will indicate that
we are traveling from west to east; negative velocity will indicate that we are traveling