Calculus: An Integrated Approach to Functions and their Rates of Change, Preliminary Edition Part 12 ppt
Bạn đang xem bản rút gọn của tài liệu. Xem và tải ngay bản đầy đủ của tài liệu tại đây (243.92 KB, 10 trang )
2.4 Reading a Graph to Get Information About a Function 91
from east to west. We use noon as our benchmark time; noon corresponds to time t = 0.
Therefore time t =−2is10:00 a.m.
–2 –1 1 2
–2 –1 1 2
–3 –2 –1 1 2 3
–2 –1 12
t
tt
t
position position position position
TRIP I TRIP II TRIP III TRIP IV
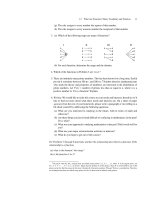
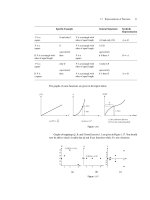
Answer parts (a), (b), and (c) for each of the trips corresponding to graphs I, II,
III, and IV.
(a) For what values of t is velocity positive? When is travel from west to east?
(b) For what values of t is velocity negative? When is travel from east to west?
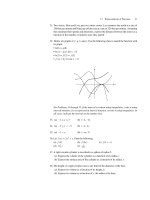
(c) To which trip do each of the following velocity graphs correspond? (Be sure your
answer to part (c) agrees with your answers to parts (a) and (b).)
1 2
t
–3 –2 –3 –2 –3 –2–2–1 –1123
t
1 2
t
1 2
t
velocity
velocity
velocity velocity
ABCD
When you have completed your work on this problem, compare your answers with
those of one of your classmates. If you disagree about an answer, each of you should
discuss your reasoning and see if you can come to a consensus on the answers.
5. Look back at the figures for Problem 4. What characteristic of the graph of position
versus time determines the sign of the velocity?
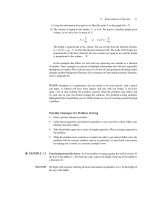
6. An ape with budding consciousness throws a bone straight up into the air from a height
of 2 feet.
15
From the seven graphs that follow pick out the one that could be the bone’s
(a) height versus time, (b) velocity versus time, (c) speed versus time.
15
Problem by Eric Brussel.
92 CHAPTER 2 Characterizing Functions and Introducing Rates of Change
t
t
t
t
t
t
t
(a) (b) (c) (d)
(e)
(f)
(g)
7. The velocity of an object is given in miles per hour by v(t) = 2t
5
− 6t
3
+ 2t
2
+ 1
over the time interval −2 ≤ t ≤ 2, where t is measured in hours. Use your graphing
calculator to answer the following questions.
(a) Sketch a graph of the velocity function over the time interval −2 ≤ t ≤ 2.
(b) Approximately when does the object change direction? Please give answers that
are off by no more than 0.05. (Either use the “zoom” feature of your calculator or
change the domain until you can answer this question. If your calculator has an
equation solver, use that as well and compare the answers you arrive at graphically
with the answers you get using the equation solver.)
(c) On the interval −2 ≤ t ≤ 2, approximately when is the object going the fastest?
How fast is it going at that time? (Give your answer accurate to within 0.1.)
(d) When on the interval 0 ≤ t ≤ 2 is the velocity most negative? (Give an answer
accurate to within 0.1.) When you zoom in on the graph here, what do you observe?
8. The displacement of an object is given by d(t) = 2t
5
− 6t
3
+ 2t
2
+ 1 miles over the
time interval −2 ≤ t ≤ 2 where t is measured in hours.
(a) Approximately when does the object change direction? Please give answers accu-
rate to within 0.1. When you zoom in on the graph here, what do you observe?
(b) Approximately when is the object’s velocity positive? Negative?
(c) Approximate the object’s velocity at time t = 0.
9. At time t = 0 three joggers start at the same place and jog on a straight road for 6 miles.
They all take 1 hour to complete the run. Jogger A starts out quickly and slows down
throughout the hour. Jogger B starts out slowly and picks up speed throughout the hour.
Jogger C runs at a constant rate throughout. On the same set of axes, graph distance
traveled versus time for each jogger. Clearly label which curve corresponds to which
jogger. Be sure your picture reflects all the information given in this problem.
2.4 Reading a Graph to Get Information About a Function 93
10. A baseball “diamond” is actually a square with sides 90 feet long. Several of the fastest
players in history have been said to circle the diamond in approximately 13 seconds.
(a) Sketch a plausible graph of speed as a function of time for such a dash around the
bases. Label the point at which the player touches each of the bases on your graph.
(Keep in mind that your player will probably need to slow down as he approaches
each base in order to make the necessary 90-degree turn.)
(b) Sketch a graph of his acceleration as a function of time. Again, label the point at
which he touches each base.
11. Before restrictions were placed on the distance that a backstroker could travel under-
water in a race, Harvard swimmer David Berkoff set an American record for the event
by employing the following strategy. In a 100-meter race in a 50-meter pool, Berkoff
would swim most of the first 50 meters underwater (where the drag effect of turbulence
was lower) then come up for air and swim on the water’s surface (at a slightly lower
speed) until the turn. He would then use a similar approach to the second 50 meters,
but could not stay underwater as long due to the cumulative oxygen deprivation caused
by the time underwater.
Assume that Berkoff is swimming a 100-meter race in Harvard’s Blodgett pool
(which runs 50 meters east to west). He starts on the east end, makes the 50-meter turn
at the west end, and finishes the race at the east end. Sketch a graph of his velocity, taking
east-to-west travel to have a positive velocity and west-to-east a negative velocity.
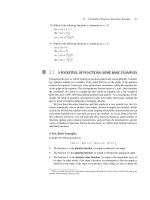
12. Below are graphs of position versus time corresponding to three trips. To be realistic
the graphs ought to be drawn with smooth curves; to make things simpler the situation
is approximated by a model using straight lines. The trips are all taken along the
Massachusetts Turnpike (Route 90) a road running east-west. Positions are given
relative to the town of Sturbridge. Positive values of position indicate that we are east
of Sturbridge, and negative values indicate positions west of Sturbridge. Thus, positive
velocity indicates that we are traveling from west to east; negative velocity indicates
that we are traveling from east to west. For each trip do the following:
12345
20
40
60
80
time
(in hours)
position
(in miles)
12345
20
40
60
80
time
(in hours)
position
(in miles)
12345
20
40
60
80
time
(in hours)
position
(in miles)
–20
I II III
(3, 40)
(4, –20)
94 CHAPTER 2 Characterizing Functions and Introducing Rates of Change
(a) Describe the trip in words. Include where the trip started and ended and how fast
(and in what direction) we traveled.
(b) Graph velocity as a function of time.
(c) Graph speed as a function of time. (Note: Speed is always nonnegative (zero or
positive); velocity may be zero, positive, or negative depending on direction.)
13. The annual Ironman triathlon held in Hawaii consists of a 2.4-mile swim followed by a
112-mile bicycle ride, and finally a 26.2-mile run. One entrant can swim approximately
3 miles per hour, bike approximately 18 miles per hour, and run about 9 miles per hour.
In addition, during each portion of the event, she slows down toward the end as she
gets tired. Sketch a possible graph of her distance as a function of time.
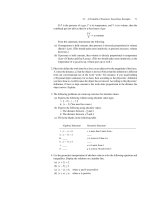
14. Below is a graph that gives information about a boat trip. The boat is traveling on a
narrow river. The trip begins at 7:00 a.m. at a boathouse. To be realistic the graph ought
to be drawn with smooth curves; to make things simpler the situation is approximated
by a model using straight lines.
0
50
100
150
200
250
012345678
A
B
C
D
(2, 50)
(4.5, 200)
(5.5, 225)
(7, 225)
(in hrs. past 7:00 am)
time
km. from
boathouse
(a) How fast is the boat going between 7:00 a.m. and 8:00 a.m.?
(b) At what time do you think that the boaters stopped to go fishing?
(c) What happens after they fish?
(d) How can you tell that the boat is going at a steady speed between 9:00 a.m. and
11:30 a.m.?
(e) How fast is the boat going between 10 a.m. and 11 a.m.?
(f) Using the information given above, sketch a graph to show how the speed of the
boat varies with time. Label your vertical axis speed (in kilometers per hour) and
your horizontal axis time (in hours past 7:00 a.m.). Consider the portion of the trip
beginning at 7:00 a.m. and ending at 2:00 p.m.
2.5 The Real Number System: An Excursion 95
2.5 THE REAL NUMBER SYSTEM: AN EXCURSION
The Development of the Real Number System
The concept of the real number system did not emerge fully formed from the ancient world;
it had a very long and tumultuous gestation period over tens of thousands of years, beginning
with early counting systems.
16
Tallying systems using notches in bones and sticks (or knots
in ropes) gave way to symbolic number systems, beginning with counting numbers: 1, 2,
3, Wehavetenfingers to count on; the ancient Egyptians,
17
along with people of many
other ancient civilizations, counted by tens—as we do today. The Babylonians, on the other
hand, had a well-developed place-value number system based on 60.
18
Well over a thousand
years elapsed between the use of the Babylonians’ symbolic number system and the first
evidence of the use of zero. Zero was first introduced not as a number in its own right but
simply as a positional place-holder.
19
It took about another thousand years for zero to gain
acceptance as a number.
The Chinese mathematician Liu Hui used negative numbers around 260 a.d.
20
,but
the famous Arab algebraists of the 800s such as al-Khowarizmi, whose work laid the
foundations of Western Europe’s understanding of algebra, avoided negative numbers.
While the Hindu mathematician Bhaskara put negative and positive roots of equations on
equal footing in the early 1100s, Europeans were skeptical.
21
As late as the mid-1500s,
when the Italian mathematicians Cardan and Tartaglia were battling over the solution of
cubic equations, Cardan, while farsighted in terms of recognizing negative roots, referred
to them as fictitious.
22
The use of fractions dates back to the ancient Egyptians, although their fractions were
always reciprocals of counting numbers (1/4, but not 3/4). Positive rational numbers gained
acceptance early, but irrational numbers were a cause of great consternation for well over
a millennium. The Greek Pythagorean school (around 530 b.c.) held the mystical belief
that the universe is governed by ratios of positive integers. Yet it was Pythagoras (or one
of his followers) who proved the Pythagorean Theorem, which tells us that the diagonal
of a square with sides 1 has length
√
2. Not only that, but the Pythagoreans proved that
√
2 is irrational: that is, they proved that
√
2 cannot be expressed in the form p/q where p
and q are integers. One possibly apocryphal story says that the Pythagoreans punished with
16
For some fascinating details and a very readable account, consult The History of Mathematics: An Introduction, by David
Burton, McGraw-Hill Companies, Inc. 1997.
17
Due in part to their methods of record keeping and their hot dry climate, the ancient Egyptians and Babylonians have
left modern historians more evidence of their mathematical development than have the people of other ancient civilizations. The
writings of the Greek historian Herodotus (around 450 b.c.) have helped establish records of life in this part of the world. The
climate of regions such as China and India has contributed to the disintegration of evidence. In addition, much destruction of
ancient work throughout the world has been deliberately carried out in the course of political and religious crusades.
18
Perhaps the base of 60 was selected because it has so many proper divisors (a position advocated by Theon of Alexandria,
father of Hypatia, the first famous woman mathematician), or because a year was thought to be 360 days. For more information
about the Babylonian system, see Burton’s book, Section 1.3, or read Howard Eves’ An Introduction to the History of Mathematics,
Saunders College Publishing, 1990.
19
The Mayans used zero in this manner in the first century a.d. (The Story of Mathematics, by Lloyd Motz and Jefferson
Weaver, Plenum Press, 1993, p. 33). Circa 150 a.d. the astronomer Ptolemy used the symbol “o” as a place-marker in his work.
The symbol came from the first letter of the Greek word for “nothing” (Burton, p. 23). The Hindus used a dot as a zero place-holder
in the fifth century a.d.; this dot later metamorphosized into a small circle. Arabic uses a dot for zero.
20
Burton, pp. 157-58.
21
Burton, p. 173.
22
Burton, p. 294.
96 CHAPTER 2 Characterizing Functions and Introducing Rates of Change
death one of their members who revealed to the outside world this dreadful contradiction
in beliefs.
23
While rational numbers (positive, zero, and negative) were fully accepted by the
late 1500s, irrational numbers were still viewed with some confusion. For example, in
1544 the algebraist Michael Stifel wrote “ . . . just as an infinite number is not a number,
so an irrational number is not a true number, but lies hidden in some sort of cloud of
infinity.”
24
It wasn’t until the 1870s that Dedekind, Cantor, and Weierstrass put irrational numbers
on solid ground. As previously mentioned, the set of real numbers is the set of all rational
and all irrational numbers; the real numbers correspond to all the points on the number
line.
What Does it Mean to Give An Exact Answer When Your
Answer Is Irrational?
Question: What exactly is the square root of 2? Is it 1.414213562?
In our math class this issue has been hotly debated. Tempers have flared; voices have
been raised; we barely escaped pistols at dawn. Let’s take a moment to think about this
calmly and rationally. In fact, irrationality is the root of the problem. The number
√
2, the
positive square root of 2, is the positive number such that, when you square it, you get 2.
Try computing
√
2 on your calculator. Your calculator spits out 1.414213562, or something
very similar. Is this really the square root of two? Our class annals show that Ted claims
yes, exactly, while Kevin claims no. Both are adamant. We’ll listen in.
Ted: “Yes, I now press
x
2
= and my calculator gives me 2. This shows that 1.414213562
is
√
2.”
Kevin: “That’s your calculator covering up for itself. x
2
and
√
x share the same key on
many calculators so the calculator covers up for its inaccuracies.”
Ted: “Will you listen to this? Give me a break. A calculator is a machine; it won’tcoverup
its mistakes.”
Kevin: “Try this: Press in 1.414213562 × 1.414213562. What do you get?”
Ted: “1.999999999. But it’s9’sforever, so it’s essentially two.”
Kevin: “No way. You see nine 9’s, not 9’s forever. Think about multiplying out by hand;
for sure you’ll geta4asyour last decimal place on the right.”
Ted: “All right, all right—so how do I get
√
2 exactly?”
Kevin: “You already have it exactly.”
Ted glares. The tension builds. What is going on here? Ted is desperately seeking a finite
decimal expansion that is exactly
√
2 and Kevin is trying, without success, to convince
him that there simply isn’t one. The problem is that Ted is locked into thinking that any
number can be written as a finite decimal or an infinitely repeating decimal. In fact, any
rational number can be expressed this way. The irrational numbers are numbers that cannot
23
E. Maor, To Infinity and Beyond: A Cultural History of the Infinite, Boston, Birkhauser, 1987. p. 46.
24
Burton, p. 170.
2.5 The Real Number System: An Excursion 97
be expressed in this way. Their decimal expansions are infinite and nonrepeating. So we
can never write one down exactly as a decimal, and our calculators can never tell us the
decimal expansion exactly. Ted believes, like the ancient Pythagoreans, that the world ought
to be ruled completely by rational numbers. Historically, this dilemma caused even greater
consternation for the Pythagoreans than it is causing for Ted.
Question: Between any two rational numbers, how many rational numbers are there?
Answer: Infinitely many.
Question: Between any two rational numbers, how many irrational numbers are there?
Answer: Infinitely many.
Question: So between 1.414213562 and 1.414213563 how many irrational numbers are
there?
Answer: Infinitely many. You can string infinitely many different infinite sequences of
numbers behind that final 2 of the former without reaching beyond the final 3 of the latter.
Question: How many of these does your calculator indicate to you?
Answer: None. However, some calculators do store away more digits than they show you.
For example, the TI-85 stores three digits more of the decimal representation of
√
2 than it
displays. Look in your calculator’s instruction book to find out what your calculator really
“knows.”
Question: Can your calculator ever “give” you an irrational number?
Answer: Not as a decimal. It can approximate an irrational number by a rational one.
Question: Can straightforward problems lead to irrational answers?
Answer: Yes. Think about the diagonal of a square with sides of length 1 (or with sides of
any rational length, for that matter). Or consider the ratio of the circumference of a circle
to the diameter:
circumference
diameter
=
2πr
2r
= π .
This is in fact taken to be the definition of π .
25
π is irrational, although it wasn’t until
the 1700s that it was proven to be so, about 2000 years after Pythagoras had proven the
irrationality of
√
2.
26
Are you still feeling a little queasy about irrational numbers, still feeling in the pit of
your stomach that you could really sweep them under the table and no one would notice?
While it is true that in any practical application a “good enough” approximation is all we
25
Cuneiform tablets from the Babylonians indicate that they took π to be 3. The ancient Egyptians essentially took it to be
3.16. Archimedes showed that 3.14103 <π <3.14271. (Eli Maor, e: The Story of a Number, p. 43.) In the United States a state
legislature actually tried to “legislate” the value of π , forcing it to be rational. They felt they were fighting for the underdog, the
poor engineers, rocket scientists, doctors, and students whose lives were being unnecessarily complicated by an irrational π .
26
Johann Lambert proved π is irrational in 1768. (Eli Maor, e: The Story of a Number, p. 188.)
98 CHAPTER 2 Characterizing Functions and Introducing Rates of Change
need, let’s think for a moment about the problems that would arise if we were to toss out
irrational numbers. Consider this: Suppose we were to graph only rational points—meaning
points with both the x- and y-coordinates rational numbers. While we could still make out
the shape of the unit circle, it would have infinitely many holes in it. For example, the
line y = x would pass right through without intersecting it because the points where this
line intersects the circle are
1
√
2
,
1
√
2
and
−
1
√
2
, −
1
√
2
, both of which have irrational
coordinates.
The graph of x
4
+ y
4
= 1 looks like a deformed circle,
27
but graphing only rational
points gives us just four points, as shown in Figure 2.23.
()
()
y
x
unit circle
1
–
,
,
1
1
2
√
1
2√
–
1
2
√
1
2√
x
2
+ y
2
= 1
x
y
1
1
–1
–1
x
4
+ y
4
=1
x
y
1
1
–1
–1
x
4
+ y
4
= 1,
rational points only
Figure 2.23
Similarly, the graph of x
6
+ y
6
= 1 looks like a radically deflated circle, but graphing
rational points only gives us four single points.
The graph of x
n
+ y
n
= 1, for any n ≥ 3 would look like the figure on the left in
Figure 2.24 for n even and the figure on the right for n odd.
28
27
To plot these using your calculator you’ll probably need to construct pairs of functions: y
1
=
√
1 − x
2
and y
2
=−
√
1 − x
2
,
i.e., y
1
=
1 − x
2
1/2
and y
2
=−
1−x
2
1/2
for the unit circle, y
1
=
1 − x
4
1/4
and y
2
=−
1−x
4
1/4
for x
4
+ y
4
= 1.
28
The fact that x
n
+ y
n
= 1 has no rational solutions other than 0’s and 1’s is a consequence of Fermat’s Last Theorem, which
states that x
n
+ y
n
= z
n
has no nontrivial integer solutions for n ≥3. This longstanding conjecture had challenged mathematicians
for hundreds of years. It was proven in 1994 by Andrew Wiles with some last-minute assistance from Richard Taylor. Those of you
who frequent the theater might be interested to know that Fermat’s Last Theorem is discussed in Tom Stoppard’s play Arcadia,
and those of you who watch Star Trek: The Next Generation know that Captain Picard is working on this still “unsolved” problem
many centuries from now.
2.5 The Real Number System: An Excursion 99
x
y
x
y
x
y
x
y
1
1
1
1
1
1
–1
–11
1
–1
–1
(a)
(b)
x
nn
+y=1, n even
x
nn
+y=1, n even,
rational points only
x
nn
+y=1, n odd,
rational points only
x
nn
+y=1, n odd
Figure 2.24
An even more basic though less dramatic example is obtained by simply thinking of
the number line. Between any two rationals there are infinitely many irrationals; therefore,
if we were to ignore irrationals the line would be full of holes—to put it mildly!
Why does the idea of having infinitely many holes in the graph of a function cause us
such great consternation? Soon we will move from looking at an average rate of change
of a quantity to inquiring about an instantaneous rate of change; for example, instead of
asking about the average velocity of a biker over a five-minute period we will be interested
in her velocity at a certain instant. In order to find the instantaneous rate of change of f it
is necessary that f be a continuous function, that its graph have no holes or jumps.
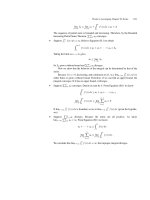
Answers to Selected Exercises
Answers to Exercise 2.10
i. Change in area: A(3) − A(1) = 9π − π = 8π (This is a little more than 25 square feet.)
Rate of change :
change in area
change in radius
=
A
r
=
A(3) − A(1)
3 − 1
=
8π
2
= 4π
ii. Change in area: A(5) − A(3) = 25π − 9π = 16π
Rate of change :
change in area
change in radius
=
A
r
=
A(5) − A(3)
5 − 3
=
16π
2
= 8π
100 CHAPTER 2 Characterizing Functions and Introducing Rates of Change
Notice that as r increases the rate of change of area with respect to the radius also
increases; increasing the radius from 3 to 5 adds more area than does increasing the radius
from1to3.
Answers to Exercise 2.13
The zeros of this function are simplest to identify algebraically.
x
3
+ 999x
2
− 1000x = x(x
2
+ 999x − 1000) = x(x + 1000)(x − 1)
Therefore, the zeros are at x = 0, x =−1000, and x = 1. The function has two turning
points. How we know there are not more than two turning points will be discussed when
we take up the topic of polynomials.
PROBLEMS FOR SECTION 2.5
For Problems 1 through 7, give exact answers, not numerical approximations.
1. Find the radius of the circle whose area is 2 square inches.
2. Find the diameter of the circle whose circumference is 7 inches.
3. How long is the diagonal of a square whose sides are 5 inches?
4. A rectangle is 3 meters long and 2 meters high. How long is the diagonal?
5. Solve: x
2
+ 1 = 6.
6. Solve: (πx)
2
= πx. (There are two answers.)
7. Solve: π
2
x
3
= πx
2
.
8. (a) How many rational numbers are in the interval [2, 2.001]?
(b) How many irrational numbers are in the interval [2, 2.001]?
9. The number π lies between 3.141592653489 and 3.141592653490. How many other
irrational numbers lie between these two?
10. How many points on the graph of f(x)=x
2
have at least one irrational coordinate?
11. (a) Is it possible for the graph of a function f with domain [0, 2] to have at most
finitely many points with an irrational coordinate? If so, give such a function.
(b) Is it possible for the graph of a function g with domain {0, 1, 2, }to have no
points with an irrational coordinate? If so, give an example of such a function.