Calculus: An Integrated Approach to Functions and their Rates of Change, Preliminary Edition Part 13 pdf
Bạn đang xem bản rút gọn của tài liệu. Xem và tải ngay bản đầy đủ của tài liệu tại đây (260.49 KB, 10 trang )
3
CHAPTER
Functions Working Together
In this chapter we’ll look at ways of combining functions in order to construct new functions.
3.1 COMBINING OUTPUTS: ADDITION, SUBTRACTION,
MULTIPLICATION, AND DIVISION OF FUNCTIONS
The sum, difference, product, and quotient of functions are the new functions defined
respectively by the addition, subtraction, multiplication, and division of the outputs or values
of the original functions.
Addition and Subtraction of Functions
◆
EXAMPLE 3.1 Suppose a company produces widgets.
1
The revenue (money) the company takes in by
selling widgets is a function of x, where x is the number of widgets produced. We call
this function R(x). We call C(x) the cost of producing x widgets. Producing and selling x
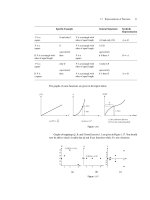
widgets results in a profit, P(x),where profit is revenue minus cost; P(x)= R(x) − C(x).
The height of the graph of the profit function is obtained by subtracting the height of the
cost function from the height of the revenue function. Where P(x)is negative the company
loses money. The x-intercept of the P(x)graph corresponds to the break-even point where
revenue exactly equals costs, so there is zero profit. (See Figure 3.1 on the following page.)
1
A widget is an imaginary generic product frequently used by economists when discussing hypothetical companies.
101
102 CHAPTER 3 Functions Working Together
x
C(x)
100
R(x)
–F
100
x
dollars
P(x)=R(x)-C(x)
dollars
F
Figure 3.1
◆
More generally, if h is the sum of functions f and g, h(x) = f(x)+g(x), then the
output of h corresponding to an input of x
1
is the sum of f(x
1
)and g(x
1
). In terms of the
graphs, the height of h at x
1
is the sum of the heights of the graphs of f and g at x
1
.An
analogous statement can be made for subtraction. The domain of h is the set of all x common
to the domains of both f and g.
◆
EXAMPLE 3.2 Let f(x)=x and g(x) =
1
x
. We are familiar with the graphs of f and g. We can obtain a
rough sketch of f(x)+g(x) = x +
1
x
from the graphs of f and g by adding together the
values of the functions as shown in the figure below.
x
g
x
f+g
x
f
+ =>
sum the
heights
Figure 3.2
◆
EXERCISE 3.1 The following questions refer to Example 3.2, where f(x)+g(x) = x +
1
x
.
(a) What is the domain of f + g?
(b) For |x| close to zero, which term of the sum dominates (controls the behavior of) the
sum?
(c) For |x| large, which term of the sum is dominant?
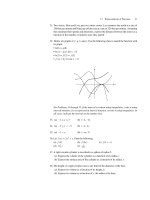
EXERCISE 3.2 When a company produces widgets they have fixed costs (costs they incur regardless
of whether or not they produce a single widget, such as renting some space for widget
production) and they have variable costs (costs that vary with the number of widgets they
produce, such as the cost of materials and labor). Figure 3.3 shows graphs of the fixed cost
function, FC,and the variable cost function, VC,for widgets.
Total cost = fixed costs + variable costs
Graph the total cost function, TC,where TC=FC +VC.
3.1 Combining Outputs: Addition, Subtraction, Multiplication, and Division of Functions 103
x
F
dollars
FC
VC
Figure 3.3
EXERCISE 3.3 A patient is receiving medicine intravenously. Below are two graphs. One is the graph of
R
I
(t), the rate at which the medication enters the bloodstream. The other is a graph of
R
O
(t), the rate at which the medication is metabolized and leaves the bloodstream.
2
(a) Let R(t) be the rate of change of medication in the bloodstream. Express R(t) in terms
of R
I
(t) and R
O
(t).
(b) Graph R(t).
(c) At approximately what value of t is R(t) minimum?
1 2 3 4
5
1 2 3 4
5
t
t
R
I
R
O
0
0
Figure 3.4
Multiplication and Division of Functions
Let’s suppose a consultant wants to construct a function to model the amount of money he
spends on gasoline for his automobile. The price of gasoline varies with time. Let’s denote
it by p(t), where p(t) is measured in dollars per gallon. The amount of gasoline he uses for
his commute also varies with time; we’ll denote it by g(t). Then the amount of money he
spends is given by
p(t)
$
gal
· g(t) gal.
This is the product of the functions p and g.
A demographer is interested in the changing economic profile of a certain town. If the
population of the town at time t is given by P(t)and the total aggregate income of the town
at time t is given by I(t),then the per capita income is given by
2
R
I
for “rate in”; R
O
for “rate out.”
104 CHAPTER 3 Functions Working Together
I(t)
P(t)
.
This is the quotient of the functions I and P .
If h(x) = f(x)· g(x), then the output of h is the product of the outputs of f and g.If
j(x)=
f(x)
g(x)
, then the output of j is the quotient of the outputs of f and g. The product is
defined for any x in the domains of both f and g; the quotient is defined for any x in the
domains of both f and g provided g(x) is not equal to 0.
EXERCISE 3.4 h(x) = f(x)· g(x)
(a) If h(a) > 0, what can be said about the signs of f and g at x = a?
(b) If h(a) < 0, what can be said about the signs of f and g at x = a?
(c) How are the zeros of h related to the zeros of f and g?
EXERCISE 3.5 j(x)=
f(x)
g(x)
(a) If j(a)>0, what can be said about the signs of f and g at x = a?
(b) How are the zeros of j related to the zeros of f and g?
◆
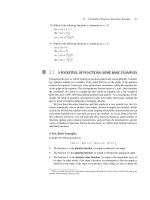
EXAMPLE 3.3 The number of widgets people will buy depends on the price of a widget. Economists call
the number of widgets people will buy the demand for widgets. Thus, demand for a widget
is a function of price. Let’s suppose that the number of widgets demanded is given by D(p),
where p is the price of a widget. If a company has a monopoly on widgets, then it can fix
the price of a widget to be whatever it likes. The revenue, R, that this company takes in is
given by (price of a widget) · (number of widgets sold), so
R(p) = p · D(p).
Below is the graph of the demand function, where quantity demanded is a function of price.
3
price
quantity demanded
p
1
Figure 3.5
(a) What prices will yield no revenue? Why?
(b) Sketch a rough graph of R(p).
3
Economists would reverse the axes.
3.1 Combining Outputs: Addition, Subtraction, Multiplication, and Division of Functions 105
SOLUTION (a) Prices of $0 and $p
1
will yield no revenue. (In fact, any price above $p
1
will yield no
revenue.) If widgets are free there is no revenue, and likewise if the price of a widget
is $p
1
or more then nobody will buy widgets, so the revenue is also zero.
(b) The graph of R(p) is given below.
R(p)
p
R(p)
p
1
Figure 3.6 ◆
EXERCISE 3.6 Let C(q) be the total cost of making q widgets. Assume that C(0) is positive. How would
you compute the average total cost of making q widgets? When graphing the average total
cost function, what units might be on the coordinate axes? Why is it that average total cost
curves never intersect either of the two coordinate axes?
EXERCISE 3.7 Let f(x)=x and g(x) = 1/x. Sketch the graph of h(x) = f(x)·g(x). Where is h(x)
undefined? How can you indicate this on your graph? How does your graphing calculator
deal with the point at which h is undefined?
The answer to Exercise 3.7 is supplied at the end of the chapter.
PROBLEMS FOR SECTION 3.1
1. Let f(x)=x
2
and g(x) = 1/x. Use your knowledge of the graphs of f and g to sketch
the graph of h(x) = f(x)·g(x). Where is h(x) undefined? How can you indicate this
on your graph? How does your graphing calculator deal with the point at which h is
undefined?
2. Let f(x)=|x|and g(x) = 1/x. Use your knowledge of the graphs of f and g to sketch
the graph of h(x) = f(x)·g(x). Where is h(x) undefined? Note: You must deal with
the cases x>0and x<0separately. This is standard protocol for handling absolute
values.
3. Let f(x)=|x|and g(x) = x. Use your knowledge of the graphs of f and g to sketch
the graph of h(x) = f(x)+g(x).
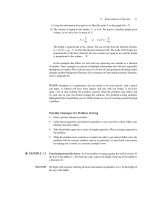
4. Let B(t) denote the birth rate of Siamese fighting fish as a function of time and D(t)
denote the death rate. Then the total rate of change of the population of Siamese
fighting fish, R(t), is given by subtracting the death rate from the birth rate; thus,
106 CHAPTER 3 Functions Working Together
R(t) = B(t) − D(t). Graphs of B(t) and D(t) are shown below. Sketch a graph of
R(t).
t (months)
D(t)
fish /month
B(t)
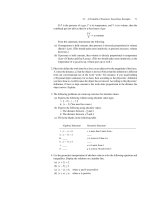
5. Let F(t) be the number of trout in a given lake as a function of time and suppose
that K(t) is the fraction of these fish in the lake at time t that are “keepers” if caught
(“keepers” meaning that they are above a certain minimum length—smaller ones are
thrown back). Then the total number of keepers in the lake at any time is given by the
product of F(t)and K(t). Below are graphs of F(t)and K(t). Sketch a graph of N(t),
the total number of keepers as a function of time.
2000
3000
t
F(t)
t
K(t)
40%
6. A town draws its water from the town reservoir. The town’s water needs vary throughout
the day; the rate of water leaving the reservoir (in gallons per hour) is shown on the
graph below. Also recorded is the rate at which water is flowing into the reservoir from
a nearby stream.
rate of water
running out
rate of water
running in
time
7:00 8:00 9:00 10:00 11:00 noon 1:00 2:00 3:00 4:00 5:00 6:00 7:00
500
1000
1500
2000
2500
3000
gallons/hr
(a) At 6:00 a.m., at what rate is the water being used by the town? At what rate is
water flowing in from the stream? Is the water level in the reservoir increasing or
decreasing at 6:00 a.m.? At what rate?
3.1 Combining Outputs: Addition, Subtraction, Multiplication, and Division of Functions 107
(b) At approximately what time(s) is the rate of flow of water into the reservoir equal
to the rate of flow out of the reservoir?
(c) During what hours (between 6:00 a.m. and 7:00 p.m.) is the water level in the
reservoir increasing?
(d) At approximately what time is the water level in the reservoir increasing most
rapidly? How can you get this information from the graph?
7. Let’s return to the city reservoir in Problem 6. We’ll denote the rate at which water is
flowing into the reservoir by R
I
(t) and the rate that it is flowing out by R
O
(t). Then
the total rate of change of water in the reservoir is given by
Total rate of change = Rate in − Rate out
or
R(t) = R
I
(t) − R
O
(t).
Graph R(t).
8. Let f(x)=x(x + 1), g(x) = x
3
+ 2x
2
+ x.
(a) Simplify the following.
i. f(x)+g(x) ii.
f(x)
g(x)
iii.
g(x)
f(x)
iv.
[f(x)]
2
g(x)
(b) Solve xf (x) = g(x).
9. The Cambridge Widget Company is producing widgets. The fixed costs for the com-
pany (costs for rent, equipment, etc.) are $20,000. This means that before any widgets
are produced, the company must spend $20,000. Suppose that each widget produced
costs the company an additional $10. Let x equal the number of widgets the company
produced.
(a) Write a total cost function, C(x),that gives the cost of producing x widgets. (Check
that your function works, e.g., check that C(1) = 20, 010 and C(2) = 20, 020.)
Graph C(x).
(b) At what rate is the total cost increasing with the production of each widget? In
other words, find C/x.
(c) Suppose the company sells widgets for $50 each. Write a revenue function, R(x),
that tells us the revenue received from selling x widgets. Graph R(x).
(d) Profit = total revenue − total cost, so the profit function, P(x), which tells us
the profit the company gets by producing and selling x widgets, can be found by
computing R(x) − C(x). Write the profit function and graph it.
(e) Find P(400) and P(700); interpret your answers. Find P(401) and P(402).By
how much does the profit increase for each additional widget sold? Is P /x
constant for all values of x?
(f) How many widgets must the company sell in order to break even? (Breaking even
means that the profit is 0; the total cost is equal to the total revenue.)
(g) Suppose the Cambridge Widget Company has the equipment to produce at maxi-
mum 1200 widgets. Then the domain of the profit function is all integers x where
108 CHAPTER 3 Functions Working Together
0 ≤ x ≤ 1200. What is the range? How many widgets should be produced and sold
in order to maximize the company’s profits?
10. A photocopying shop has a fixed cost of operation of $4000 per month. In addition, it
costs them $0.01 per page they copy. They charge customers $0.07 per page.
(a) Write a formula for R(x), the shop’s monthly revenue from making x copies.
(b) Write a formula for C(x), the shop’s monthly costs from making x copies.
(c) Write a formula for P(x), the shop’s monthly profit (or loss if negative) from
making x copies. Profit is computed by subtracting total costs from the total
revenue.
(d) How many copies must they make per month in order to break even? Breaking
even means that the profit is zero; the total costs and total revenue are equal.
(e) Sketch C(x), R(x), and P(x) on the same set of axes and label the break-even
point.
(f) Find a formula for A(x), the shop’s average cost per copy.
(g) Make a table of A(x) for x = 0, 1, 10, 100, 1000, 10000.
(h) Sketch a graph of A(x).
3.2 COMPOSITION OF FUNCTIONS
Whereas the addition, subtraction, multiplication, and division of functions is simply the
addition, subtraction, multiplication, and division of the outputs of these functions, another
way of having functions work together is to have the output of one function used as the
input of the next function.
Suppose you are blowing up balloons for a celebration. The surface area S of the balloon
is a function of a, the amount of air inside of the balloon. Let’s say S = f(a).The amount
of air inside the balloon is a function of time. Let’s say a = g(t). Then
S = f(a)=f(g(t)).
Wecan say that S is equal to the composition of f and g.
Composition of functions is analogous to setting up functions as workers (or machines)
on an assembly line. If the output of g is handed over to f as input, we write f(g(t)),
where the notation indicates that f acts on the output of g. This can be represented
diagrammatically by
t
g
−→ g(t)
f
−→ f(g(t)).
The expression f(g(t))says “apply f to g(t)”; that is, use g(t) as the input of f . This is
called the composition of f and g} and is also sometimes written as f ◦ g. The expression
(f ◦ g)(t) means f(g(t)):Start with t ; apply machine g and then apply machine f to the
result.
3.2 Composition of Functions 109
tg(t)
f
f(g(t))=(f◦g)(t)
g
Caution: Do not let the notation mislead you into thinking that f should be applied before
g; (f ◦ g)(t) means apply g, then apply f to the result. The domain of f ◦ g is the set of
all t in the domain of g such that g(t) is in the domain of f .
Notice that the order in which machines are put on an assembly line is generally critical
to the outcome of the process. Suppose machine W pours a liter of water in a specified place
and machine L places a lid on a bottle. We send an open empty bottle down the assembly
line. Putting machine W first on the assembly line, followed by machine L, results in the
production of bottled water, while reversing the order results in the production of sealed,
washed, empty bottles.
Open empty bottle
W
−→
L
−→ bottled water corresponding to L(W (bottle))
Open empty bottle
L
−→
W
−→ w ashed bottle corresponding to W (L(bottle))
From this example we see that generally f(g(t))=g(f (t)).
When unraveling the composition of functions, always start from the innermost paren-
theses and work your way outward. This will assure the correct order on the assembly line
of functions.
◆
EXAMPLE 3.4 Let f(x)=x
2
, g(x) = 2x + 3. Find the following.
i. (f ◦ g)(x), i.e., f(g(x)) ii. (g ◦ f )(x), i.e., g(f (x))
SOLUTION i. (f ◦ g)(x) = f(g(x)).Toevaluate, replace g(x) by its output value, which is 2x + 3.
Next, treat (2x + 3) as the input of the function f ; f squares the input.
f(g(x))=f(2x+3)=(2x +3)
2
=4x
2
+12x + 9
ii. (g ◦ f )(x) = g(f (x)) = g(x
2
) = 2x
2
+ 3
◆
Notice that in Example 3.4 for almost all values of x, f(g(x))=g(f (x)).
4
The order
in which the functions are composed determines the result. In this case, doubling the input,
adding 3 to it, and then squaring the sum is different from squaring the input, doubling the
result, and then adding 3. When we write mathematics, we indicate the order of operations
in an expression through a combination of parentheses and conventions for orders of
operations.
5
◆
EXAMPLE 3.5 Let f(x)=x
2
,g(x) = 2x + 3, as in Example 3.4. Find
i. f (g(g(x))) ii. g
1
f(x)
4
There are only two values of x for which 2x
2
+ 3 is the same as 4x
2
+ 12x + 9. See if you can find them. If you need a
refresher, refer to Appendix A: Algebra, under Solving Quadratic Equations.
5
For a review of conventions for order of operations, please refer to Appendix A: Algebra.
110 CHAPTER 3 Functions Working Together
SOLUTION i.
f (g(g(x))) = f(g(2x+3))
= f(2(2x+3)+3)
=f(4x+6+3)
=f(4x+9)
=(4x+9)
2
=16x
2
+ 72x + 81
ii. g
1
f(x)
= g
1
x
2
=
2
x
2
+ 3
◆
◆
EXAMPLE 3.6 Let g(x) = 2x + 3, h(x) =
x−3
2
. Find
i. h(g(x)) ii. g(h(x))
SOLUTION i. h(g(x)) = h(2x + 3) =
(2x+3)−3
2
=
2x
2
= x
ii. g(h(x)) = g
x−3
2
= 2
x−3
2
+ 3 = x − 3 + 3 = x
◆
Observation
In this example diagrammatically we have x
g
−→ g(x)
h
−→ x and x
h
−→ h(x)
g
−→ x . Thus,
whether g is followed by h or h is followed by g, the result is not only the same, but it is the
original input. The functions h and g undo one another. If h(g(x)) = x and g(h(x)) = x,
then h and g are called inverse functions.(Wefirst introduced the topic of inverse functions
in Section 1.3 and will discuss it in detail in Chapter 12.)
Notice that in order to perform the composition of functions you need to be comfortable
evaluating a function even when the input is rather messy. You must distinguish in your mind
the difference between the functional rule itself and the input of the function. The following
exercise may be helpful.
EXERCISE 3.8 Let f be the function given by f(x)=
x
x−1
+ 2x. Find the following.
i. f(3) ii. f(y +1) iii. f(1/x) iv. f(x +h) v.
f(2h)
h
To do this exercise, it is important to keep in mind that whatever is enclosed in the
parentheses of f is the input of f . What does the function do with its input? f divides the
input by a number that is one less than the input and then adds twice the input to that to the
quotient.
For a silly but fail-proof way to find f (mess), run through the following questions:
What is f(2)?f(3)?f(π)?f(mess)?
This serves to get the functional rule firmly established in your mind.
Solutions to Exercise 3.8 are given at the end of the chapter.