Calculus: An Integrated Approach to Functions and their Rates of Change, Preliminary Edition Part 44 pdf
Bạn đang xem bản rút gọn của tài liệu. Xem và tải ngay bản đầy đủ của tài liệu tại đây (235.74 KB, 10 trang )
11.4 Rational Functions and Their Graphs 411
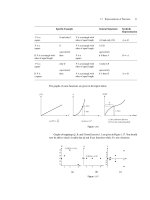
The graph will look like one of the following.
Figure 11.23
2. Find x-intercepts. Where is the numerator of the simplified expression zero? (For a
fraction to be zero, its numerator must be zero.)
3. Positive/negative. Figure out the sign of f(x). The sign of any function can change
only across a zero or a point of discontinuity. Draw a “sign of f(x)”number line. The
sign can change only on either side of an x-intercept or vertical asymptote.
Observe the following. If the factor (x − a) occurs in either numerator of f with
odd multiplicity, then f changes sign around x = a. If it occurs with even multiplicity,
then f does not change sign around x = a. This is consistent with the behavior we
observed in polynomials.
4. Find the y-intercept. Set x = 0. (This merely gives a point of reference.)
5. Look for horizontal asymptotes. A horizontal asymptote includes the behavior of
f(x) as x →±∞.Ahorizontal asymptote gives the behavior of f(x) only for x of
very large magnitude; therefore, it can be crossed. Find lim
x→∞
f(x). (For rational
functions if lim
x→∞
f(x)is finite it will be equal to lim
x→−∞
f(x).)
degree top > degree bottom ⇒ no horizontal asymptote |f(x)|→∞
degree top < degree bottom ⇒ horizontal asymptote at y = 0 (the x-axis)
degree top = degree bottom ⇒ horizontal asymptote at y = fraction formed by leading
coefficients
6. Consider symmetry. If the asymptotes and intercepts don’t have the required symme-
try, then the function is neither even nor odd. If they do, then consider whether the
function has even symmetry, odd symmetry, or neither. You can look at the numerator
and denominator separately first.
even =
even
even
or
odd
odd
; odd =
even
odd
or
odd
even
7. If you are interested in local extrema, then compute the derivative.
The graphs of some rational functions can be built up from the sum or difference of
other familiar rational functions. For example, h(x) =
x
2
+1
x
= x +
1
x
. Refer to Figure 11.24
to see how the graph of
x
2
+1
x
can be built by summing the y-values of the graphs of x and
1/x.
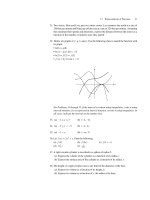
412 CHAPTER 11 A Portrait of Polynomials and Rational Functions
y
y
x
x
y
x
h(x) = = x +
x
2
+ 1
1
x
x
1
x
f(x) = x
h(x) = f (x) + g(x)
g(x) =
vertical asymptote at x = 0 vertical asymptote at x = 0
f(x)
h(x)
g(x)
Figure 11.24
EXERCISE 11.12 Differentiate h(x) in the example above to find the coordinates of the local extrema.
Answer
local minimum at x = 1, local maximum at x =−1.
Below are worked examples; rational functions are presented and graphed.
◆
EXAMPLE 11.14
(a) f(x)=
4x(x+2)
x−3
=
4x
2
+8x
x−3
x-intercepts: x = 0 and x =−2 y-intercept: y = 0
vertical asymptotes: x = 3 symmetry? None.
–230
– +–+sign of y
horizontal asymptote?
f(x)=
4x
2
+8x
x−3
,soasx→±∞,this looks like
4x
2
x
= 4x. No horizontal asymptote.
y
x
x = 3
–2 –1123
f(x)
Figure 11.25
(b) f(x)=
x
2
2x
2
−8
=
x
2
2(x
2
−4)
=
x
2
2(x+2)(x−2)
x-intercepts: x = 0 y-intercept: y = 0
vertical asymptotes: x = 2, x =−2 symmetry? Even, because f(−x) = f(x).
Alternatively,
even
even
= even.
11.4 Rational Functions and Their Graphs 413
–220
++––
sign of y
horizontal asymptote?
y =
x
2
2x
2
−8
,soasx→±∞,this looks like y =
x
2
2x
2
=
1
2
. Horizontal asymptote at y =
1
2
.
y
x
x = 2
y =
1
/2
x = –2
f(x)
Figure 11.26
(c) f(x)=
(x+3)(x+1)
2
x
3
−3x
2
+2x
=
(x+3)(x+1)
2
x(x−2)(x−1)
x-intercepts: x =−3, x =−1 y-intercept: None. (y-axis is asymptote)
vertical asymptotes: x = 0, x = 2, x = 1 symmetry? None.
–1–3210
(–)(–) (+)(–)(+)(+)
sign of y
horizontal asymptote?
f(x)=
(x−3)(x+1)
2
x
3
−3x
2
+2x
,soasx→±∞,this looks like
x
3
x
3
= 1. Horizontal asymptote at
y = 1.
x
y
12 3–3–2–1
x =1
y =1
x =2
x = 0
f(x)
Figure 11.27
Question. Does the graph cross the line y = 1?
(x+3)(x+1)
2
x
3
−3x
2
+2x
= 1 or, multiplying out,
x
3
+5x
2
+7x+3
x
3
−3x
2
+2x
= 1.
x
3
+ 5x
2
+ 7x + 3 = x
3
− 3x
2
+ 2x,so5x
2
+7x+3=−3x
2
+2x,
or 8x
2
+ 5x + 3 = 0.
The discriminant is negative, b
2
− 4ac = 25 −(4)(3)(8)<0,so there are no solutions.
The graph does not cross the line y = 1.
414 CHAPTER 11 A Portrait of Polynomials and Rational Functions
(d) f(x)=
x−2
(x
2
+1)(x−2)
.
f(x)=
1
x
2
+1
for x = 2,
undefined for x = 2
There is a pinhole at x = 2. There is just a pinhole because lim
x→2
+
1
x
2
+1
= lim
x→2
−
1
x
2
+1
=
1
5
. Both the left- and right-hand limits are equal and finite.
x-intercepts: None y-intercept: 1
vertical asymptotes: None symmetry? If the point of discontinuity at x = 2
were removed, then f would be even.
(+)
sign of y
horizontal asymptote? As x →±∞, f(x)=
1
x
2
+1
→ 0. Horizontal asymptote at
y = 0.
1
x
2
+1
is biggest when x
2
+ 1 is smallest; the maximum value of
1
x
2
+1
is 1 and is attained
at x = 0.
y
x
f(x)
Figure 11.28
REMARK If you merely follow a recipe for doing mathematics problems you will not always
do them in the most efficient way possible. Example (d) is most easily done as follows:
f(x)=
x−2
(x
2
+1)(x−2)
=
1
x
2
+1
for x = 2, and is undefined at x = 2. We can graph
1
x
2
+1
by
beginning with the graph of g(x) = x
2
+ 1 and then graphing its reciprocal,
1
g(x)
.
y
x
y
x
1
1
y =
y = x
2
+1
x
2
+ 1
1
Figure 11.29
We insert a pinhole at x = 2 because f(x)is undefined at x = 2.
11.4 Rational Functions and Their Graphs 415
y
x
2
Figure 11.30
◆
Fitting a Function to a Graph
We will use the graph below as reference.
y
x
x = b
ad
x = c
Figure 11.31
1. Find all x-intercepts x = a, x = d, and construct the factors (x − a), (x − d),
for the numerator. Include a constant factor for stretching/flipping. Begin with y =
k
(x−a)(x−d)
?
.
2. Find all vertical asymptotes x = b, x = c, and construct factors
(x − b), (x − c), for the denominator.
y = k
(x − a)(x − d)
(x − b)(x − c)
3. Do preliminary sign analysis. If the sign of y changes across an x-intercept or vertical
asymptote at x = q, the factor (x − q) should be raised to an odd power; if the sign
does not change, the factor must be raised to an even power.
4. Look at horizontal asymptotes.
If there is no horizontal asymptote, be sure that (degree of the numerator) > (degree of
the denominator).
If the x-axis is a horizontal asymptote, be sure that (degree of the numerator) < (degree
of the denominator).
For any other horizontal asymptote, the degree of the numerator and denominator must
be equal; adjusting k adjusts the height of the horizontal asymptote.
Notice that introducing a factor like (x
2
+ 1) in the numerator or denominator changes its
degree without introducing new zeros or vertical asymptotes because (x
2
+ 1) has no zeros.
416 CHAPTER 11 A Portrait of Polynomials and Rational Functions
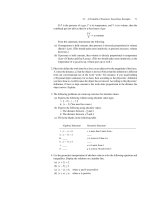
EXERCISE 11.13 Find functions that fit the graphs below.
y
x
x = –1 x = 2
y = 2
(a)
y
x
x = –1 x = 1
2
y = 3
(b)
Figure 11.32
Possible answers
(a) f(x)=
2x
3
(x+1)(x−2)
2
(b) f(x)=
3(x−2)
2
(x−1)(x+1)
◆
EXAMPLE 11.15 What are the absolute maximum and minimum values taken on by
f(x)=
x −2
x
2
+ 5
?
SOLUTION First notice that f(x) has no vertical asymptotes, as x
2
+ 5 > 0. Observe that
lim
x→∞
f(x)=0,so we do expect to find absolute extrema for this function.
The extrema must occur at critical points of f .Wefind f
using the Quotient Rule.
f
(x) =
(x
2
+ 5) · 1 − (x − 2) · 2x
(x
2
+ 5)
2
=
x
2
+ 5 − 2x
2
+ 4x
(x
2
+ 5)
2
=
−x
2
+ 4x + 5
(x
2
+ 5)
2
f
(x) is always defined; we look for x such that f
(x) = 0.
−x
2
+ 4x + 5
(x
2
+ 5)
2
= 0
x
2
− 4x − 5 = 0
(x − 5)(x + 1) = 0
x = 5orx=−1
Critical points: x =−1and x = 5.
11.4 Rational Functions and Their Graphs 417
graph of f
sign of f ′
(–) –15(+) (–)
Figure 11.33
f
(x) −
−(x − 5)(x + 1)
(x
2
+ 5)
2
Minimum at x =−1. f(−1)=
−1−2
(−1)
2
+5
=
−3
6
=−
1
2
. This is the absolute minimum
of f .
Maximum at x = 5. f(5)=
5−2
25+5
=
3
30
=
1
10
. This is the absolute maximum value
of f .
◆
PROBLEMS FOR SECTION 11.4
1. Find an equation to fit the important features of the graph. For the purposes of this
problem, the important features are the horizontal and vertical asymptotes, x-intercepts,
and the sign of y.
y
x
y=2 y=2
y=1
x= –1 x= –1
y
xx
(a)(b)
x= –1
y
(c)
–2
x
x= –1 x=2
y
(d)
xx
x=–1x=2
y
(e)
x= –3 x=1
y
( f)
x
x= –3 x=1
y
(g)
x
x=0
y
(h)
2
2. Suppose a distance function is given by d(t) = 1/t for 0.5 ≤ t ≤ 20.
(a) What is the average velocity over the interval from t = 1tot=5?
(b) Is there a time at which the instantaneous velocity is the same as the average
velocity over the interval from t = 1tot=5? If so, find that time.
(c) On the same set of axes, illustrate your answers to parts (a) and (b).
418 CHAPTER 11 A Portrait of Polynomials and Rational Functions
3. Find possible equations for the following graphs:
y
x
x= –1 x=2
y=2 y=2
(a)
y
x
–2
x= –1
(b)
y
x
–2
x= –1 x=1
(c)
4. Let f(x)=
x
2
+1
x
2
= 1 +
1
x
2
(a) Graph f .
(b) Find the following.
i. lim
x→∞
f(x) ii. lim
x→0
f(x) iii. lim
x→∞
f
(x)
iv. lim
x→0
+
f
(x) v. lim
x→0
−
f
(x)
(c) Graph f
(x).
(d) Find f
(x).
(e) Are your answers to all parts of this problem consistent? (If not, find your errors.)
5. Graph f(x)=
x
3
+x
2
x
2
−4
. This function has four local extrema. One you can locate exactly.
Where is it? Approximate the other three using your graphing calculator. (Notice that
depending upon the viewing window you choose it may be very difficult to realize this
function has four local extrema! When you use the calculator, use it carefully.)
6. Find a function whose graph matches the one drawn below.
y
y = 1
–2
x
7. Graph the following, clearly labeling all x- and y-intercepts, vertical asymptotes, and
horizontal asymptotes.
(a) y =
x
2
−4
x
2
−3x−4
(b) y =
3x
2
(x−1)
2
(c) y =
(x−1)(x−2)
x(x−1)(x−3)(x+1)
11.4 Rational Functions and Their Graphs 419
8. Find possible equations to match with the following graphs.
y
y = – 4
y = –2
–33
x = –2 x = 1
x
y
x
(a)(b)
9. At one point in Leo Tolstoy’s novella The Death of Ivan Ilyich, the title character states
that the amount of blackness (the opposite of goodness in this context) in his life is in
“inverse ratio to the square of the distance from death.” Let B(t) represent the amount
of blackness in his life, where t measures the amount of time since his birth, and let
t = D represent the time of his death.
(a) Write an equation for B(t). (Your answer should include the constant D.)
(b) Your equation for B(t) should have an arbitrary constant in it. Can you determine
the sign of this constant?
(c) Sketch a graph of B(t). Is it increasing or decreasing? Concave up or concave
down? Label any t-orB-intercepts and any asymptotes.
10. What characteristics might the graph of a rational function (a polynomial divided by a
polynomial) have that the graph of a polynomial will not have?
11. Graph f(x)=
4
x
+ x.
(a) Find f
(x). Make a number line, marking all points at which f
is zero or unde-
fined. Use the number line to indicate the sign of f
; above this indicate where the
graph of f is increasing and where it is decreasing.
Note: x = 0 is not a critical point, since f is undefined at x = 0. However,
it is possible for the sign of f
to change on either side of a point at which f
is
undefined, so x = 0 must be labeled on your number line.
(b) Find f
(x). Make a number line, marking all points at which f
is zero and
undefined. Use the number line to indicate the sign of f
; above this indicate
where the graph of f is concave up and where it is concave down.
(c) Graph f(x). Label both the x- and y-coordinates of the local maxima and local
minima.
(d) Does f(x)have an absolute maximum value? If so, what is it? Does f(x)have an
absolute minimum value? If so, what is it?
12. Graph each of the following equations without using calculus. Label the following.
(a) The x-intercepts; the y-intercepts
(b) The vertical asymptotes
(c) The horizontal asymptotes
420 CHAPTER 11 A Portrait of Polynomials and Rational Functions
An analysis of where y is positive and where it is negative must be included. You need
not find the coordinates of the local extrema. You need not look at y
.
i. y =
x
(x−1)(x+1)
ii. y =
x
2
(x−2)
(x−1)(x+1)
iii. y =
x
2
(x−2)
(x−1)(x+1)
iv. y =
x
2
(x−2)
(x−1)
2
(x+1)
v. y =
x(x−2)
(x−1)
2
(x+1)
vi. y =
(x−3)(x−2)
(x−1)(x+1)
vii. y =
2
x
2
+1
viii. y =
−x
2
x
2
+1
13. Graph the following functions using the information provided by the derivatives for
guidance. Indicate where the function is increasing, where it is decreasing, and the
coordinates of all local extrema.
(a) f(x)=x+
1
x
(b) g(x) = x −
1
x
14. Suppose that f(x) is a rational function with zeros at x = 0 and x = 4, vertical
asymptotes at x =−2and x = 3, and a horizontal asymptote at y = 5.
For each of the following functions, indicate the location of any
(a) zeros. (b) vertical asymptotes. (c) horizontal asymptotes.
If there is not enough information to answer part of any question, say so.
i. g(x) = f(x−3) ii. h(x) = f(x)−3
iii. j(x)= 2f(3x) iv. k(x) = f(x
2
)