Effect of mixed additives on lead–acid battery electrolyte pdf
Bạn đang xem bản rút gọn của tài liệu. Xem và tải ngay bản đầy đủ của tài liệu tại đây (134.04 KB, 6 trang )
Effect of mixed additives on lead–acid battery electrolyte
Arup Bhattacharya, Indra Narayan Basumallick
*
Electrochemical Laboratory, Department of Chemistry, University of Visva-Bharati, Santiniketan 731235, India
Abstract
This paper describes the corrosion behaviour of the positive and negative electrodes of a lead–acid battery in 5 M H
2
SO
4
with binary
additives such as mixtures of phosphoric acid and boric acid, phosphoric acid and tin sulphate, and phosphoric acid and picric acid. The effect
of these additives is examined from the Tafel polarisation curves, double layer capacitance and percentage of inhibition efficiency. A lead salt
battery has been fabricated replacing the binary mixture with an alternative electrolyte and the above electrochemical parameters have been
evaluated for this lead salt battery. The results are explained in terms of H
þ
ion transport and the morphological change of the PbSO
4
layer.
# 2002 Elsevier Science B.V. All rights reserved.
Keywords: Corrosion; Picric acid; Phosphoric acid; Boric acid; Tin sulphate; Lead–acid battery
1. Introduction
During the last two decades the lead–acid battery has been
widely used in battery driven vehicles and for storing
electrical energy from non-conventional sources.
In spite of rapid improvement in its performance and
design, there remain some problems of the battery which are
yet to be solved. These problems have drawn the attention of
the battery scientists which has resulted in an annual pub-
lication of more than 150 papers in the scientific journals and
a good number of patents.
The use of additives in the electrolyte is one of the
approaches which offers improvement of the battery without
much alteration of other factors. The major problem lies
with selecting a suitable additive which is chemically,
thermally and electrochemically stable in highly corrosive
environment. Among the additives used so far the most
widely investigated is H
3
PO
4
[1,2] which has been reported
as a beneficial additive in terms of improving cycle life,
decreasing self discharge and increasing the oxygen over
potential on the positive electrode. Among the other addi-
tives, H
3
BO
3
[3] and SnSO
4
[4] are also prominent. In the
present research, an attempt has been made to use a mixture
of additives (instead of single additive as studied earlier) to
the electrolyte and to examine the performances of the
electrode and the battery in the presence of these additives.
The mixed additives used in the present study are: (a) H
3
PO
4
and H
3
BO
3
, (b) H
3
PO
4
and SnSO
4
, (c) H
3
PO
4
and picric acid
(C
6
H
3
N
3
O
7
). It is expected that these additives will improve
the electrochemical behaviour of the individual electrodes
and the battery as a whole. In this study, a lead salt battery is
also investigated. In three different types of lead salt battery
we used: (i) (NH
4
)
2
SO
4
alone, (ii) hydrogel (agar agar) with
(NH
4
)
2
SO
4
, and (iii) U-foam soaked with (NH
4
)
2
SO
4
instead of 5 M H
2
SO
4
as electrolyte.
2. Experimental
The electrochemical performance of the electrodes and
the electrolyte (5 M H
2
SO
4
, as blank), with and without
mixed additives, has been examined from Open Circuit
Potential (OCP) data, and polarisation, cyclovoltammetric
and galvanotransient studies. These studies have been car-
ried out using conventional techniques with a potentiostat/
galvanostat (Vibrant, Model VSMCS 30, Lab India) and a
multimeter. The detailed experimental set-up has been
described in our earlier paper [5]. In all these studies a
Hg/Hg
2
SO
4
reference electrode in H
2
SO
4
of the same
molarity (5 M) and a Pt foil counter electrode are used.
The working electrode was either pure Pb (99.28% pure,
Johnson Mathey) or PbO
2
(electrochemically prepared by
anodic oxidation using standard techniques).
3. Results and discussions
Many reports have been published on the use of H
3
PO
4
as
additive to the electrolyte. In our study with mixed additives
Journal of Power Sources 113 (2003) 382–387
*
Corresponding author.
0378-7753/02/$ – see front matter # 2002 Elsevier Science B.V. All rights reserved.
PII: S 0378-7753(02)00552-9
we have used H
3
PO
4
mixed with other components like
H
3
BO
3
, SnSO
4
and picric acid (C
6
H
3
N
3
O
7
). The positive
and negative electrode potentials and the cell potentials in
the presence of the mixed additives are shown in Table 1.
It may be noted that the electrode and the cell potentials
are shifted to some extent in the presence of these additives.
With picric acid and H
3
PO
4
, the cell potential and the
negative electrode potential are sharply reduced. The elec-
trode reaction at the negative electrode in the electrolyte
with and without additives is represented by the following
equation:
Pb þ SO
4
2À
¼ PbSO
4
þ 2e (1)
There are three factors which may alter the electrode
potentials: (i) the activity of solid Pb may be changed
due to the specific adsorption of additives (single additive
or mixture of additives). Thus, if the surface coverage is y,
the active surface taking part in the reaction will be (1Ày).
(ii) The activity of SO
4
2À
ion may be altered due to the
presence of the additive in the electrolyte. (iii) The activity
of the PbSO
4
layer may also be changed due to the mor-
phological changes.
Since the concentration of the additives is relatively small,
the change of activity of SO
4
2À
ion may not be significant.
However, it seems that factors (i) and (iii) are often impor-
tant in understanding the functioning of the electrodes in the
presence of the additives. The poor performance of the Pb
electrode with picric acid and H
3
PO
4
as additives seems to
arise from the strong adsorption of picric acid at the elec-
trode surface. For the positive plate (PbO
2
) the situation is
much more complex because there are at least five different
layers over the surface [6,7]. However, the basic reactions
may be represented as follows:
PbO
2
þ 2H
þ
þ SO
4
2À
¼ PbSO
4
þ H
2
O (2)
It seems that morphological changes of the PbSO
4
layer
(vide factor (iii) above) seem to play an important role in
dictating the potential of these electrodes.
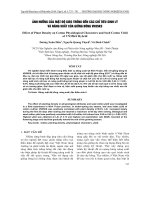
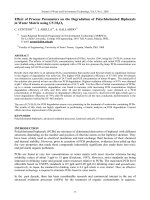
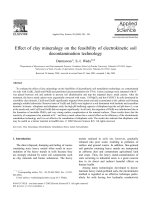
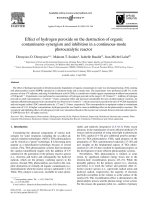
Typical Tafel polarisation curves are as shown in Figs. 1
and 2.
Results of the analysis of Tafel plots are presented in
Tables 2 and 3 below.
Analysis of the inhibition efficiency (IE%) of these
additives reveals that picric acid and H
3
PO
4
act as good
corrosion inhibitors of the electrodes but they also inhibit the
electrode reaction. So, the performance of the battery will
also be reduced because of a decrease in the rates of the
reactions. Ideally for the negative electrode an inhibitor
should inhibit the corrosion by retarding the hydrogen
evolution reaction (HER) and not the metal dissolution
reaction which is important for the functioning of the
battery. Similarly, for the positive electrode an inhibitor
should inhibit the oxygen evolution reaction (OER) and
not the PbO
2
reduction reaction. Therefore, we have studied
the oxygen evolution overpotential of the positive electrode
in the presence of mixed additives and these are tabulated as
shown in Table 4.
The mixture of H
3
PO
4
and H
3
BO
3
[8] reduced the oxygen
overpotential to a small extent but the mixture of H
3
PO
4
and
SnSO
4
[9,10] increased it. The exchange currents for the
OER apparently seem to be anomalous because these values
have not behaved as expected from the oxygen evolution
potentials.
From Table 4 it seems that H
3
PO
4
and SnSO
4
may be a
good additive combination for the lead–acid battery. The
charging behaviour of the cell using H
3
PO
4
and SnSO
4
is
very interesting. The Sn
2þ
ion has been found to deposit at
the negative plate during charging (Sn
2þ
þ 2efi Sn,
E ¼À0:136 V and Pb
2þ
þ 2efi Pb, E ¼À0:126 V). How-
ever, the situation may be overcome by using a controlled
concentration of SnSO
4
and using a complexing agent. The
model of specific adsorption of additives on the electrode
Table 1
OCP values (vs. Hg/Hg
2
SO
4
; mV) of Pb and PbO
2
electrodes in lead–acid 5 M H
2
SO
4
with and without different mixed additives at 298 K
Electrodes OCP in 5 M H
2
SO
4
(mV)
OCP in 5 M H
2
SO
4
þ 0.5% (v/v)
H
3
PO
4
þ 0.5% (v/v) H
3
BO
3
(mV)
OCP in 5 M H
2
SO
4
þ 1% (v/v)
H
3
PO
4
þ 1% (w/v) SnSO
4
(mV)
OCP in 5 M H
2
SO
4
þ 1% (v/v)
H
3
PO
4
þ 10% (v/v) C
6
H
3
N
3
O
7
(mV)
Pb À948
a
À969 À877 À366
PbO
2
1154
b
1108 1110 1040
Cell: Pb–PbO
2
2102 2077 1987 1406
a
Literature value: À0.95 V vs. Hg/Hg
2
SO
4
in [11].
b
Literature value: 1.10–1.30 V vs. Hg/Hg
2
SO
4
in [12].
Fig. 1. Tafel polarisation curves of negative plate for the following: ( )
blank (5 M H
2
SO
4
); ( )5MH
2
SO
4
þ 0:5% (v/v) H
3
PO
4
þ 0:5% (v/v)
H
3
BO
3
;( )5MH
2
SO
4
þ 1% (v/v) H
3
PO
4
þ 1% (w/v) SnSO
4
;( )5M
H
2
SO
4
þ 1% (v/v) H
3
PO
4
þ 10% (v/v) C
6
H
3
N
3
O
7
.
A. Bhattacharya, I.N. Basumallick / Journal of Power Sources 113 (2003) 382–387 383
surface and the morphological changes of the PbSO
4
layer
which regulate H
þ
ion transport through different layers
have been identified as key factors governing the functioning
of the electrodes in the presence of additives.
These factors have been studied through measurement of
the double layer capacitance of the electrodes in the pre-
sence of additives and by fabricating a cell replacing the acid
by a salt, (NH
4
)
2
SO
4
. The model of H
þ
ion transport through
PbSO
4
layer as has been proposed to explain the alteration of
the rates of the electrode reactions in terms of corrosion
current has been further studied with laboratory test cells
without using 5 M H
2
SO
4
. Three different types of cell have
been studied.
(1) Replacing 5 M H
2
SO
4
by 20% (w/v) (NH
4
)
2
SO
4
as
electrolyte.
(ii) Replacing 5 M H
2
SO
4
by hydrogel (agar agar) with
20% (w/v) (NH
4
)
2
SO
4
as electrolyte.
Fig. 2. Tafel polarisation curves of positive plate for the followings: ( ) blank (5 M H
2
SO
4
); ( )5MH
2
SO
4
þ 0:5% (v/v) H
3
PO
4
þ 0:5% (v/v) H
3
BO
3
;( )
5MH
2
SO
4
þ 1% (v/v) H
3
PO
4
þ 1% (w/v) SnSO
4
;( )5MH
2
SO
4
þ 1% (v/v) H
3
PO
4
þ 10% (v/v) C
6
H
3
N
3
O
7
.
Table 2
Potentiodynamic polarisation parameters for the corrosion of the negative plate (Pb) in lead–acid battery electrolyte with and without different mixed
additives at 298 K
Electrolyte Corrosion potential
E
corr
(mV)
Corrosion current
I
corr
(mA cm
À2
)
a
Tafel slopes
(mV per decade)
Inhibition
efficiency (IE, %)
b
c
b
a
5MH
2
SO
4
(blank) À924 5.01 50 59 –
5MH
2
SO
4
þ 0.5% (v/v) H
3
PO
4
þ 0.5% (v/v) H
3
BO
3
À917 4.89 30 55 2.4
5MH
2
SO
4
þ 1% (v/v) H
3
PO
4
þ 1% (w/v) SnSO
4
À855 4.57 37 54 8.8
A: 5 M H
2
SO
4
þ 1% (v/v) H
3
PO
4
þ 10% (v/v) C
6
H
3
N
3
O
7
À328 4.27 27 32 14.8
a
With apparent geometrical surface area ¼ 1cm
2
.
Table 3
Potentiodynamic polarisation parameters for the corrosion of the positive plate (PbO
2
) in lead–acid battery electrolyte with and without different mixed
additives at 298 K
Electrolyte Corrosion
potential E
corr
(mV)
Corrosion current
I
corr
(mA cm
À2
)
a
Tafel slopes
(mV per decade)
Inhibition
efficiency (IE, %)
b
c
b
a
5MH
2
SO
4
(blank) 1149 5.01 108 62 –
5MH
2
SO
4
þ 0.5% (v/v) H
3
PO
4
þ 0.5% (v/v) H
3
BO
3
1103 4.47 128 43 10.8
5MH
2
SO
4
þ 1% (v/v) H
3
PO
4
þ 1% (w/v) SnSO
4
1105 4.27 113 60 14.8
5MH
2
SO
4
þ 1% (v/v) H
3
PO
4
þ 10% (v/v) C
6
H
3
N
3
O
7
(picric acid)
1026 3.90 114 54 22.2
a
With apparent geometrical surface area ¼ 1cm
2
.
384 A. Bhattacharya, I.N. Basumallick / Journal of Power Sources 113 (2003) 382–387
(iii) Replacing 5 M H
2
SO
4
by U-foam soaked with 20%
(w/v) (NH
4
)
2
SO
4
as electrolyte.
Polarisation studies of commercial plates in these systems
were carried out. The different kinetic and equilibrium
parameters in these systems are shown in Table 5. It may
be noted that electrodes dipped in the electrolyte with 20%
(w/v) (NH
4
)
2
SO
4
exhibit poor kinetic and equilibrium para-
meters. This indicates that the H
þ
ion plays an important
role in dictating the electrode reactions of the plate. It may
be mentioned that the low I
corr
values may not be due to poor
conductance of the solution. The specific conductance of a
20% (w/v) (NH
4
)
2
SO
4
solution and such solution within a
gel have been determined and are presented in Table 6.
Based on our polarisation and conductance studies we
conclude that the transport of the H
þ
ion across the PbSO
4
membrane of the positive plate plays an important role in the
electrode reactions as mentioned earlier.
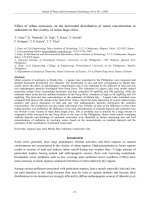
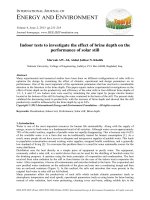
In our double layer capacitance studies using a galvano-
transient technique we have injected a current pulse of 5 mA
and the resulting potential–time transients are as shown in
Figs. 3 and 4. From the slope of the transient curve the
double layer capacitance of the electrode has been deter-
mined using the following relation
C ¼
i
dV=dT
and the differential capacitance values at the equilibrium
potential are shown in Tables 7 and 8. It should be mentioned
that the double layer capacitance values are important in
understanding the presence or absence of adsorbed additives.
Table 4
Electrochemical parameters of positive (PbO
2
) plate obtained from cyclovoltammogram studies at the scan rate of 15 mV s
À1
Electrolyte Oxygen evolution reaction
(OER) potential (mV)
Exchange current
for OER (mA)
5MH
2
SO
4
(blank) 1312 5.60
5MH
2
SO
4
þ 0.5% (v/v) H
3
PO
4
þ 0.5% (v/v) H
3
BO
3
1200 5.39
5MH
2
SO
4
þ 1% (v/v) H
3
PO
4
þ 1% (w/v) SnSO
4
1388 5.75
5MH
2
SO
4
þ 1% (v/v) H
3
PO
4
þ 10% (v/v) C
6
H
3
N
3
O
7
(picric acid) 1317 5.51
In 5 M H
2
SO
4
(blank), 5 M H
2
SO
4
containing aqueous solution of 0.5% (v/v) H
3
PO
4
and 0.5% (v/v) H
3
BO
3
,5MH
2
SO
4
containing aqueous solution of 1%
(v/v) H
3
PO
4
and 1% (w/v) SnSO
4
and 5 M H
2
SO
4
containing aqueous solution of 1% (v/v) H
3
PO
4
and 10% (v/v) C
6
H
3
N
3
O
7
at 298 K.
Table 5
Potentiodynamic polarisation parameters for the corrosion of a commercial
negative plate in 20% (w/v) (NH
4
)
2
SO
4
, 20% (w/v) (NH
4
)
2
SO
4
–agar gel
and 20% (w/v) (NH
4
)
2
SO
4
–foam at 298 K
Electrolyte E
eqm.
E
corr
(mV) I
corr
(mAcm
À2
)
a
20% (w/v) (NH
4
)
2
SO
4
À365 À353 70
20% (w/v) (NH
4
)
2
SO
4
–agar gel À305 À256 46
20% (w/v) (NH
4
)
2
SO
4
–foam À345 À323 62
a
With apparent geometrical surface area ¼ 1cm
2
.
Table 6
Specific conductance of 20% (w/v) (NH
4
)
2
SO
4
, 20% (w/v) (NH
4
)
2
SO
4
–
agar gel and 20% (w/v) (NH
4
)
2
SO
4
–foam (m (mO cm)
À1
) at 298 K
Specific conductance
(m (mO cm)
À1
)
20% (w/v) (NH
4
)
2
SO
4
24
20% (w/v) (NH
4
)
2
SO
4
–agar gel 21
20% (w/v) (NH
4
)
2
SO
4
–foam 9
Fig. 3. Galvanotransient polarisation curve of negative plate for the solution 5 M H
2
SO
4
(blank).
A. Bhattacharya, I.N. Basumallick / Journal of Power Sources 113 (2003) 382–387 385
It may also be mentioned that these values will also reflect
contact adsorption of additives ions (like Sn
2þ
ions) at the
outer Helmholtz plane (OHP). The differential capacitance
of the negative electrode in the presence of these additives is
decreased significantly. This shows that these additives
adsorbed firmly at the electrode surfaces. Galvanotransient
behaviour of the picric acid þ H
3
PO
4
system is again unu-
sual and strong adsorption results due to soft–soft interaction
between the large picric acid molecules and the Pb atom.
Unlike the negative plate the double layer capacitance of the
positive plate is slightly increased in the presence of the
additives which may be due to the fact that the positive
active material (PbO
2
) deposited on the outer surface of the
lead (Pb) may not be selective to the strong adsorption of the
additives. It seems that the PbSO
4
layer formed over the grid
material and the active mass of the plate play an important
role and the observed slight increase in double layer capa-
citance may be due to the enhanced contact adsorption of
ions over the modified PbSO
4
layer.
For the system of H
3
PO
4
andpicricacidwenoted
an anomalous drop in the double layer capacitance
(Tables 7 and 8) which indicates the strong adsorption
Fig. 4. Galvanotransient polarisation curve of negative plate for the solution 5 M H
2
SO
4
containing aqueous solution of 0.5% (v/v) H
3
PO
4
and 0.5% (v/v)
H
3
BO
3
.
Table 7
Electrochemical parameters of negative (Pb) plate
a
obtained from galvanotransient studies
Electrolyte Differential capacity
(C, mFcm
À2
)
Charging time
(T,s)
Voltage
(mV)
5MH
2
SO
4
(blank) 54 0.20 À948
5MH
2
SO
4
þ 0.5% (v/v) H
3
PO
4
þ 0.5% (v/v) H
3
BO
3
30 0.20 À936
5MH
2
SO
4
þ 1% (v/v) H
3
PO
4
þ 1% (w/v) SnSO
4
31 0.21 À890
5MH
2
SO
4
þ 1% (v/v) H
3
PO
4
þ 10% (v/v) C
6
H
3
N
3
O
7
(picric acid) ––À366
In 5 M H
2
SO
4
(blank), 5 M H
2
SO
4
containing aqueous solution of 0.5% (v/v) H
3
PO
4
and 0.5% (v/v) H
3
BO
3
,5MH
2
SO
4
containing aqueous solution of 1%
(v/v) H
3
PO
4
and 1% (w/v) SnSO
4
, and 5 M H
2
SO
4
containing aqueous solution of 1% (v/v) H
3
PO
4
and 10% (v/v) C
6
H
3
N
3
O
7
(picric acid) at 298 K.
a
With apparent geometrical surface area ¼ 1cm
2
.
Table 8
Electrochemical parameters of positive (PbO
2
) plate
a
obtained from galvanotransient studies
Electrolyte Differential capacity
(C, mFcm
À2
)
Charging
time (T,s)
Voltage
(mV)
5MH
2
SO
4
(blank) 11 0.11 1254
5MH
2
SO
4
þ 0.5% (v/v) H
3
PO
4
þ 0.5% (v/v) H
3
BO
3
16 0.10 1248
5MH
2
SO
4
þ 1% (v/v) H
3
PO
4
þ 1% (w/v) SnSO
4
14 0.11 1210
5MH
2
SO
4
þ 1% (v/v) H
3
PO
4
þ 10% (v/v) C
6
H
3
N
3
O
7
(picric acid) 75 0.10 1205
In 5 M H
2
SO
4
(blank), 5 M H
2
SO
4
containing aqueous solution of 0.5% (v/v) H
3
PO
4
and 0.5% (v/v) H
3
BO
3
,5MH
2
SO
4
containing aqueous solution of 1%
(v/v) H
3
PO
4
and 1% (w/v) SnSO
4
and 5 M H
2
SO
4
containing aqueous solution of 1% (v/v) H
3
PO
4
and 10% (v/v) C
6
H
3
N
3
O
7
(picric acid) at 298 K.
a
With apparent geometrical surface area ¼ 1cm
2
.
386 A. Bhattacharya, I.N. Basumallick / Journal of Power Sources 113 (2003) 382–387
of picric acid over the positive active material (PAM) and
the grid.
4. Conclusions
Based on these studies we may conclude that mixed
additives, viz. H
3
PO
4
þ H
3
BO
3
and H
3
PO
4
þ SnSO
4
improve the electrolyte of the lead–acid battery. The corro-
sion of both the negative and the positive plates are sig-
nificantly reduced in the presence of these two additive
mixtures. The electrode and the cell potentials are not much
disturbed using these two additives in the electrolyte. The
mechanism of corrosion inhibition by these additives
involves:
(i) alteration of the physical structure of the PbSO
4
layer
on the electrode surface;
(ii) adsorption of the additives on the electrode surface;
(iii) regulating the transport of the H
þ
ion from the
solution to the corrosion layer (CL) through the PbSO
4
coating.
Any one of the above factors may be prominent depending
on the nature of the additives used. For picric acid and
H
3
PO
4
, adsorption of the additives on the electrode surface
may be important but for Sn
2þ
ion as additive also with
H
3
PO
4
at the positive electrode, the alteration of the struc-
ture of the PbSO
4
layer seems to be a key issue.
The transport of the H
þ
ion from the solution to the
corrosion layer through the PbSO
4
coating is also a key
factor in dictating the kinetics and the equilibrium of the
electrode reactions. The results obtained from our laboratory
model Pb–(NH
4
)
2
SO
4
battery also support the views that the
H
þ
ion plays an important role in the electrode reactions of
the positive electrode. The double layer capacitance values
provide information on the nature of the adsorption of the
additives.
Acknowledgements
The authors gratefully acknowledge the financial assis-
tance from the DST (West Bengal).
References
[1] D. Pavlov, J. Power Sources 42 (1993) 345.
[2] J. Garche, H. Doring, K. Wiesener, J. Power Sources 33 (1991) 213.
[3] W.A. Badawy, S.S. El-Egamy, J. Power Sources 55 (1995) 11.
[4] E. Voss, U. Hullmeine, A. Winsel, J. Power Sources 30 (1990) 33–
40.
[5] A. Mukherjee, I.N. Basumallick, J. Power Sources 58 (1996) 183.
[6] D. Pavlov, B. Monahov, J. Electrochem. Soc. 143 (1996) 3616–3629.
[7] D. Pavlov, J. Electrochem. Soc. 139 (1992) 3075.
[8] A. Bhattacharya, I.N. Basumallick, Bull. Electrochem. 14 (1998)
177.
[9] A. Bhattacharya, I.N. Basumallick, Bull. Electrochem. 17 (2001) 501.
[10] A. Bhattacharya, I.N. Basumallick, Bull. Electrochem. 17 (2001)
495.
[11] D. Pavlov, B. Monahov, J. Electroanal. Chem. 218 (1987) 135–153.
[12] D. Pavlov, B. Monakhov, M. Maja, N. Penazzi, J. Electrochem. Soc.
136 (1989) 27–33.
A. Bhattacharya, I.N. Basumallick / Journal of Power Sources 113 (2003) 382–387 387