Studies on electrolyte formulations to improve life of lead acid batteries working under partial state of charge conditions potx
Bạn đang xem bản rút gọn của tài liệu. Xem và tải ngay bản đầy đủ của tài liệu tại đây (1.26 MB, 13 trang )
Journal of Power Sources 162 (2006) 851–863
Studies on electrolyte formulations to improve life of lead acid
batteries working under partial state of charge conditions
J.C. Hern
´
andez, M.L. Soria
∗
, M. Gonz
´
alez, E. Garc
´
ıa-Quismondo, A. Mu
˜
noz, F. Trinidad
Exide Technologies, Research and Innovation, Autov´ıa A-2, km 42, E-19200 Azuqueca de Henares, Spain
Received 11 February 2005; accepted 15 July 2005
Available online 19 September 2005
Abstract
For decades, valve regulated lead acid batteries with gel electrolyte have proved their excellent performance in deep cycling applications.
However, their higher cost, when compared with flooded batteries, has limited their use in cost sensitive applications, such as automotive or
PV installations.
The use of flooded batteries in deep or partial state of charge working conditions leads to limited life due to premature capacity loss provoked
by electrolyte stratification. Different electrolyte formulations have been tested, in order to achieve the best compromise between cost and
life performance. Work carried out included electrochemical studies in order to determine the electrolyte stability and diffusional properties,
and kinetic studies to check the processability of the electrolyte formulation. Finally, several 12 V batteries have been assembled and tested
according to different ageing profiles.
© 2005 Elsevier B.V. All rights reserved.
Keywords: Valve-regulated lead-acid batteries; Gel electrolytes; PSOC; Cycle life; Failure mode analysis
1. Introduction
Flooded lead-acid batteries are now extensively used in
automotive as well as in many traction and stationary appli-
cations, due to their lower cost when compared to valve regu-
lated lead acid (VRLA) batteries, either with gel or absorptive
glass mat (AGM) technologies.
However, novel vehicle requirements demand bat-
tery working regimes mainly under partial-state-of-charge
(PSOC) conditions, that, in the case of flooded batteries, lead
to premature capacity loss provoked by electrolyte stratifi-
cation [1]. Changes in the demands on automotive batteries
[2] are caused by the increase of on-board power require-
ments due to the introduction of several new features, such
us the replacement of mechanical by electrical functions
(steer- and brake-by-wire, air conditioning, ) to provide
enhanced safety and comfort, as well as of novel func-
∗
Corresponding author. Tel.: +34 949 263 316; fax: +34 949 262 560.
E-mail address: (M.L. Soria).
tions (Stop and Start, regenerative braking, etc.) aimed at
achieving significant fuel consumption and emission savings
[3].
According to the power requirements and vehicle hybridi-
sation degree, several drivetrain and powernet architectures
have been proposed [4], with nominal voltages ranging
from 14 to nearly 300 V in automobiles and over 600 V in
hybrid buses. Moreover, different electrochemical systems
have been installed either in commercial hybrid vehicles or
in demonstration prototypes: the well known hybrid vehi-
cles Toyota Prius, Honda Insight or Ford Escape, with high
voltage Ni-MH batteries, the Citr
¨
oen C3 with Stop and Start
function and an AGM VRLA 12 V battery, and the Nissan
Tino with a Li-ion 346 V battery [5].
VRLA batteries are today the cost effective solution for
short termlow voltage applications (14–42 V powernets), due
to their availability, cost and low temperature performance.
AGM technology is commonly used, due to the high power
capability demanded as well as to the improved life when
compared with flooded designs and its intrinsic maintenance
0378-7753/$ – see front matter © 2005 Elsevier B.V. All rights reserved.
doi:10.1016/j.jpowsour.2005.07.042
852 J.C. Hern´andez et al. / Journal of Power Sources 162 (2006) 851–863
free characteristics. However, as the electrolyte is limited to
that absorbed in the separator, extensive cycling can lead to
battery dry-out and even to thermal runaway.
On the other hand, gel batteries have up to date been
the preferred choice for deep cycling applications, as elec-
trolyte immobilisation hinders somewhat its stratification and
thus premature irreversible sulphation of active materials [6].
However, their power capability is limited by the higher elec-
trolyte internal resistance and by the use of thick plate designs
in commercial applications (products for deep cycling).
Within the Supercar project [7], some car manufactur-
ers are testing hybrid configurations for the energy storage
system, so that energy generated during vehicle brake is
recovered by a high power device (a double layer capacitor,
also known as supercapacitor), whereas the battery provides
energy to all the consumers during vehicle stops and regen
and boost phases [3]. In this case, the battery should be char-
acterised by a long-lasting life under moderate rate (around
1–2 C A discharge and charge) conditions. For this reason,
gel type batteries with electrode design and active materi-
als adapted to automotive applications have been extensively
studied for these hybrid energy storage configurations. Dif-
ferent gel formulations have been tested in order to obtain the
best performance compromise between initial performance
(capacity and cold cranking) and life under different moder-
ate rate PSOC conditions.
2. Experimental
2.1. Electrolyte preparation
Several gel formulations were prepared using sulphuric
acid and different inorganic commercial compounds, mainly
with a silica basis. Table 1 summarises the main characteris-
tics of the commercial gelators used in these investigations.
As shown, one of the key parameters is the BET specific
surface, related to the particle size, which will control the
gelation kineticsand the final gel strength[8]. Another impor-
tant parameter is the doping content: the SiO
2
is doped with
different percentages of aluminium in order to modify the
siloxane bond strength.
Two sulphuric acid concentrations have been studied in
the electrochemical experiments: 1.285 and 1.300 g cm
−3
,
whereas in the prototypes assembled with gel electrolyte,
only the latter concentration was used. Electrolytes con-
taining fumed silica were prepared by mixing the cooled
1.300 g cm
−3
sulphuric acid (−5
◦
C) with the inorganic com-
pound during 10 min with a high speed mixer at 8000 rpm.
On the other hand, electrolytes containing colloidal silica
were prepared by mixing the cooled sulphuric acid with a
low speed mixer during 4 min. In this case, H
2
SO
4
concen-
tration was calculated to become 1.300 g cm
−3
after dilution
with the silica colloid. All the formulations included 15 g l
−1
of Na
2
SO
4
and 3 g l
−1
MgSO
4
as additives to improve the
battery rechargeability at low state of charge (SOC).
The electrolyte formulations to be tested in batteries were
chosen taking into account the final gel characteristics (sta-
bility and strength) and the gelling time. Gelling time is a
process parameter that affects the electrolyte processability
during battery assembly (filling and formation). An optimum
compound would maintain its liquid characteristics till the
end of the battery manufacturing processes and then would
gellify.
With the aim of determining the gelling time of the sil-
ica compounds, a kinetic study was carried out by measuring
the penetration of lead balls (3 mm diameter) into the gel at
different times. SiO
2
concentration, acid concentration and
initial temperature were variables studied in this investiga-
tion. These results can be summarised:
• Increasing the acid concentration, the gelling time is
shorter.
• Increasing the silica concentration, the gelling time is
shorter. However, it is necessary a minimum SiO
2
content
to obtain a good gel structure [8].
• It is possible to reduce the gelling rate by reducing the
initial acid temperature.
• Using silica-based compounds with smaller particle size
(higher BET), the gelling rate is increased.
• Generally, colloidal silica compounds need less time to
form the gel structure (duration) than fumed silica com-
pounds.
In this way, several electrolyte formulations were selected
to be tested in batteries.
2.2. Electrochemical experiments
In order toevaluate the electrochemical performanceofthe
commercial silica compounds, cyclic and linear voltammetry
Table 1
Main characteristics of different commercial gel forming compounds
Sample SiO
2
(%) Al
2
O
3
(%) TiO
2
(%) BET (m
2
g
−1
) Particle size (nm)
A >99.8 <0.05 <0.03 200 ± 25 12 Fumed silica
B >99.8 <0.05 <0.03 300 ± 30 7 Fumed silica
C >99.8 <0.05 <0.03 380 ± 30 7 Fumed silica
D >98.3 0.3–1.3 <0.03 170 ± 30 15 Fumed silica with Al
E 82–86 14–18 <0.03 170 ± 30 NA Alumino silicate
F 15 Al 130 (ppm) Ti 35 (ppm) 750 4 Colloidal silica
G 40 Al 230 (ppm) Ti 40 (ppm) 250 14 Colloidal silica
J.C. Hern´andez et al. / Journal of Power Sources 162 (2006) 851–863 853
techniques and electrochemical impedance spectroscopy
(EIS) were used.
The voltammetric experiments were carried out using a
conventional three electrode system. The cell was filled with
the electrolyte just after preparation (liquid state) and argon
was blown into theelectrolyte with the aimof removing all the
oxygen from the solution. Afterwards, 24h restwere required
to assure the complete gel formation.
Cyclic voltammetry studies were carried out with a EG&G
Princeton Applied Research Potentiostat/Galvanostat Model
263 A, at different scan rates (from 5 to 200 mV s
−1
and
between 1.9 and −1.9 V versus MSE) for all the gel elec-
trolytes, using an electrochemical cell with lead working
(WE) and counter (CE) electrodes and a mercurous sulphate
electrode (MSE) (Hg/HgSO
4
/H
2
SO
4
) as reference electrode
(RE). All the experiments were performed at room tem-
perature of 20
◦
C. Before every measurement the WE was
polarised at –1.8 V versus MSE during 10 min.
Linear voltammetry experiments were carriedout from the
equilibrium state to−2.2 Vversus MSE inthe cathodic sweep
and to 2.3 V versus MSE in the anodic sweep, at 20 mV s
−1
.
In order to simulate the battery behaviour, stabilised Pb
◦
(by
10 min polarisation at −1.8 V versus MSE) for the cathodic
sweep and PbO
2
(obtained by anodic polarisation at 1.3 V
versus MSE of a Pb electrode for 3 h) for the anodic sweep
were used as WE.
Finally, EIS measurements were performed with a EIS-
meter equipment, version 1.2 with 14 channels, developed
by RWTH-ISEA. Spectra acquisition was carried out directly
on a 12 V 18 Ah battery at different SOC from 10,000 Hz to
0.003937 Hz.
2.3. Battery testing
Several battery prototypes were assembled using stan-
dard polypropylene containers sized 175 mm × 80 mm ×
174 mm, dry charged plates prepared with standard grav-
ity casted grids, automotive standard positive and negative
active material formulations and phenolic resin leaf sep-
arators. On the other hand, 12 V AGM prototype batter-
ies were assembled with standard ABS containers sized
180 mm × 75 mm × 150 mm, which are commonly used in
the manufacture of 15 Ah gel VRLA batteries for stand-by
applications. The battery design was based on former work
on the development of high power VRLA batteries for UPS
applications [9], and was characterised by thin plate tech-
nology (around 1 mm thickness) and the use as separator of
a combination of absorptive glass mat (AGM) material and
a microporous polyethylene membrane to avoid premature
battery failure due to shortcircuits.
Batteries were filled with different electrolyte formula-
tions using a vacuum system to improve the gel distribution.
Batteries with resin separators were filled with the gel for-
mulations selected in the kinetic study, however, AGM pro-
totypes were filled with a low concentration colloidal silica
based gel: AGM materials absorb part of the sulphuric acid,
increasing the silica concentration in the rest of the elec-
trolyte.
Electrical testingof thebatteries was carried out with com-
puter controlled cycling equipment: Bitrode LCN-7-100-12
and Digatron UBT 100-20-6BTS. High rate discharges were
performed with a computer controlled Digatron UBT BTS-
500 mod. HEW 2000-6BTS.
Fig. 1. Battery testing conditions according to Stop and Start profile.
854 J.C. Hern´andez et al. / Journal of Power Sources 162 (2006) 851–863
Tests ofgel batteries included initialcapacity, highrate and
cold cranking checks as well as cycle life performance under
PSOC and low-moderate rate conditions (50% SOC, 17.5%
depth of discharge (DOD) and C/3 A). Moreover, a specific
profile that simulates battery working conditions in a vehicle
designed with the Stop and Start and regenerative braking
functions and equipped with integrated starter generator and
a supercapacitor for peak power capability, and described
formerly [10] has also been tested. According to this profile
(Fig. 1), that corresponds to a total in-vehicle consumption
of 1100 W, tests were carried out with a charge and discharge
rates of nearly 2C and at 2% DOD and 80% SOC. A capacity
check and a recharge (4.5 A/14.4 V/12 h + 0.45 A/4 h) were
carried out every 10,000 microcycles. Moreover, the batteries
were recharged every 500 microcycles at 16 V/30 A during
one hour to compensate the capacity loss due to the limited
charge conditions of the proposed working profile.
After the cycle life test, batteries were torn down to
determine the failure mode. Chemical analyses of the active
material samples were carried out using internal volumetric
(PbO
2
) and gravimetric (PbSO
4
) procedures. Active material
porosity was measured with a mercury intrusion porosime-
ter Micromeritics Autopore 9405 and specific surface (BET)
with a Micromeritics FlowSorb II 2300. Morphological stud-
ies have been carried out by scanning electron microscopy.
3. Results and discussion
3.1. Electrochemical study
Fig. 2 shows a comparison of several gel composition and
acid electrolytes. No additional peaks appear in the voltam-
mograms of any of the new gel compositions due to secondary
redox reactions of the silica compounds, only an adsorption
capacity plateau in some cases (fumed silica) at more anodic
potentials than the Pb/Pb
2+
transition. This fact confirms that
all the silica based gelators studied are stable in the operative
conditions of the battery.
As it can be observed in Fig. 3, slight redox potential
(E
P
) shifts appear when a silica compound is added to the
sulphuric acid. On the other hand, differences in the intensity
of the redox peaks (i
P
) appear when comparing acid and gel
electrolytes [11]. This effect is more significant at high scan
rates and it could be attributed to the fact that the silica adsorbs
the polar ions (H
+
and SO
4
2−
) reducing their activity [12]
and, on the other hand, the three dimensional gel structure
hinders the ion diffusion.
In this way, the change in the E
P
and i
P
values with
regard to the scan rate for the discharge process (transition
Pb
◦
/PbSO
4
), implies that the reaction can not be considered
reversible in this range of scan rates [13].
Consequently, the equations will be for an irreversible pro-
cess:
i
P
= (2.99 × 10
5
)n(αn
a
)
1/2
D
1/2
o
C
∗
o
V
1/2
E
P
= E
o
−
RT
αn
a
F
×
0.780 + ln
D
1/2
o
k
o
+ ln
αn
a
FV
RT
1/2
where i
P
is the peak density current, n is the number of
electrons per molecule oxidised or reduced, α is the trans-
fer coefficient, n
a
is the number of electrons involved in the
rate determining step (rds), V is the linear potential scan rate,
C
∗
o
is the acid concentration, D
o
is the diffusion coefficient,
F is the Faraday, R the gas constant, T the temperature, k
o
the
standard heterogeneous rate constant, E
o
the formal potential
of the electrode and E
P
the peak potential.
Fig. 2. Cyclic voltammogram of a Pb WE in different electrolytes at 20 mV s
−1
.
J.C. Hern´andez et al. / Journal of Power Sources 162 (2006) 851–863 855
Fig. 3. Cyclic voltammogram of a Pb WE in different electrolytes at 20 and 100 mV s
−1
.
Thus, the ratio i
P
versus V
½
is proportional to the dif-
fusion coefficient D
o
of the electrochemical system. Fig. 4
shows the anodic peak intensity represented versus the square
root of the scan rate for different gel electrolytes and a stan-
dard acid electrolyte. Therefore, if only the electrolyte is
changed in the electrochemical cell and the experimental con-
ditions are fixed, the differences in the slopes are only related
to a change in the diffusion coefficient. On adding a silica
compound to the electrolyte, a three dimensional structure is
created that limits the ion diffusion, decreasing the D
o
of the
system.
Gel electrolytes with a very open structure, like colloidal
silica based gels, show slopes (proportional to D
o
) closer to
the sulphuric acid, and thus a lower decrease in the capacity
and in the high rate performance when compared to the liquid
electrolyte are obtained.
Other important effect provoked by the gel electrolyte, is
the shift of oxygen and hydrogen overpotentials, that can be
856 J.C. Hern´andez et al. / Journal of Power Sources 162 (2006) 851–863
Fig. 4. Dependence of anodic peak intensity with scan rate
1/2
for different gel electrolytes.
studied by linear voltammetry for the cathodic and anodic
sweeps using a Pb WE and a PbO
2
WE, respectively.
Fig. 5 shows the cathodic Tafel plots (H
2
evolution) of
some gel formulations (examples of sulphuric acid, fumed
silica and colloidal silica) compared to a standard acid elec-
trolyte whereas Table 2 shows the values of the Tafel slope,
exchange current (i
o
) and the hydrogen overpotential. From
the Tafel slopes, it can be inferred that the hydrogen evolution
mechanism is similar for all the electrolytes studied. On the
other hand, colloidal silica electrolytes present lower hydro-
gen overpotential and, in some cases, higher i
o
, probably due
to the higher iron content as impurity of these compounds,
whereas fumed silica compounds present a behaviour similar
to the acid electrolyte. This fact can seriously affect the water
consumption performance of the gel batteries [14]. Finally in
the linear voltammetry (anodic sweep) of the PbO
2
WE, the
results obtained show a similar behaviour for all the elec-
trolytes tested.
Electrochemical impedance spectroscopy measurements
were carried out to study the influence of the electrolyte mor-
phology on the battery performance [15]. Preliminary results
are shown in Figs. 6 and 7 where the Nyquist plots for a 18 Ah
battery with acid and gel (Silica Compound A, 6%) are repre-
sented. Impedance spectra were recorded during the battery
discharge at the C/10 rate, so that Nyquist plots were obtained
at different states of charge (SOC). Spectra from both systems
show similar shapes: an inductive part, an ohmic resistance,
two capacitative semi-circles and a Warburg impedance. Gel
batteries present higher ohmic resistance than flooded bat-
teries. The diffusional part of the signal appears at higher
frequencies in gel batteries than in flooded batteries: in fact,
in flooded batteries the Warburg impedance does not appear
till very low SOC [12,16].
These results reveal the importance of the three dimen-
sional structure created by the silica, on the diffusional battery
processes. According to these results, a decrease in the capac-
ity and in the high rate performance is expected when using
gel with regard to the standard flooded battery.
3.2. Battery testing
To check the cycling performance of different gel elec-
trolyte compositions in batteries, modules rated 12 V/18 Ah,
with five positive and five negative electrodes per cell and
resin leaf separators, were assembled.
Prototype series were filled with different gel electrolytes
using commercial additives and sulphuric acid 1.300 g cm
−3
.
In order to compare this technology with the standard flooded
Table 2
Initial potential of H
2
evolution, Tafel slope and exchange current for different silica based gelators
Initial potential of H
2
evolution versus MSE (V) TAFEL slope Exchange current i
o
(A cm
−2
)
Sulphuric acid (1.285 g cm
−3
) −1.60 −0.19012 4.96 × 10
−9
F (6%) −1.40 −0.19286 3.21 × 10
−8
G (6%) −1.35 −0.16444 4.24 × 10
−9
E (6%) −1.60 −0.1918 5.44 × 10
−9
J.C. Hern´andez et al. / Journal of Power Sources 162 (2006) 851–863 857
Fig. 5. Tafel plots of a Pb WE in different electrolytes. Cathodic sweep.
batteries, some batteries were filled only with sulphuric acid.
Gel batteries with the standard and with the special AGM
design, besides the flooded batteries, were tested according
to the same test protocol.
The initial electrical test results are summarised in Table 3.
The use of gel electrolytes provokes a reduction of the dis-
charge capacity [8,12]: a 5–15% decrease at the C/20 rate
and a 10–28% decrease in the 25 A discharge (reserve capac-
ity). This effect is not appreciated in gel batteries with the
AGM design, probably due to the special battery design opti-
mised for high power applications (eight positive and seven
negative electrodes per cell) and to the use of colloidal silica
formulations with a very open structure.
Concerning the high rate and cold cranking performances,
the main important difference is observed between batteries
with resin and with AGM separator. As it was expected, AGM
Fig. 6. Nyquist plot of a 18 Ah flooded lead acid battery.
858 J.C. Hern´andez et al. / Journal of Power Sources 162 (2006) 851–863
Fig. 7. Nyquist plot of a 18 Ah gel VRLA battery.
Table 3
Initial electrical test results of 12 V batteries with different electrolyte formulations
Electrolyte formulation Capacity (Ah) (0.9 A to
10.5 V, 25
◦
C)
Reserve capacity (min)
(25 A to 10.5 V, 25
◦
C)
High rate discharge, time (9 V)
(min), (100 A to 9 V, 25
◦
C)
Cold cranking voltage (10 s) (V), time
(7.2 V) (s) (200 A to 7.2 V, −18
◦
C)
H
2
SO
4
20.7 29.3 4.3 8.13–45
A (6%) 19.3 26.4 4.8 8.03–44
B (4%) 17.8 24.5 4.1 7.93–41.5
C (4%) 18.5 26.3 4.2 7.99–43
F (1.5%) 19.8 24.5 3.8 8.13–39
F (2%) 18.6 25.2 4.0 7.86–38
F (3%) 18.6 24.1 3.5 7.32–17
G (5.3%) 18.7 23.5 3.6 7.38–15
G (6%) 18.1 24.3 3.7 7.39–17
E (4%) 17.6 24.5 3.6 7.82–34
D (5%) 17.8 25.6 4.1 7.93–39
H
2
SO
4
(AGM) 18.7 28.2 NA NA
F (1%, AGM) 17.6 30.1 5.3 9.39–58.5
G (3%, AGM) 17.5 29.2 4.5 9.35–52
batteries with thinner electrodes present better performance
than the standard design, and no significant differences are
detected when adding a gel electrolyte with regard to the same
battery design filled with acid. On the other hand, standard
gel batteries show, in most cases, lower performances than
standard batteries filled only with acid. For a same gelator
used, the internal resistance increases at higher silica content
in the electrolyte.
Cycle life performance of the different prototypes presents
important differences (Table 4). As it was expected, batter-
ies filled with acid led to much shorter cycle life at the C/3
rate and 50% SOC, 17.5% DOD conditions than gel bat-
teries [17,18]. Comparing colloidal and fumed silica battery
performances during the cycle life test, an important capac-
ity decrease is observed for the former throughout the test
(Fig. 8).
Table 4
Cycle life test of 12 V gel batteries with commercial additives (17.5% DOD,
50% SOC, C/3 rate)
Gel formulation No. cycles
A (6%) 4505
A (4%) 2805
B (4%) 2125
E (6%) 850
H
2
SO
4
255
F (1.5%) 850
F (2%) 850
F (3%) 1870
F (1%, AGM design) 1785
G (3%, AGM design) 3400
G (5.3%) 850
G (6%) 1020
J.C. Hern´andez et al. / Journal of Power Sources 162 (2006) 851–863 859
Fig. 8. Capacity and end discharge voltage evolution during low-moderate rate PSOC cycle life test for colloidal and fumed silica gel batteries.
In order to check the effect of the lower hydrogen overpo-
tential detected in the Tafel studies, the water loss has been
measured during the cycle life test. The highest water con-
sumption is found in the colloidal gel batteries, confirming
the Tafel results. On the other hand, in all the cases, most
of the water consumption is observed at the beginning of the
cycling. When the battery reaches its saturation level (enough
cracks in the gel), the recombination efficiency increases and
the water consumption is stabilised.
Finally, batteries with 6% Silica Compound A have been
tested according to the Stop and Start cycling profile shown
in Fig. 1. Fig. 9 shows the end of discharge voltage and the
recharged capacity every 500 microcycles for a battery tested
according to Test 1 in Table 5. In these conditions, more than
80,000 microcycles were completed whereas the same bat-
tery design failed after 4000 microcycles in the same cycling
profile without the extra recharge. Visual inspection during
tear-down analysis of the batteries operated without extra
Fig. 9. Capacity recharged every 500 cycles and end of discharge voltage of batteries tested according to Stop and Start profile.
860 J.C. Hern´andez et al. / Journal of Power Sources 162 (2006) 851–863
Table 5
Stop and Start testing profiles
Test Microcycle Key life test
1 Charge (30.9 A/16 V/20 s) 500 microcycles, recharge (30 A/16 V/1 h), air draught cooling
Discharge (30 A/40 s)
Charge (30.9 A/16 V/40 s)
Discharge (30 A/20 s)
2 Charge (30.9 A/16 V/20 s) 500 microcycles, recharge (30 A/16 V/1 h), ambient temperature
Discharge (30 A/40 s)
Charge (30.9 A/16 V/40 s)
Discharge (30 A/20 s)
3 Charge (30.9 A/16 V/20 s) 500 microcycles, recharge (30 A/16 V/1 h), rest (6 h 20 min)
Discharge (30 A/40 s)
Charge (30.9 A/16 V/40 s)
Discharge (30 A/20 s)
4 Charge (30.9 A/16 V/20 s) 100 microcycles (5×), rest 1 h(5×), recharge (30 A/16 V/1 h), rest (1 h 20 min)
Discharge (30 A/40 s)
Charge (30.9 A/16 V/40 s)
Discharge (30 A/20 s)
5 Charge (30 A/16 V/25 s) 500 microcycles, rest (5 h 15 min)
Discharge (30 A/40 s)
Charge (30 A/16 V/50 s)
Discharge (30 A/20 s)
recharge showed strong sulphation of electrodes due to poor
recharge conditions.
Records of the Ah recharged every 500 microcycles
showed an increased charge acceptance along battery ageing:
when the battery operates under a good “state of health”, the
Ah recharged remain constant (4 Ah approx.), however, when
the battery ages due to irreversible sulphation processes, the
battery apparently accepts more charge, even though the bat-
tery working voltage remained constant along cycling. More-
over, the capacity checks every 10,000 microcycles showed
a significant capacity loss during cycling.
Other possible testing sequences with the same microcy-
cle profile have been proposed to check the effect of battery
warming (previous tests were carried out with air draught
cooling, the new ones at 25
◦
C ambient temperature) and test
pauses simulating long vehicle stops when not used. Testing
conditions are summarised in Table 5.
Concerning the water loss during cycling, the tendency
is similar in all the cases, however the lowest values
were observed in Stop and Start 4 (resting periods every
100 microcycles + recharge) whereas the highest water loss
was measured in Stop and Start 5 (recharge duration in
each microcycle increased 25%, that possibly led to battery
dry-out). Moreover, the internal resistance of the batteries
throughout cycling increased slightly, except in those batter-
ies that performed the Stop and Start 5 profile, which reached
20 m.
The results of these cycling tests show that the eventual
recharge of the battery during vehicle operation in suburban
areas can allow to maintain the battery SOC. Moreover, when
a rest period is included throughout the cycle life test, the
battery working voltage (EDV) decreases but test duration
is improved. Finally it was observed that during cycling, the
temperature remains approximately constant, and increases
at the end of the life, what might lead to thermal runaway
processes.
3.3. Failure mode analysis
In order to determine the failure mode of the gel bat-
teries, prototypes were recharged, torn down and, besides
visual inspection, physical-chemical analyses of active mate-
rials was carried out, as PbO
2
and PbSO
4
contents and
specific surface and porosimetry can provide valuable
information about the different ageing mechanisms during
cycling.
Table 6 summarises the analysis results of gel battery pro-
totypes (Silica Compound A, 6%), tested according different
procedures: the cycle life test at C/3 rate, 17.5% DOD and
50% SOC, the Stop and Start life test (at 2C rate, 2% DOD
and 80% SOC) and a similar battery after only two capacity
tests at the C/20 rate.
In the two cycled batteries, positive electrodes show sim-
ilar sulphate content, comparable to the electrodes of the
non-cycled battery. However, a slight increase in the porosity
(from 51.5 to 62.8%) is observed in the battery cycled at low-
moderate rate (C/3) and PSOC (50% SOC, 17.5% DOD), fact
that leads to a decrease in the active mass efficiency, due to a
loss of contact between particles [19].
Concerning negative plates, both cycled batteries present
higher lead sulphate contents than non-cycled batteries, due
to irreversible sulphation of active materials. Moreover, sul-
phate distribution is quite different in both cases: batteries
tested according to the Stop and Start profile (moderate-high
rate and shallow cycling at high SOC) show the highest sul-
phate concentration in the upper part of the negative plates
J.C. Hern´andez et al. / Journal of Power Sources 162 (2006) 851–863 861
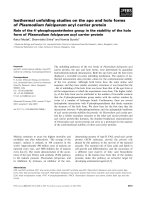
Fig. 10. SEM Micrograph of negative plates from 12 V, 18 Ah batteries filled with 6% Silica Compound A-based electrolyte, after cycling at C/3 rate, 50%
SOC and 17.5% DOD: (a) upper part—inner area, (b) upper part—surface area; (c) bottom part—inner area; (d) bottom part—surface area.
whereas in the batteries aged according to the low-moderate
rate, moderate cycling and lower SOC, the highest concen-
tration of irreversible sulphates is located in the lower part
of the negative electrodes. Moreover, in both cases, the irre-
versible sulphates are accumulated mainly on the surface of
the negative plates [20].
This fact has been confirmed in the morphological analy-
sis carried out with a scanning electron microscope (SEM).
Figs. 10 and 11 show SEM images of the upper and bottom
parts of the negative plates, both of the electrode surface and
of the inner area. In these pictures, it can be observed that, in
both cycling profiles, the larger polyhedral sulphate crystals
are distributed mainly on the surface of the electrodes.
Besides the moderate irreversible sulphation of the nega-
tive plates, significant corrosion of the positive grids was also
observed that limits the electrical conductivity of the positive
plates.
Table 7 shows the analysis results of gel batteries with dif-
ferent electrolyte formulation and battery technologies (resin
separator and AGM separator), tested under moderate depth
of discharge (DOD) and PSOC conditions.
Negative plates from the different groups of batteries show
similar characteristics than those found in gel batteries (Silica
Compound A, 6%) tested according to the same testing profile
and included in Table 6. An important difference is the higher
specific surface of the negative active mass, when a colloidal
silica is used (only resin separator design). This effect has
been checked in more than 12 batteries with a specific surface
increase in the range 22%–370% (170% average) and has
been assigned to the access of the small silica particles into
the active material creating a more open structure.
Concerning the positive plates, a higher sulphate content
is detected in the positive active mass of gel batteries contain-
ing colloidal silica, due to the presence of micro short-circuits
Table 6
Chemical composition, specific surface and porosity of negative and positive plates of VRLA batteries with gel electrolyte (Silica Compound A, 6%) after
different ageing conditions
Electrical test Negative plates Positive plates
PbSO
4
(%) BET (m
2
g
−1
) PbO
2
(%) PbSO
4
(%) Porosity (%) BET (m
2
g
−1
)
Capacity test 3.5 0.52 94.6 <0.3 51.5 2.72
Cycle life test (17.5% DOD) 8.0 (T), 35.9 (B) 0.36 (T), 0.32 (B) 91.9 3.2 62.8 1.39
Cycle life test (Stop and Start) 25.5 (T), 7.6 (B) 0.30 (T), 0.30 (B) 94.8 0.5 55.9 1.69
T: top, upper part of the electrode. B: bottom, lower part of the electrode.
862 J.C. Hern´andez et al. / Journal of Power Sources 162 (2006) 851–863
Fig. 11. SEM Micrograph of negative plates from 12 V, 18 Ah batteries filled with 6% Silica Compound A-based electrolyte, after Stop and Start cycling (2C
rate, 80% SOC and 2% DOD): (a) upper part—inner area; (b) upper part—surface area; (c) bottom part—inner area; (d) bottom part—surface area.
Table 7
Chemical composition, specific surface and porosity of negative and positive plates of VRLA batteries with different gel electrolytes after cycle life test (17.5%
DOD, 50% SOC)
Electrolyte formulation Negative plates Positive plates
PbSO
4
(%) BET (m
2
g
−1
) PbO
2
(%) PbSO
4
(%) Porosity (%) BET (m
2
g
−1
)
1% F (AGM) 12.3 (T), 31.5 (B) 0.33 (T), 0.30 (B) 88.9 5.4 56.2 2.84
3% G (AGM) 47.8 (T), 52.1 (B) 0.36 (T), 0.40 (B) 82.6 13.6 53.8 1.83
6% E 2.1 (T), 10.0 (B) 0.37 (T), 0.37 (B) 94.0 1.4 58.3 2.10
5% D 5.9 (T), 18.6 (B) 0.36 (T), 0.34 (B) 91.9 4.0 57.9 2.03
3% F 9.7 (T), 24.6 (B) 0.49 (T), 0.58 (B) 83.3 12.7 59.5 2.15
6% G 2.5 (T), 18.9 (B) 1.38 (T), 1.38 (B) 88.2 7.2 57.5 3.40
T: top, upper part of the electrode. B: bottom, lower part of the electrode.
generated by lateral plate growth, and the use of leaf separa-
tors. Fumed silica based electrolytes maintain the structure
throughout battery operation whereas colloidal silica based
electrolytes lose the gel strength along cycling. In this way,
the stable solid structure of the fumed silica electrolytes pre-
vents the short-circuit formation and, finally, batteries fail due
to positive grid corrosion.
4. Conclusions
Different gel formulations have been studied from a
kinetic and an electrochemical point of view, for VRLA
batteries for advanced automotive applications. 18 Ah 12 V
batteries have been assembled and filled with those elec-
trolyte formulations that showed the best combination of
gel processing and hardness properties. As expected, ini-
tial battery performance, specially high rate discharges and
cold cranking, is poorer with gel electrolyte when compared
with standard sulphuric acid. However, this effect can be
minimised with some design modifications, such as thinner
electrodes, reduced interplate distance and the use of low
electrical resistance separator materials.
Ageing tests of the batteries were carried out under two dif-
ferent PSOC procedures, one characterised by low-moderate
rate (C/3) and moderate DOD (17.5%) and the other with a
moderate-high rate (2C), shallow DOD (2%) and higher SOC
(80%), the latter simulating battery working conditions in a
J.C. Hern´andez et al. / Journal of Power Sources 162 (2006) 851–863 863
vehicle equipped with Stop and Start function. In both cases
results are quite satisfactory.
Tear-down analysis of batteries after the ageing tests
showed significant corrosion of positive grids as well as mod-
erate sulphation of the negative plates, located mainly on
the bottom part of the plates, in the batteries tested at low-
moderate rate and 17.5% DOD-50% SOC and on the upper
part after the Stop and Start cycling test.
Acknowledgements
This project is being partially funded by the European
Commission, under the Energy, Environment and Sustainable
Development Programme, ENERGIE Contract no. ENK6-
CT-2002-00630.
References
[1] D. Berndt, J. Power Sources 100 (2001) 29–46.
[2] P.T. Moseley, D.A.J. Rand, J. Power Sources 133 (2004) 104–109.
[3] R. Knorr, A. Schwake, M. Soria, H. Garc
´
ıa, M. Reimerink, D. Macerata,
M. Ullrich, Proceeding of the ELEDrive Transportation Conference,
Estoril (Portugal), 2004.
[4] M. Anderman, J. Power Sources 127 (2004) 2–7.
[5] N. Sato, Proceedings of the Third International Advanced Auto-
motive Battery Conference, Nice, June 2003. Session 3A, paper
11.
[6] R. Wagner, in: D.A.J. Rand, P.T. Moseley, J. Garche, C.D. Parker (Eds.),
Valve-regulated Lead-Acid Batteries, Elsevier, Amsterdam, 2004, p.
447.
[7] Improved Energy Supply for the Integrated Starter Generator with Dou-
ble Layer Capacitor and Energy Battery for Cars with 42V (SUPER-
CAR), ENERGIE contract ENK6-CT-2002-00630.
[8] D.W.H. Lambert, P.H.J. Greenwood, M.C. Reed, J. Power Sources 107
(2002) 173–179.
[9] M.L. Soria, J. Valenciano, A. Ojeda, J. Power Sources 136 (2004)
371.
[10] M.L. Soria, J.C. Hern
´
andez, J. Valenciano, A. S
´
anchez, F. Trinidad, J.
Power Sources 144 (2005) 473–485.
[11] M.P. Vinod, A.B. Mandle, S.R. Sainkar, K. Vijayamohanan, J. Appl.
Electrochem. 27 (1997) 462–468.
[12] L. Wu, H.Y. Chen, X. Jiang, J. Power Sources 107 (2002) 162–166.
[13] K. Dash, K. Bose, Bull. Electrochem. 2–4 (1986) 387–390.
[14] M.P. Vinod, K. Vijayamohanan, S.N. Joshi, J. Power Sources 70 (1998)
103–105.
[15] E. Karden. PhD. thesis. RWTH, Aachen, 2001.
[16] M.P. Vinod, K. Vijayamohanan, J. Power Sources 89 (2000) 88–92.
[17] H. Tuphorn, J. Power Sources 40 (1992) 47–61.
[18] H. Tuphorn, J. Power Sources 46 (1993) 361–373.
[19] J.H. Yan, W.S. Li, Q.Y. Zhan, J. Power Sources 133 (2004) 135–140.
[20] L.T. Lam, N.P. Haigh, C.G. Phyland, A.J. Urban, J. Power Sources 133
(2004) 126–134.