Encyclopedia of Finance Part 5 pot
Bạn đang xem bản rút gọn của tài liệu. Xem và tải ngay bản đầy đủ của tài liệu tại đây (590.03 KB, 17 trang )
Chapter 7
TREASURY INFLATION-INDEXED
SECURITIES
QUENTIN C. CHU, The University of Memphis, USA
DEBORAH N. PITTMAN, Rhodes College, USA
Abstract
In January 1997, the U.S. Treasury began to issue
inflation-indexed securities (TIIS). The new Treas-
ury security protects investors from inflation by link-
ing the principal and coupon payments to the
Consumer Price Index (CPI). This paper discusses
the background of issuing TIIS and reviews their
unique characteristics.
Keywords: treasury inflation-indexed securities;
consumer price index; real interest rate; inflation
risk premium; phantom income; reference CPI;
dutch auction; competitive bidders; noncompeti-
tive bidders; bid-to-cover ratio; Series-I bonds.
Eleven issues of Treasury inflation-indexed se-
curities (TIIS) have been traded in the U.S. market
as of December 2003. Inflation-indexed securities
are intended to protect investors from inflation by
preserving purchasing power. By linking value to
the Consumer Price Index (CPI), TIIS provide
investors with a ‘‘real’’ rate of return. This security
can be viewed as one of the safest financial assets
due to its minimal exposure to default risk and
uncertain inflation.
The fundamental notion behind inflation pro-
tection is to preserve the purchasing power of
money. Today, inflation protection may be accom-
plished by linking investment principal to some
form of a price index, such as the Consumer Price
Index (CPI) in the United States, Canada, the
United Kingdom, and Iceland; the Wholesale
Price Index (WPI) in Finland, Brazil, and Argen-
tina; and equities and gold in France.
In essence, investors purchasing inflation-
indexed securities are storing a basket of goods
for future consumption. Fifteen countries, includ-
ing the United States have issued inflation-indexed
securities, starting from the 1940s.
1
Some of the
countries had extremely high inflation, such as
Mexico and Brazil (114.8 percent and 69.2 percent
in the year prior to the introduction of inflation-
indexed securities), and others had moderate infla-
tion like Sweden and New Zealand (4.4 percent
and 2.8 percent).
The United Kingdom. has the largest and oldest
market for inflation-indexed securities. As of 1997,
there were £55 billion index-linked gilts outstand-
ing, constituting about 20 percent of all govern-
ment bonds in the United Kingdom. The United
States is the most recent country to issue inflation-
indexed securities to the public. The treasury an-
nounced its intention to issue inflation-indexed
bonds on May 16, 1996. The first U.S. Treasury
inflation-indexed securities were $7 billion of
10-year notes issued in January 1997.
There are many motivations for the issue of
inflation-indexed securities. First, governments
can reduce public financing costs through reducing
the interest paid on public debt by the amount of
an inflation risk premium. Rates on Treasury
securities are usually taken to represent the nom-
inal risk-free rate, which consists of the real rate
plus expected inflation and an inflation risk pre-
mium. By linking value to the price index, infla-
tion-indexed securities provide investors with a
real rate of interest. This return is guaranteed,
whatever the course of inflation. When there is no
risk of inflation, the inflation risk premium is re-
duced, if not eliminated completely. Benninga and
Protopapadakis (1983) revised the Fisher equation
to incorporate an inflation risk premium.
Second, the issue of inflation-indexed securities is
an indication of a government’s intention to fight
inflation. A government can keep inflation low
through its fiscal and monetary policies. According
to the Employment Act of 1946, one of the four
primary goals of the U.S. federal government is to
stabilize prices through a low-inflation rate.
Inflation-indexed securities provide a way for the
public to evaluate the government’s performance in
controlling inflation. For a constant level of
expected inflation, the wider the yield spread
between nominal and real bonds, the higher
the inflation risk premium, and presumably lower
the public’s confidence in the monetary authorities.
Moreover, a government promises investors a
real rate of return through the issue of inflation-
indexed securities. Any loss of purchasing power
due to inflation, which investors experience during
the investment period, will be offset by inflation-
adjusted coupon payments and principal. In an
environment with high inflation, the government’s
borrowing costs will be high. Reducing borrowing
costs provides an incentive for a government to
control inflation. The willingness of the govern-
ment to bear this risk shows its determination to
fight inflation.
Inflation-indexed securities also provide a dir-
ect measure of expected real interest rates that
may help policymakers make economic decisions.
According to economic theory, most savings, con-
sumption, and investment decisions depend criti-
cally on the expected real rate of interest,
the interest rate one earns after adjusting the
nominal interest rate for the expected rate of in-
flation. Real interest rates measure the real
growth rate of the economy and the supply and
demand for capital in the market.
Before the trading of inflation-indexed secur-
ities, there was no security in the United States,
which was offering coupon and principal payments
linked to inflation, and therefore enabling meas-
urement of the expected real rate. Empirical studies
testing the relationship between expected real rates
and other macroeconomic variables have relied
instead on indirect measures of the expected real
rate such as ex post real rates estimated by sub-
tracting actual inflation from realized nominal
holding-period returns (Pennachi, 1991). Infla-
tion-indexed securities permit the direct study of
the real interest rate. Wilcox (1998) includes this as
one benefit, which has motivated the Treasury to
issue these new securities.
Finally, inflation-indexed securities offer an al-
ternative financial vehicle for portfolio manage-
ment. Since the returns on nominal bonds are
fixed in nominal terms, they provide no hedge
against uncertain inflation. Kaul (1987) and Chu
et al. (1995) have documented a negative correl-
ation between equity returns and inflation in the
United Kingdom as in the case of investors in
equity markets, who suffer during periods of un-
expected high inflation. Inflation-indexed secur-
ities, by linking returns to the movement of a
price index, provide a hedge for investors who
have a low-risk tolerance for unexpected inflation.
Investors most averse to inflation will purchase
inflation-indexed securities, and those less sensitive
to inflation will purchase the riskier nominal
bonds.
The design of the U.S. inflation-indexed secur-
ities underwent considerable discussion in deter-
mining the linking price index, the cash flow
structure, the optimal length of maturity, the auc-
tion mechanism, and the amount of issuance. TIIS
are auctioned through the Dutch auction method
used by other Treasury securities. Participants
submit bids in terms of real yields. The highest
accepted yield is used to price the newly issued
TIIS for all participants (Roll, 1996).
360 ENCYCLOPEDIA OF FINANCE
Both principal and coupon payments of TIIS
are linked to the monthly nonseasonally adjusted
U.S. City Average-All Items Consumer Price Index
for All Urban Consumers (CPI-U). The Bureau of
Labor Statistics compiles and publishes the CPI
independently of the Treasury. The CPI-U is an-
nounced monthly. Inflation-indexed securities pro-
vide a guarantee to investors that at maturity
investors will receive the inflation-adjusted amount
or the par value whichever is greater. The coupon
payments and the lump-sum payment at maturity
are adjusted according to inflation rates. With a
fixed coupon rate, the adjustment to a nominal
coupon payment is accomplished by multiplying
the principal value by one plus the inflation rate
between the issuance date and the coupon payment
date. Inflation-indexed securities set a floor (par
value), an implicit put option, guaranteeing the
bond’s value will not fall below its face value if
the United States experiences cumulative deflation
during the entire life of the TIIS, which is a highly
unlikely event.
TIIS are eligible for stripping into their principal
and interest components in the Treasury’s Separate
Trading of Registered Interest and Principal of
Securities Program. Since March 1999, the U.S.
Treasury Department has allowed all TIIS interest
components with the same maturity date to be
interchangeable (fungible). Fungibility is designed
to improve the liquidity of stripped interest com-
ponents of TIIS, and hence increase demand for
the underlying inflation-indexed securities. Other
Treasury securities are strippable as well.
Since first issue in 1997, TIIS have constituted
only a small portion of total Treasury securities
issuance. At the end of 2002, the market capitaliza-
tion of the TIIS was $140 billion, while the total
Treasury market capitalization was $3.1 trillion.
There are only 11 issues of TIIS outstanding, with
original maturities running from 5 to 30 years. The
issuance of TIIS was increased from two to three
auctions of 10-year TIIS per year, along with a
statement from the U.S. Treasury that they actively
intend to promote trading in the 10-year note. Lim-
ited issuance prevents full coverage for various in-
vestment horizons and constrains trading volume in
the new security. TIIS have not been closely fol-
lowed by financial analysts, nor well understood
by the investment public.
Since the inception of the TIIS in 1997, actual
inflation has been very low by historical standards,
and there has not been strong interest in hedging
against inflation. Although the Federal Reserve
remains concerned about potential inflation, higher
inflation levels have not materialized. In more re-
cent years, the government has been retiring Treas-
ury debt due to government surpluses, which makes
significant new issues of TIIS less likely.
One disadvantage of TIIS is the potential for tax
liability on phantom income. Although the secur-
ities are exempt from state and local taxes, they are
subject to federal taxation. Positive accrued infla-
tion compensation, if any, is reportable income,
even though the inflation-adjusted principal will
not be received until maturity. Some taxable inves-
tors may thus hesitate to invest in TIIS, while
others with nontaxable accounts such as retirement
accounts might find this market attractive. Conse-
quently, investor tax brackets may affect decisions
about including TIIS in a portfolio. The emergence
of pension funds specializing in TIIS should attract
more individual investment in the form of IRA and
401(k) savings, although these investors are more
likely to buy and hold.
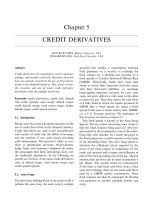
One feature of the TIIS that impedes its use as a
perfect measure of the ex ante real rate is the CPI
indexing procedure. There is a three-month lag in
the CPI indexing system for TIIS. Figure 7.1 indi-
cates how the reference CPI is calculated on May
15, 2000. The reference CPI for May 1, 2000, is the
CPI-U for the third-previous calendar month, i.e.
the announced CPI for February 2000. The Bureau
of Labor Statistics surveys price information for
the February CPI between January 15 and Febru-
ary 15, and then announces the February CPI on
March 17, 2000. The reference CPI for any other
day of May is calculated by linear interpolation
between the CPIs of February and March (the
CPI for March becomes available on April 14,
2000). Once the March CPI is announced, the
TREASURY INFLATION-INDEXED SECURITIES 361
reference CPI for any day in May 2000 is known.
The reference CPI for May 15, 2000 can be calcu-
lated according to the following formula:
RCPI
May15
¼ CPI
Feb
þ (14=31) CPI
March
À CPI
Feb
ðÞ
¼ 169:7 þ (14=31)(171:1 À169:7)
¼ 170:33226,
where RCPI represents the reference CPI for a
particular day.
2
The principal value of TIIS on any particular
day is determined by multiplying the face value at
the issuance by an applicable index ratio. The
index ratio is defined as the reference CPI applic-
able to the calculation date divided by the refer-
ence CPI applicable to the original issuing date.
Table 7.1 shows the percentage holdings of TIIS
for competitive bidders, noncompetitive bidders,
the Federal Reserve, and foreign official institu-
tions. The total dollar amount tendered by com-
petitive bidders is 2.24 times the total dollar
amount accepted. The bid-to-cover ratio of 2.24
indicates the intensity of demand for the TIIS.
The first TIIS was issued in January 1997, which
offered a real coupon rate of 3.375 percent and
10 years to maturity. The first maturity of TIIS
occurred on July 15, 2002. There are eight 10-year
TIIS and three 30-year TIIS currently outstanding.
Maturities range from 2007 to 2032. Ten-year TIIS
original issuances are scheduled in July each year,
with a reopening in October and the following
January. Each issue has a unique CUSIP number
for identification purposes, which is also used in the
case of reopening. All 11 issues have been reopened
at least once after the original issue date.
The average annual return on the 10-year
TIIS, since inception in 1997, was 7.5 percent, com-
pared to a return on the 10-year nominal Treasury
of 8.9 percent. The comparable annual volatility
has been 6.1 percent for the TIIS compared to
8.2 percent for the Treasury. Issue size varies
from $5 billion to $8 billion. For all 11 issues, the
amounts tendered by the public have been consist-
ently higher than offering amounts. The average
daily trading volume of the TIIS was $ 2 billion,
compared to $300 billion for the Treasury market.
Jan.
Feb.
March
April May June
Survey Period
Feb. CPI announced on
March 17, 2000
March CPI announced
on April 14, 2000
Feb. CPI linked
to May 1, 2000
March CPI linked
to June 1, 2000
Figure 7.1. Calculation of reference CPI. This figure illustrates the lag effect in indexing the CPI. Due to CPI-U
reporting procedures, the reference CPI for May 1, 2000, is linked to the February CPI-U, and the reference CPI for
June 1, 2000, is linked to the March CPI-U.
Table 7.1. TIIS distribution among investment
groupsThe numbers in this table represent auction
results of TIIS between October 1998 and July 2001.
Information on new issuance and reopening are
summarized for the 11 auctions held during this period
of time. Amounts are in millions of dollars.
Tendered Accepted
Competitive 153,446 98.13 68,410 95.90
Noncompetitive 601 0.38 601 0.84
Federal Reserve 2,202 1.41 2,202 3.09
Foreign Official
Institutions
125 0.08 125 0.18
Total 156,374 100.00
a
71,338 100.00
a, b
a
Numbers are in percentage.
b
Does not add to 100.00 percent because of rounding.
362 ENCYCLOPEDIA OF FINANCE
The U.S. Treasury also issues Series-I Bonds,
usually called I-Bonds, whose values are linked to
the CPI as well. Unlike TIIS, I-Bonds are designed
to target individual investors. The motivation for
such a security is to encourage public savings.
Investors pay the face value of I-Bonds at the
time of purchase. The return on I-Bonds consists
of two separate parts: a fixed rate of return, and a
variable inflation rate. As inflation rates evolve
over time, the value of I-Bonds also varies. Values
will be adjusted monthly, while interest is com-
pounded every six months. Interest payments are
paid when the bond is cashed. As in the TIIS, there
is an implicit put option impounded in I-Bonds
that protects investors from deflation.
There are differences between I-Bonds and TIIS.
First, I-Bonds are designed for individual investors
with long-term commitments. Although investors
can cash an I-Bond any time 6 months after issu-
ance, there is a 3-month interest penalty if the bond
is cashed within the first 5 years. TIIS, on the other
hand, can be traded freely without penalty.
The real rates of return on I-Bonds and TIIS are
different. The Treasury announces the fixed rates
on I-Bonds every 6 months, along with the rate of
inflation. Both the fixed rate and the inflation rate
remain effective for only 6 months until the next
announcement date. The real coupon rate on a
TIIS, however, is determined through an auction
mechanism involving all market participants on the
original issue date. TIIS principal is linked to the
daily reference CPI, and its value can be adjusted
daily instead of monthly as in the case of I-Bonds.
The tax treatment of I-Bonds and TIIS is also
different. While there is phantom income tax on
TIIS, federal income taxes can be deferred for up
to 30 years for I-Bonds. If there is early redemp-
tion, taxes are levied at the time I-Bonds are
cashed. Investors can purchase I-Bonds through
retirement accounts, but there is a limit on the
amount one can purchase. An investor can pur-
chase up to $30,000 worth of I-Bonds each calen-
dar year, a limit that is not affected by the purchase
of other bond series.
NOTES
1. According to the date of introduction of inflation-in-
dexed securities, these countries are Finland, France,
Sweden, Israel, Iceland, Brazil, Chile, Colombia,
Argentina, the United Kingdom, Australia, Mexico,
Canada,NewZealand,andtheUnitedStates.
2. The U.S. Treasury posts the reference CPI for the
following month around the 15th of each month on
its web site at http:==www.publicdebt.treas.gov.
REFERENCES
Benninga, S. and Protopapadakis, A. (1983). ‘‘Nominal
and real interest rates under uncertainty: The Fisher
theorem and the term structure.’’ The Journal of
Political Economy, 91(5):856–867.
Chu, Q.C., Lee, C. F., and Pittman, D.N. (1995). ‘‘On
the inflation risk premium.’’ Journal of Business,
Finance, and Accounting, 22(6):881–892.
Kaul, G. (1987). ‘‘Stock returns and inflation: The role
of the monetary sector.’’ Journal of Financial Eco-
nomics, 18(2): 253–276.
Pennachi, G. G. (1991). ‘‘Identifying the dynamics of
real interest rates and inflation: Evidence using sur-
vey data.’’ Review of Financial Studies, 4(1):53–86.
Roll, R. (1996). ‘‘U.S. Treasury inflation-indexed
bonds: The design of a new security.’’ The Journal
of Fixed Income 6(3):9–28.
Wilcox, D. W. (1998). ‘‘The introduction of indexed
government debt in the United States.’’ The Journal
of Economic Perspectives, 12(1):219–227.
TREASURY INFLATION-INDEXED SECURITIES 363
Chapter 8
ASSET PRICING MODELS
WAYNE E. FERSON, Boston College, USA
Abstract
The asset pricing models of financial economics de-
scribe the prices and expected rates of return of
securities based on arbitrage or equilibrium theories.
These models are reviewed from an empirical per-
spective, emphasizing the relationships among the
various models.
Keywords: financial assets; arbitrage; portfolio op-
timization; stochastic discount factor; beta pricing
model; intertemporal marginal rate of substitution;
systematic risk; Capital Asset Pricing Model; con-
sumption; risk aversion; habit persistence; durable
goods; mean variance efficiency; factor models;
arbitrage pricing model
Asset pricing models describe the prices or
expected rates of return of financial assets, which
are claims traded in financial markets. Examples of
financial assets are common stocks, bonds, op-
tions, and futures contracts. The asset pricing
models of financial economics are based on two
central concepts. The first is the ‘‘no arbitrage
principle,’’ which states that market forces tend
to align the prices of financial assets so as to elim-
inate arbitrage opportunities. An arbitrage oppor-
tunity arises if assets can be combined in a
portfolio with zero cost, no chance of a loss, and
a positive probability of gain. Arbitrage opportun-
ities tend to be eliminated in financial markets
because prices adjust as investors attempt to trade
to exploit the arbitrage opportunity. For example,
if there is an arbitrage opportunity because the
price of security A is too low, then traders’ efforts
to purchase security A will tend to drive up its
price, which will tend to eliminate the arbitrage
opportunity. The arbitrage pricing model (APT),
(Ross, 1976) is a well-known asset pricing model
based on arbitrage principles.
The second central concept in asset pricing is
‘‘financial market equilibrium.’’ Investors’ desired
holdings of financial assets are derived from an
optimization problem. A necessary condition for
financial market equilibrium in a market with no
frictions is that the first-order conditions of the
investor’s optimization problem are satisfied. This
requires that investors are indifferent at the margin
to small changes in their asset holdings. Equilib-
rium asset pricing models follow from the first-
order conditions for the investors’ portfolio choice
problem, and a market-clearing condition. The
market-clearing condition states that the aggregate
of investors’ desired asset holdings must equal
the aggregate ‘‘market portfolio’’ of securities in
supply.
Differences among the various asset pricing
models arise from differences in their assumptions
about investors’ preferences, endowments, produc-
tion and information sets, the process governing the
arrival ofnewsinthe financialmarkets,and the types
of frictions in the markets. Recently, models have
been developed that emphasize the role of human
imperfections in this process. For a review of this
‘‘behavioral finance’’ perspective, see Barberis
and Shleifer (2003).
Virtually all asset pricing models are special
cases of the fundamental equation:
P
t
¼ E
t
{m
tþ1
(P
tþ1
þ D
tþ1
)}, (8:1)
where P
t
is the price of the asset at time t and D
tþ1
is
the amount of any dividends, interest or other pay-
ments received at time t þ 1. The market wide ran-
dom variable m
tþ1
is the ‘‘stochastic discount
factor’’ (SDF). By recursive substitution in Equa-
tion (8.1), the future price may be eliminated to
express the current price as a function of the future
cash flows and SDFs only: P
t
¼ E
t
{S
j>0
(P
k¼1
, ,
j
m
tþk
)D
tþj
}. Prices are obtained by ‘‘discounting’’
the payoffs, or multiplying by SDFs, so that the
expected ‘‘present value’’ of the payoff is equal to
the price.
We say that a SDF ‘‘prices’’ the assets if Equa-
tion (8.1) is satisfied. Any particular asset pricing
model may be viewed simply as a specification for
the stochastic discount factor. The random vari-
able m
tþ1
is also known as the benchmark pricing
variable, equivalent martingale measure, Radon–
Nicodym derivative, or intertemporal marginal
rate of substitution, depending on the context.
The representation in Equation (8.1) goes at least
back to Beja (1971), while the term ‘‘stochastic
discount factor’’ is usually ascribed to Hansen
and Richard (1987).
Assuming nonzero prices, Equation (8.1) is
equivalent to:
E
t
(m
tþ1
R
tþ1
À 1) ¼ 0, (8:2)
where R
tþ1
is the vector of primitive asset gross
returns and 1 is an N-vector of ones. The gross
return R
i,tþ1
is defined as (P
i,tþ1
þ D
i,tþ1
)=P
i,t
,
where P
i,t
is the price of the asset i at time t and
D
i,tþ1
is the payment received at time t þ 1. Em-
pirical tests of asset pricing models often work
directly with asset returns in Equation (8.2) and
the relevant definition of m
tþ1
.
Without more structure the Equations (8.1,8.2)
have no content, because it is always possible to
find a random variable m
tþ1
for which the equa-
tions hold. There will be some m
tþ1
that ‘‘works,’’
in this sense, as long as there are no redundant
asset returns. For example, take a sample of asset
gross returns with a nonsingular covariance matrix
and let m
tþ1
be :[1
0
(E
t
{R
tþ1
R
tþ1
0
}) À1]R
tþ1
Substi-
tution in to Equation (8.2) shows that this SDF
will always ‘‘work’’ in any sample of returns. The
ability to construct an SDF as a function of the
returns that prices all of the included assets, is
essentially equivalent to the ability to construct a
minimum-variance efficient portfolio and use in as
the ‘‘factor’’ in a beta pricing model, as described
below.
With the restriction that m
tþ1
is a strictly posi-
tive random variable, Equation (8.1) becomes
equivalent to the no arbitrage principle, which
says that all portfolios of assets with payoffs that
can never be negative but are positive with positive
probability, must have positive prices (Beja, 1971;
Rubinstein, 1976; Ross, 1977; Harrison and Kreps,
1979; Hansen and Richard, 1987.)
While the no arbitrage principle places restric-
tions on m
tþ1
, empirical work more typically ex-
plores the implications of equilibrium models for
the SDF based on investor optimization. A repre-
sentative consumer–investor’s optimization implies
the Bellman equation:
J(W
t
,s
t
) max E
t
{U(C
t
,:) þJ(W
tþ1
,s
tþ1
)}, (8:3)
where U(C
t
,:) is the utility of consumption expend-
itures at time t , and J(.) is the indirect utility of
wealth. The notation allows that the direct utility
of current consumption expenditures may depend
on other variables such as past consumption ex-
penditures or the current state variables. The state
variables, s
tþ1
, are sufficient statistics, given
wealth, for the utility of future wealth in an opti-
mal consumption–investment plan. Thus, the state
variables represent future consumption–invest-
ment opportunity risk. The budget constraint is:
W
tþ1
¼ (Wt À C
t
)x
0
R
tþ1
, where x is the portfolio
weight vector, subject to x
0
1 ¼ 1.
If the allocation of resources to consumption
and investment assets is optimal, it is not possible
to obtain higher utility by changing the allocation.
Suppose an investor considers reducing consump-
tion at time t to purchase more of (any) asset. The
ASSET PRICING MODELS 365
expected utility cost at time t of the foregone con-
sumption is the expected product of the marginal
utility of consumption expenditures, Uc(C
t
,:) > 0
(where a subscript denotes partial derivative),
multiplied by the price of the asset, and which is
measured in the same units as the consumption
expenditures. The expected utility gain of selling
the investment asset and consuming the proceeds
at time t þ1isE
t
{(P
i,tþ1
þ D
i,tþ1
) J
w
(W
tþ1
,s
tþ1
)}.
If the allocation maximizes expected utility,
the following must hold: P
i,t
E
t
{U
c
(C
t
,:)}
¼ E
t
{(P
i,tþ1
þD
i,tþ1
) J
w
(W
tþ1
,s
tþ1
)} which is equ-
valent to Equation (8.1), with
m
tþ1
¼
J
w
(W
tþ1
,s
tþ1
)
E
t
{U
c
(C
t
,:)}
: (8:4)
The m
tþ1
in Equation (8.4) is the ‘‘intertemporal
marginal rate of substitution’’ (IMRS) of the con-
sumer–investor.
Asset pricing models typically focus on the rela-
tion of security returns to aggregate quantities. It is
therefore necessary to aggregate the first-order
conditions of individuals to obtain equilibrium ex-
pressions in terms of aggregate quantities. Then,
Equation (8.4) may be considered to hold for a
representative investor who holds all the securities
and consumes the aggregate quantities. Theoretical
conditions that justify the use of aggregate quan-
tities are discussed by Gorman (1953), Wilson
(1968), Rubinstein (1974), and Constantinides
(1982), among others. When these conditions fail,
investors’ heterogeneity will affect the form of the
asset pricing relation. The effects of heterogeneity
are examined by Lintner (1965), Brennan and
Kraus (1978), Lee et al. (1990), Constantinides
and Duffie (1996), and Sarkissian (2003), among
others.
Typically, empirical work in asset pricing fo-
cuses on expressions for expected returns and ex-
cess rates of return. The expected excess returns are
modeled in relation to the risk factors that create
variation in m
tþ1
. Consider any asset return R
i,tþ1
and a reference asset return, R
0,tþ1
. Define the
excess return of asset i, relative to the reference
asset as r
i,tþ1
¼ R
i,tþ1
À R
0,tþ1
. If Equation (8.2)
holds for both assets it implies:
E
t
{m
tþ1
r
i,tþ1
} ¼ 0 for all i: (8:5)
Use the definition of covariance to expand
Equation (8.5) into the product of expectations
plus the covariance, obtaining:
E
t
{r
i,tþ1
} ¼
Cov
t
(r
i,tþ1
; Àm
tþ1
)
E
t
{m
tþ1
}
, for all i, (8:6)
where Cov
t
(:;:) is the conditional covariance.
Equation (8.6) is a general expression for the
expected excess return from which most of the
expressions in the literature can be derived.
Equation (8.6) implies that the covariance of
return with m
tþ1
, is a general measure of ‘‘system-
atic risk.’’ This risk is systematic in the sense that
any fluctuations in the asset return that are uncor-
related with fluctuations in the SDF are not
‘‘priced,’’ meaning that these fluctuations do not
command a risk premium. For example, in the
conditional regression r
itþ1
¼ a
it
þ b
it
m
tþ1
þ u
itþ1
,
then Cov
t
(u
itþ1
, m
tþ1
) ¼ 0. Only the part of the
variance in a risky asset return that is correlated
with the SDF is priced as risk.
Equation (8.6) displays that a security will earn
a positive risk premium if its return is negatively
correlated with the SDF. When the SDF is an
aggregate IMRS, negative correlation means that
the asset is likely to return more than expected
when the marginal utility in the future period is
low, and less than expected when the marginal
utility and the value of the payoffs, is high. For a
given expected payoff, the more negative the cov-
ariance of the asset’s payoffs with the IMRS, the
less desirable the distribution of the random re-
turn, the lower the value of the asset and the larger
the expected compensation for holding the asset
given the lower price.
8.1. The Capital Asset Pricing Model
One of the first equilibrium asset pricing models
was the Capital Asset Pricing Model (CAPM),
366 ENCYCLOPEDIA OF FINANCE
developed by Sharpe (1964), Lintner (1965), and
Mossin (1966). The CAPM remains one of the
foundations of financial economics, and a huge
number of theoretical papers refine the assump-
tions and provide derivations of the CAPM. The
CAPM states that expected asset returns are given
by a linear function of the assets’ ‘‘betas,’’ which
are their regression coefficients against the market
portfolio. Let R
mt
denote the gross return for the
market portfolio of all assets in the economy.
Then, according to the CAPM,
E(R
itþ1
) ¼ d
0
þ d
1
b
i
,(8:7)
where b
i
¼ Cov(R
i
, R
m
)=Var(R
m
):
In Equation (8.7), d
0
¼ E(R
0tþ1
), where the
return R
0tþ1
is referred to as a ‘‘zero-beta asset’’
to R
mtþ1
because the condition Cov(R
0tþ1
,
R
mtþ1
) ¼ 0.
To derive the CAPM, it is simplest to assume
that the investor’s objective function in Equa-
tion (8.3) is quadratic, so that J(W
tþ1
, S
tþ1
) ¼
V{E
t
(R
ptþ1
), Var
t
(R
ptþ1
)} where R
ptþ1
is the inves-
tor’s optimal portfolio. The function V(.,.) is
increasing in its first argument and decreasing in
the second if investors are risk averse. In this case,
the SDF of Equation (8.4) specializes as: m
tþ1
¼ a
t
þ b
t
R
ptþ1
. In equilibrium, the representative
agent must hold the market portfolio, so
R
ptþ1
¼ R
mtþ1
. Equation (8.7) then follows from
Equation (8.6), with this substitution.
8.2. Consumption-based Asset Pricing Models
Consumption models may be derived from Equa-
tion (8.4) by exploiting the envelope condition,
U
c
(:) ¼ J
w
(:), which states that the marginal utility
of current consumption must be equal to the mar-
ginal utility of current wealth, if the consumer has
optimized the tradeoff between the amount con-
sumed and the amount invested.
Breeden (1979) derived a consumption-based
asset pricing model in continuous time, assuming
that the preferences are time-additive. The utility
function for the lifetime stream of consumption is
S
t
b
t
U(C
t
), where b is a time preference parameter
and U(.) is increasing and concave in current con-
sumption, C
t
. Breeden’s model is a linearization
of Equation (8.1), which follows from the assump-
tion that asset values and consumption follow
diffusion processes (Bhattacharya, 1981; Gross-
man and Shiller, 1982). A discrete-time version
follows Lucas (1978), assuming a power utility
function:
U(C) ¼ [C
1Àa
À 1]=(1 À a), (8:8)
where a > 0 is the concavity parameter of the period
utility function. This function displays constant
relative risk aversion equal to a. ‘‘Relative risk aver-
sion’’ in consumption is defined as: Cu
00
(C)=u
0
(C).
Absolute risk aversion is defined as: u
00
(C)=u
0
(C).
Ferson (1983) studied a consumption-based asset
pricing model with constant absolute risk aversion.
Using Equation (8.8) and the envelope condi-
tion, the IMRS in Equation (8.4) becomes:
m
tþ1
¼ b(C
tþ1
=C
t
)
Àa
: (8:9)
A large body of literature in the 1980s tested the
pricing Equation (8.1) with the SDF given by the
consumption model (Equation (8.9)). See, for ex-
ample, Hansen and Singleton (1982, 1983), Ferson
(1983), and Ferson and Merrick (1987).
More recent work generalizes the consumption-
based model to allow for ‘‘nonseparabilities’’ in the
U
c
(C
t
,:) function in Equation (8.4), as may be
implied by the durability of consumer goods,
habit persistence in the preferences for consump-
tion, nonseparability of preferences across states of
nature, and other refinements. Singleton (1990),
Ferson (1995), and Cochrane (2001) review this
literature; Sarkissian (2003) provides a recent em-
pirical example with references. The rest of this
section provides a brief historical overview of
empirical work on nonseparable-consumption
models.
Dunn and Singleton (1986) and Eichenbaum
et al. (1988) developed consumption models with
durable goods. Durability introduces nonsepar-
ability over time, since the actual consumption at
a given date depends on the consumer’s previous
expenditures. The consumer optimizes over the
ASSET PRICING MODELS 367
current expenditures C
t
, accounting for the fact
that durable goods purchased today increase con-
sumption at future dates, and thereby lower future
marginal utilities. Thus, U
c
(C
t
,:) in Equation (8.4)
depends on expenditures prior to date t.
Another form of time nonseparability arises if
the utility function exhibits ‘‘habit persistence.’’
Habit persistence means that consumption at two
points in time are complements. For example, the
utility of current consumption may be evaluated
relative to what was consumed in the past, so the
previous standard of living influences the utility
derived from current consumption. Such models
are derived by Ryder and Heal (1973), Becker
and Murphy (1988), Sundaresan (1989), Constan-
tinides (1990), and Campbell and Cochrane (1999),
among others.
Ferson and Constantinides (1991) model both
durability and habit persistence in consumption
expenditures. They show that the two combine as
opposing effects. In an example based on the utility
function of Equation (8.8), and where the ‘‘mem-
ory’’ is truncated at a single-lag, the derived utility
of expenditures is:
U(C
t
,:) ¼ (1 À a)
À1
S
t
b
t
(C
t
þ bC
tÀ1
)
1Àa
,(8:10)
where the coefficient b is positive and measures the
rate of depreciation if the good is durable and there
is no habit persistence. Habit persistence implies
that the lagged expenditures enter with a negative
effect (b < 0). Empirical evidence on similar habit
models is provided by Heaton (1993) and Braun
et al. (1993), who find evidence for habit in inter-
national consumption and returns data.
Consumption expenditure data are highly sea-
sonal, and Ferson and Harvey (1992) argue that
the Commerce Department’s X-11 seasonal adjust-
ment program may induce spurious time series
behavior in the seasonally adjusted consumption
data that most empirical studies have used.
Using data that are not adjusted, they find strong
evidence for a seasonal habit model.
Abel (1990) studied a form of habit persistence
in which the consumer evaluates current consump-
tion relative to the aggregate consumption in the
previous period, and which the consumer takes as
exogenous. The idea is that people care about
‘‘keeping up with the Joneses.’’ Campbell and
Cochrane (1999) developed another model in
which the habit stock is taken as exogenous (or
‘‘external’’) by the consumer. The habit stock in
this case is modeled as a highly persistent weighted
average of past aggregate consumptions. This ap-
proach results in a simpler and more tractable
model, since the consumer’s optimization does
not have to take account of the effects of current
decisions on the future habit stock In addition, by
modeling the habit stock as an exogenous time
series process, Campbell and Cochranes’ model
provides more degrees of freedom to match asset
market data.
Epstein and Zin (1989, 1991) consider a class of
recursive preferences that can be written as:
J
t
¼ F(C
t
, CEQ
t
(J
tþ1
)). CEQ
t
(:) is a time t ‘‘cer-
tainty equivalent’’ for the future lifetime utility
J
tþ1
. The function F(:, CEQ
t
(:)) generalizes the
usual expected utility function and may be
nontime-separable. They derive a special case of
the recursive preference model in which the prefer-
ences are:
J
t
¼ (1 À b)C
p
t
þ b E
t
(J
1Àa
tþ1
)
p=(1Àa)
hi
1=p
: (8:11)
They show that the IMRS for a representative
agent becomes (when p 6¼ 0, 1 À a 6¼ 0):
m
tþ1
¼ [ b (C
tþ1
=C
t
)
pÀ1
]
(1Àa)=p
{R
m,tþ1
}
((1ÀaÀp)=p)
:
(8:12)
The coefficient of relative risk aversion for time-
less consumption gambles is a and the elasticity of
substitution for deterministic consumption is
(1 Àp)
À1
.Ifa ¼ 1 À p, the model reduces to the
time-separable power utility model. If a ¼ 1, the
log utility model of Rubinstein (1976) is obtained.
Campbell (1993) shows that the Epstein–Zin model
can be transformed to an empirically tractable
model without consumption data. He used a line-
arization of the budget constraint that makes it
368 ENCYCLOPEDIA OF FINANCE
possible to substitute for consumption in terms of
the factors that drive the optimal consumption
function. Expected asset returns are then deter-
mined by their covariances with the underlying
factors.
8.3. Multi-Beta Asset Pricing Models
Beta pricing models are a class of asset pricing
models that imply the expected returns of securities
are related to their sensitivity to changes in the
underlying factors that measure the state of the
economy. Sensitivity is measured by the securities’
‘‘beta’’ coefficients. For each of the relevant state
variables, there is a market-wide price of beta
measured in the form of an increment to the
expected return (a ‘‘risk premium’’) per unit of
beta.
The CAPM represented in Equation (8.7) is the
premier example of a single-beta pricing model.
Multiple-beta models were developed in continu-
ous time by Merton (1973), Breeden (1979), and
Cox et al. (1985). Long (1974), Sharpe (1977),
Cragg and Malkiel (1982) and Connor (1984).
Dybvig (1983), Grinblatt and Titman (1983), and
Shanken (1987) provide multi-beta interpretations
of equilibrium models in discrete time. Multiple-
beta models follow when m
tþ1
can be written as a
function of several factors. Equation (8.3) suggests
that likely candidates for the factors are variables
that proxy for consumer wealth, consumption ex-
penditures, or the state variables – the sufficient
statistics for the marginal utility of future
wealth in an optimal consumption–investment
plan. A multi-beta model asserts that the expected
return is a linear function of several betas, i.e.
E(R
itþ1
) ¼ d
0
þ Æ
j¼1, , K
b
ij
d
j
,(8:13)
where the b
ij
, j ¼ 1, , K, are the multiple regres-
sion coefficients of the return of asset i on K econ-
omy-wide risk factors, f
j
, j ¼ 1, , K. The
coefficient d
0
is the expected return on an asset
that has b
0j
¼ 0, for j ¼ 1, , K, i.e. it is the
expected return on a zero-(multiple) beta asset. If
there is a risk-free asset, then d
0
is the return for
this asset. The coefficient d
k
, corresponding to
the k’th factor has the following interpretation: it
is the expected return differential, or premium, for
a portfolio that has b
ik
¼ 1 and b
ij
¼ 0 for all
j 6¼ k, measured in excess of the zero-beta asset’s
expected return. In other words, it is the expected
return premium per unit of beta risk for the risk
factor, k.
A multi-beta model, under certain assumptions,
is equivalent to the SDF representation of Equa-
tion (8.2). This equivalence was first discussed, for
the case of the CAPM, by Dybvig and Ingersoll
(1982). The general multifactor case is derived by
Ferson (1995) and Ferson and Jagannathan (1996),
who show that the multi-beta expected return
model of Equation (8.13) is equivalent to Equation
(8.2), when the SDF is linear in the factors:
m
tþ1
¼ a
t
þ S
j
b
jt
f
jtþ1
.
The logic of the equivalence between multi-beta
pricing and the SDF representation of asset pricing
models is easily seen using a regression example.
Consider a regression of asset returns onto the
factors, f
j
of the multi-beta model. The regression
model is R
itþ1
¼ a
i
þ S
j
b
ijt
f
jt
þ u
itþ1
. Substitute
the regression equation into the right hand side of
Equation (8.6) and assume that Cov
t
(u
i,tþ1
, m
tþ1
)
¼ 0. The result is:
E
t
(R
itþ1
) ¼ d
0t
þ Æ
j¼1
,
K
b
ijt
[Cov
t
{ f
jtþ1
, À m
tþ1
}=E
t
(m
tþ1
)],
(8:14)
which is a version of the multi-beta Equation
(8.13). The market-wide risk premium for factor j
is d
jt
¼ [Cov
t
{ f
jtþ1
, Àm
tþ1
}=E
t
(m
tþ1
)]. In the
special case where the factor f
jtþ1
is a traded
asset return, Equation (8.14) implies that
d
jt
¼ E
t
( f
j,tþ1
) Àd
0t
; the expected risk premium
equals the factor portfolio’s expected excess return.
Equation (8.14) is useful because it provides
intuition about the signs and magnitudes of
expected risk premiums for particular factors.
The intuition is essentially the same as in Equation
(8.6). If a risk factor f
jtþ1
is negatively correlated
with m
tþ1
, the model implies that a positive risk
ASSET PRICING MODELS 369
premium is associated with that factor beta. A
factor that is negatively related to marginal utility
should carry a positive premium, because the big
payoffs disappointingly come when the value of
payoffs is low. This implies a low present value,
and thus a high expected return. With a positive
covariance the opposite occurs. If the factor is high
when payoffs are highly valued, assets with a posi-
tive beta on the factor have a payoff distribution
that is ‘‘better’’ than risk free. Thus, the expected
return premium is negative, and such assets can
have expected returns below that of a risk-free
asset.
8.4. Relation to Mean–Variance Efficiency
The concept of a ‘‘minimum-variance portfolio’’ is
central in the asset pricing literature. A portfolio
R
ptþ1
is minimum variance if and only if no port-
folio with the same expected return has a smaller
variance. Roll (1977) and others have shown that a
portfolio is minimum variance if and only if a
single-beta pricing model holds, using the portfolio
as the risk factor.
1
According to the CAPM, the
market portfolio with return R
mtþ1
is minimum
variance. If investors are risk averse, the CAPM
also implies that R
mtþ1
is on the positively sloped
portion of the minimum-variance frontier, or
‘‘mean–variance efficient.’’ This implies that the
coefficient d
1
in Equation (8.7) is positive, which
says that there is a positive tradeoff between mar-
ket risk and expected return when investors are
risk averse.
Multiple-beta asset pricing models imply that
combinations of particular portfolios are min-
imum-variance efficient. Equation (8.13) is equiva-
lent to the statement that a combination of K
factor-portfolios is minimum-variance efficient,
when the factors are traded assets. This result is
proved by Grinblatt and Titman (1987), Shanken
(1987), and Huberman et al. (1987). The corres-
pondence between multi-beta pricing and mean
variance efficiency is exploited by Jobson and
Korkie (1982), Gibbons et al. (1989), Kandel and
Stambaugh (1989), and Ferson and Siegel (2005),
among others, to develop tests of multi-beta
models based on mean variance efficiency.
8.5. Factor Models
A beta pricing model has no empirical content
until the factors are specified, since there will al-
most always be a minimum-variance portfolio
which satisfies Equation (8.13), with K ¼ 1. There-
fore, the empirical content of the model is the
discipline imposed in selecting the factors. There
have been four main approaches to finding
empirical factors. The first approach is to specify
empirical proxies for factors specified by the theory.
For example, the CAPM says that the ‘‘market
portfolio’’ of all capital assets is the factor, and
early studies concentrated on finding good meas-
ures for the market portfolio. A second approach is
to use factor analytic or principal components
methods. This approach is motivated by the APT,
as described below. A third approach chooses the
risk factors as economic variables or portfolios,
based on intuition such as that provided by
Equations (8.3) and (8.4). With this approach,
likely candidates for the factors are proxies for
consumer wealth, consumer expenditures, and
variables that may be sufficient statistics for the
marginal utility of future wealth in an optimal
consumption–investment plan. For examples of
this approach, see Chen et al. (1986), Ferson and
Harvey (1991), Campbell (1993), and Cochrane
(1996). A fourth approach to factor selection
forms portfolios by ranking stocks on firm charac-
teristics that are correlated with the cross-section of
average returns. For example, Fama and French
(1993, 1996) use the ratio of book value to market
price, and the relative market value (size) of the firm
to form their ‘‘factors.’’
Lo and MacKinlay (1990), MacKinlay (1995),
and Ferson et al. (1999) provide critiques of the
approach of sorting stocks on empirically motiv-
ated characteristics in order to form asset pricing
factors. Lo and MacKinlay examine the approach
as a version of data mining. MacKinlay argues that
the factors generated in this fashion by Fama and
370 ENCYCLOPEDIA OF FINANCE
French (1993, 1996) are statistically unlikely to
reflect market risk premiums. Ferson, Sarkissian,
and Simin show that a hypothetical characteristic,
bearing an anomalous relation to returns, but com-
pletely unrelated to risk, can be repackaged as a
spurious ‘‘risk factor’’ with this approach. Berk
(1995) emphasizes that the price of a stock is the
value of its future cash flows discounted by future
returns, so an anomalous pattern in the
cross-section of returns would produce a corre-
sponding pattern in ratios of cash flow to price.
Some of the most empirically powerful character-
istics for the cross-sectional prediction of stock re-
turns are ratios, with market price per share in the
denominator. However, patterns that are related to
the cross-section of asset risks are also likely to be
captured by sorting stocks on such ratios. Thus,
the approach of sorting stocks on patterns in
average returns to form factors is potentially
dangerous, because it is likely to ‘‘work’’ when it
‘‘should’’ work, and it is also likely to work when
it should not. At the time this chapter was written
the controversy over such empirically motivated
factors was unresolved.
8.6. Factor Models and the Arbitrage
Pricing Model
The Arbitrage Pricing Model based on the APT of
Ross (1976) is an example of a multiple-beta asset
pricing model, although in the APT Equation (8.13)
is an approximation. The expected returns are ap-
proximately a linear function of the relevant betas
as the number of securities in the market grows
without bound. Connor (1984) provided sufficient
conditions for Equation (8.13) to hold exactly in an
economy with an infinite number of assets, in gen-
eral equilibrium. This version of the multiple-beta
model, the exact APT, has received wide attention
in the finance literature. See Connor and Korajczyk
(1988), Lehmann and Modest (1988), Chen, (1983)
and Burmeister, and McElroy (1988) for discus-
sions on estimating and testing the model when
the factor realizations are not observable, under
auxiliary assumptions.
This section describes the Arbitrage Pricing The-
ory (APT) of Ross (1976), and how it is related to
factor models and to the general SDF representa-
tion for asset pricing models, as in Equation (8.2).
For this purpose, we suppress the time subscripts
and related notation. Assume that the following
data-generating model describes equity returns in
excess of a risk-free asset:
r
i
¼ E(r
i
) þb
0
i
f
þ e
i
,(8:15)
where E( f ) ¼ 0 ¼ E(e
if
), all i, and f
t
¼ F
t
E(F
t
)
are the unexpected factor returns. We can normal-
ize the factors to have the identity as their covar-
iance matrix; the b
i
absorb the normalization. The
N N covariance matrix of the asset returns can
then be expressed as:
Cov(R) S ¼ BB
0
þ V,(8:16)
where V is the covariance matrix of the residual
vector, e, B is the N K matrix of the vectors, b
i
,
and S is assumed to be nonsingular for all N.An
‘‘exact’’ factor structure assumes that V is diag-
onal. An approximate factor model, as described
by Chamberlain (1983) and Chamberlain and
Rothschild (1983), assumes that the eigenvalues
of V are bounded as N !1, while the K non-
zero-eigenvalues of BB’ become infinite as N !1.
Thus, the covariance matrix S has K unbounded
and N–K bounded eigenvalues, as N becomes
large.
The factor model represented in Equation (8.16)
decomposes the variances of returns into ‘‘perva-
sive’’ and ‘‘nonsystematic’’ risks. If x is an
N-vector of portfolio weights, the portfolio vari-
ance is x
0
Sx, where l
max
(S)x
0
x x
0
Sx l
min
(S)
x
0
x, l
min
(S) being the smallest eigenvalue of S and
l
max
(S) being the largest. Following Chamberlain
(1983), a portfolio is ‘‘well diversified’’ if x
0
x ! 0
as N grows without bound. For example, an
equally weighted portfolio is well diversified; in
this case x
0
x ¼ (1=N) ! 0. The bounded eigen-
values imply that V captures the component of
portfolio risk that is not pervasive or systematic,
in the sense that this part of the variance vanishes
ASSET PRICING MODELS 371
in a well-diversified portfolio. The exploding eigen-
values of BB’ imply that the common factor risks
are pervasive, in the sense that they remain in a
large, well-diversified portfolio.
The arbitrage pricing theory of Ross (1976) as-
serts that a
0
a < 1 as N grows without bound,
where a is the N vector of ‘‘alphas,’’ or expected
abnormal returns, measured as the differences be-
tween the left and right hand sides of Equation
(8.13), using the APT factors in the multi-beta
model. The alphas are the differences between the
assets’ expected returns and the returns predicted
by the multi-beta model, also called the ‘‘pricing
errors.’’ The Ross APT implies that the multi-beta
model’s pricing errors are ‘‘small’’ on average, in a
large market. If a
0
a < 1 as N grows, then the
cross-asset average of the squared pricing errors,
(a
0
a)=N must go to 0 as N grows.
The pricing errors in a beta pricing model are
related to those of a SDF representation. If we
define a
m
¼ E(mR À 1), where m is linear in the
APT factors, then it follows that a
m
¼ E(m)a; the
beta pricing and stochastic discount factor alphas
are proportional, where the risk-free rate deter-
mines the constant of proportionality. Provided
that the risk-free rate is bounded above 100 per-
cent, then E(m) is bounded, and a
0
a is bounded
above if and only if a
0
m
a
m
is bounded above. Thus,
the Ross APT has the same implications for the
pricing errors in the SDF and beta pricing para-
digms.
The ‘‘exact’’ version of the APT derived by Con-
nor (1984) asserts that a
0
a ! 0asN grows without
bound, and thus the pricing errors of all assets go
to zero as the market gets large. Chamberlain
(1983) shows that the exact APT is equivalent
to the statement that all minimum-variance port-
folios are well diversified, and are thus combin-
ations of the APT factors. In this case, we have
E(mR 1) ¼ 0 when m is linear in the APT
factors, and a combination of the factors is a
minimum-variance efficient portfolio in the large
market.
8.7. Summary
The asset pricing models of financial economics are
based on an assumption that rules out arbitrage
opportunities, or they rely on explicit equilibrium
conditions. Empirically, there are three central rep-
resentations. The first is the minimum-variance effi-
ciency of a portfolio. The second is the beta pricing
model stated in terms of risk factors, and the third is
the SDF representation. These three representations
are closely related, and become equivalent under
ancilliary assumptions. Together they provide a
rich and flexible framework for empirical analysis.
NOTE
1. It is assumed that the portfolio R
ptþ1
is not the
global minimum-variance portfolio; that is, the min-
imum variance over all levels of expected return.
This is because the betas of all assets on the global
minimum-varianc e portfolio are identical.
REFERENCES
Abel, A.B. (1990). ‘‘Asset prices under habit form ation
and catching up with the Joneses.’’ American Eco-
nomic Review, 80: 38–42.
Barberis, N. and Shleifer, A. (2003). ‘‘Behavioral Fi-
nance,’’ in G.M. Constantinides, M. Harris and
R.M. Stulz (eds.) Handbook of the Economics of
Finance. North Holland: Elsevier.
Becker, G. and Murphy, K.M. (1988). ‘‘A theory of
rational addiction.’’ Journal of Political Economy,
96: 675–700.
Beja, A. (1971). ‘‘The structure of the cost of capital
under uncertainty.’’ Review of Economic Studies, 4:
359–369.
Berk, J. (1995). ‘‘A critique of size-related anomalies.’’
Review of Financial Studies, 8: 275–286.
Bhattacharya, S. (1981). ‘‘Notes on multiperiod valu-
ation and the pricing of options.’’ Journal of Finance,
36: 163–180.
Burmeister, E. and McElroy, M.B. (1988). ‘‘Joint esti-
mation of factor sensitivities and risk premia for the
Arbitrage Pricing Theory.’’ Journal of Finance, 43(3):
721–733.
372 ENCYCLOPEDIA OF FINANCE
Braun, P., Ferson, W.E., and Constantinides, G.M.
(1993). ‘‘Time nonseparability in aggregate con-
sumption: international evidence.’’ European Eco-
nomic Review, 37: 897–920.
Breeden, D. (1979). ‘‘An intertemporal asset pricing
model with stochas tic consumption and investment
opportunities.’’ Journal of Financial Economics,7:
265–296.
Brennan, M.J. and Kraus, A. (1978). ‘‘Necessary
Conditions for Aggregation in Securities Markets.’’
Journal of Financial and Quantitative Analysis,
407–418.
Campbell, J.Y. (1993). ‘‘Intertemporal Asset Pricing
without consumption data.’’ American Economic Re-
view, 83: 487–512.
Campbell, J.Y. and Cochrane J.H. (1999). ‘‘By force of
habit: a consumption-based explanation of aggregate
stock market behavior.’’ Journal of Political Eco-
nomy, 107: 205–251.
Chamberlain, G. (1983). ‘‘Funds, factors and diversifi-
cation in arbitrage pricing models.’’ Econometrica,
51: 1305–1324.
Chamberlain, G. and Roths child, M. (1983).
‘‘Arbitrage, factor structure and mean variance
analysis on large asset markets.’’ Econometrica, 51:
1281–1304.
Chen, N.F. (1983). ‘‘Some empirical tests of the theory
of arbitrage pricing.’’ Journal of Finance, 38:
1393–1414.
Chen, N., Roll, R., and Ross, S. (1986). ‘‘Economic
forces and the stock market.’’ Journal of Business,
59: 383–403.
Cochrane, J.H. (1996). ‘‘A cross-sectional test of a
production based asset pricing model, working
paper.’’ Journal of Political Economy, 104: 572–621.
Cochrane, J.H. (2001). Asset Pricing. Princeton, NJ:
Princeton University.
Connor, G. (1984). ‘‘A unifi ed beta pricing Theory.’’
Journal of Economic Theory, 34: 13–31.
Connor, G. and Korajczyck, R. (1988). ‘‘Risk and re-
turn in an equilibrium APT: application of a new test
methodology.’’ Journal of Financial Economics, 21:
255–290.
Constantinides, G.M. (1982). ‘‘Intertemporal Asset Pri-
cing with heterog eneous consumers and without
demand Aggregation.’’ Journal of Business, 55:
253–267.
Constantinides, G.M. (1990). ‘‘Habit formation: a reso-
lution of the equity premium puzzle.’’ Journal of
Political Economy, 98: 519–543.
Constantinides, G.M. and Duffie, D. (1996). ‘‘Asset
pricing with heterogenous consummers.’’ Journal of
Political Economy, 104: 219–240
Cox, J.C., Ingersoll, J.E., and Ross, S.A. (1985).
‘‘A theory of the term structure of interest rates.’’
Econometrica, 53: 385–408.
Cragg, J.G. and Malkiel, B.G. (1982). Expectat ions and
the Structure of Share Prices. Chicago: University of
Chicago Press.
Dunn, K.B. and Singleton, K.J. (1986). ‘‘Modelling the
term structure of interest rates under non-separable
utility and durability of goods.’’ Journal of Financi al
Economics, 17: 27–55.
Dybvig, P.H. (1983). ‘‘An explicit bound on individual
assets’ deviations from APT pricing in a finite eco-
nomy.’’ Journal of Financial Economics, 12: 483–496.
Dybvig, P. and Ingersoll, J. (1982). ‘‘Mean variance
theory in complete markets.’’ Journal of Business,
55: 233–252.
Eichenbaum, M .S., Hansen, L.P., and Singleton, K.J.
(1988). ‘‘A time series analysis of representative
agent models of consumption and leisure choices
under uncertainty.’’ Quarterly Journal of Economics,
103: 51–78.
Epstein, L.G. and Zin , S.E. (1989). ‘‘Substitution, risk
aversion and the temporal behavior of asset returns:
a theoretical approach.’’ Econometrica, 57: 937 –970.
Epstein, L.G. and Zin , S.E. (1991). ‘‘Substitution, risk
aversion and the temporal behavior of asset returns.’’
Journal of Political Economy, 99: 263–286.
Fama, E.F. and French, K.R. (1993). ‘‘Common risk
factors in the returns on stocks and bonds.’’ Journal
of Financial Economics, 33: 3–56.
Fama, E.F. and French, K.R. (1996). ‘‘Multifact or ex-
planations of asset pricing anomalies.’’ Journal of
Finance, 51: 55–87.
Ferson, W.E. (1983). ‘‘Expectations of real interest rates
and aggregate consumption: empirical tests.’’ Journal
of Financial and Quant itative Analysis, 18: 477–497.
Ferson, W.E. (1995). ‘‘Theory and empirical testing of
asset pricing models,’’ in J. Maksimovic, and Ziemba
(eds.) Handbooks in Operations Research and Man-
agement Science. Amsterdam: Elsevier.
Ferson, W.E. and Constantinides, G.M. (1991). ‘‘Habit
persistence and durability in aggregate consumption:
empirical tests.’’ Journal of Financial Economics, 29:
199–240.
Ferson, W.E. and Harvey, C.R. (1991). ‘‘The Variation
of Economic Risk Premiums.’’ Journal of Political
Economy, 99: 385–415.
ASSET PRICING MODELS 373
Ferson, W.E. and Harvey, C.R. (1992). ‘‘Seasonality
and consumption based Asset Pricing Models.’’
Journal of Finance, 47: 511–552.
Ferson, W.E. and Jagannathan, R. (1996). ‘‘Economet-
ric evaluation of Asset Pricing Models,’’ in G.S.
Maddala and C.R. Rao (eds.) Handbook of Sta-
tistics: volume 14: Statistical Methods in Finance.
Amsterdam, the Netherlands.
Ferson, W.E. and Merrick, J.J. (1987) ‘‘Non-stationar-
ity and stage of the business cycle effects in consump-
tion-based asset pricing relations.’’ Journal of
Financial Economics, 18: 127–146.
Ferson, W.E., Sarkissian, S., and Simin, T. (1999). ‘‘The
alpha factor Asset Pricing Model: a parable.’’ Jour-
nal of Financial Markets, 2: 49–68.
Ferson, W.E. and Siegel, A.F. (2005). ‘‘Testing port-
folio efficiency with conditioning information,’’
Working paper, Boston College.
Gibbons, M.R.,. Ross, S.A., and Shanken, J. (1989).
‘‘A test of the efficiency of a given portfolio.’’ Econ-
ometrica, 57: 1121–1152.
Gorman, W.M. (1953). ‘‘Community Preference
Fields.’’ Econometrica, 21: 63–80.
Grinblatt, M. and Titman, S. (1983). ‘‘Factor pricing in
a finite economy.’’ Journal of Financial Economics,
12: 497–508.
Grinblatt, M. and Titman, S. (1987). ‘‘The relation
between mean-variance efficiency and arbitrage pri-
cing.’’ Journal of Business, 60: 97–112.
Grossman, S. and Shiller, R.J. (1982). ‘‘Consumption
correlatedness and risk measurement in economies
with nontraded assets and heterogeneous informa-
tion.’’ Journal of Financial Economics, 10: 195–210.
Hansen, L. P. and Richard, S. F. (1987). ‘‘The role of
conditioning information in deducing testable re-
strictions implied by dynamic asset pricing models.’’
Econometrica, 55: 587–613.
Hansen, L.P. and Singleton, K.J. (1982). ‘‘Generalized
instrumental va riables estimation of nonlinear ra-
tional expectations models.’’ Econometrica, 50:
1269–1285.
Hansen, L.P. and Singleton, K.J. (1983). ‘‘Stochastic
consumption, risk aversion and the temporal behav-
ior of asset returns.’’ Journal o f Political Economy,
91: 249–266.
Harrison, M. and Kreps, D. (1979). ‘‘Martingales and
arbitrage in multi-period securities markets.’’ Journal
of Economic Theory, 20: 381–408.
Heaton, J. (1993). ‘‘The interaction between time-non-
separable preferences and time aggregation.’’ Econo-
metrica, 61(2): 353–385.
Huberman, G., Kandel, S.A., and Stambaugh, R.F.
(1987). ‘‘Mimicking portfolios and exact arbitrage
pricing.’’ Journal of Finance, 42: 1–10.
Jobson, J.D. and Korkie, R. (1982). ‘‘Potential per-
formance and tests of portfolio efficiency.’’ Journal
of Financial Economics, 10: 433–466.
Kandel, S. and Stambaugh, R.F. (1989). ‘‘A mean vari-
ance framework for tests of asset pricing models.’’
Review of Financial Studies, 2: 125–156.
Lee, C.F., Wu, C., and Wei, K.C.J. (1990). ‘‘The het-
erogeneous investment horizon and the capital asset
pricing model: theory and implications.’’ Journal of
Financial and Quantitative Analysis, 25: 361–376.
Lehmann, B.N. and Modest, D.M. (1988). ‘‘The empir-
ical foundations of the arbitrage pricing theory.’’
Journal of Financial Economics, 21: 213–254.
Lintner, J. (1965).‘‘The valuation of risk assets and the
selection of risky investments in stock portfolios and
capital budgets.’’ Review of Economics and Statistics,
47: 13–37.
Lo, A.W. and MacKinlay, A.C. (1990). ‘‘Data snooping
in tests of financial asset pricing mod els.’’ Review of
Financial Studies, 3: 431–467.
Long, J. (1974). ‘‘Stock prices, inflation, and the term
structure of interest rates.’’ Journal of Financial Eco-
nomics, 1: 131–170.
Lucas, Jr. R.E. (1978). ‘‘Asset prices in an exchange
economy.’’ Econometrica, 46: 1429–1445.
MacKinlay, A.C. (1995). ‘‘Multifactor models do not
explain deviations from the CAPM.’’ Journal of Fi-
nancial Economics, 38: 3–28.
Merton, R. C. (1973). ‘‘An intertemporal capital asset
pricing model.’’ Econometrica, 41: 867–887.
Mossin, J. (1966). ‘‘Equilibrium in a capital asset mar-
ket.’’ Econometrica, 34(4): 768–783.
Roll, R. (1977). ‘‘A critique of the asset pricing theory’s
tests -part 1: On past and potential testability of the
theory.’’ Journal of Financial Economics, 4: 129–176.
Ross, S. A. (1976). ‘‘The arbitrage pricing theory of
capital asset pricing.’’ Journal of Economic Theory,
13: 341–360.
Ross, S. (1977). ‘‘Risk, return and arbitrage,’’ in
I. Friend and J. Bicksler (eds.) Risk and Return in
Finance Ballinger. Cambridge: Mass.
Rubinstein, M. (1974). ‘‘An aggregation theorem for
securities markets.’’ Journal of Financial Economics,
1: 225–244.
Rubinstein, M. (1976). ‘‘The valuation of uncertain
income streams and the pricing of options.’’ Bell
Journal of Economics and Management Science,7:
407–425.
374 ENCYCLOPEDIA OF FINANCE
Ryder, Jr. H.E. and Heal, G.M. (1973). ‘‘Optimal
growth with intertemporally dependent preferences.’’
Review of Economic Studies, 40: 1–31.
Sarkissian, S. (2003). ‘‘Incomplete consumption risk
sharing and currency premiums.’’ Review of Financial
Studies, 16: 983–1005.
Shanken, J. (1987). ‘‘Multivariate Proxies and
Asset Prici ng Relations: Living with the Roll Cri-
tique.’’ Journal of Financial Economics, 18:
91–110.
Sharpe, W. F. (1964). ‘‘Capital asset prices: a theory of
market equilibrium under conditions of risk.’’ Jour-
nal of Finance, 19: 425–442.
Sharpe, W. F. (1977). ‘‘The capital asset pricing model:
a multi-beta interpretation,’’ in H. Levy and
M. Sarnat, (eds.) Financial Decision making under
uncertainty. New York: Academic Press.
Singleton, K.J. (1990). ‘‘Specification and estimation of
intertemporal Asset Pricing Modelas,’’ in E. Fried-
man and F. Hahn (eds.) Handbook of Monetary Eco-
nomics. North Holland: Elsevier.
Sundaresan, S. M. (1989). ‘‘Intertemporally dependent
preferences and the volatility of consumption and
wealth.’’ Review of Financial Studies, 2: 73–89.
Wilson, R. B. (1968). ‘‘The theory of syndicates.’’ Econ-
ometrica, 36: 119–131.
ASSET PRICING MODELS 375